Comparative analyses of 32 complete plastomes of Tef (Eragrostis tef ) accessions from Ethiopia: phylogenetic relationships and mutational hotspots
- Published
- Accepted
- Received
- Academic Editor
- Kun Lu
- Subject Areas
- Agricultural Science, Evolutionary Studies, Genomics, Plant Science, Population Biology
- Keywords
- Eragrostis tef, Plastome, Molecular barcoding, Polymorphic regions, Phylogenetic analysis
- Copyright
- © 2020 Teshome et al.
- Licence
- This is an open access article distributed under the terms of the Creative Commons Attribution License, which permits unrestricted use, distribution, reproduction and adaptation in any medium and for any purpose provided that it is properly attributed. For attribution, the original author(s), title, publication source (PeerJ) and either DOI or URL of the article must be cited.
- Cite this article
- 2020. Comparative analyses of 32 complete plastomes of Tef (Eragrostis tef ) accessions from Ethiopia: phylogenetic relationships and mutational hotspots. PeerJ 8:e9314 https://doi.org/10.7717/peerj.9314
Abstract
Eragrostis tef is an important cereal crop in Ethiopia with excellent storage properties, high–quality food, and the unique ability to thrive in extreme environmental conditions. However, the application of advanced molecular tools for breeding and conservation of these species is extremely limited. Therefore, developing chloroplast genome resources and high-resolution molecular markers are valuable to E. tef population and biogeographic studies. In the current study, we assembled and compared the complete plastomes of 32 E. tef accessions. The size of the plastomes ranged from 134,349 to 134,437 bp with similar GC content (∼38.3%). Genomes annotations revealed 112 individual genes, including 77 protein-coding, 31 tRNA, and 4 rRNA genes. Comparison of E. tef plastomes revealed a low degree of intraspecific sequence variations and no structural differentiations. Furthermore, we found 34 polymorphic sites (13 cpSSRs, 12 InDels, and 9 SNPs) that can be used as valuable DNA barcodes. Among them, the majority (88%) of the polymorphic sites were identified in the noncoding genomic regions. Nonsynonymous (ka) and synonymous (ks) substitution analysis showed that all PCGs were under purifying selection (ka/ks <1). The phylogenetic analyses of the whole plastomes and polymorphic region sequences were able to distinguish the accession from the southern population, indicating its potential to be used as a super-barcode. In conclusion, the newly generated plastomes and polymorphic markers developed here could be a useful genomic resource in molecular breeding, population genetics and the biogeographical study of E. tef.
Introduction
The genus Eragrostis comprises approximately 400 morphologically distinct species distributed throughout the subtropical and tropical regions of the world (Clayton et al., 2016). Eragrostis tef (Zucc.) Trotter is the sole species in the genus Eragrostis cultivated for human consumption and Ethiopia is the center of origin and genetic diversity for E. tef (Ketema, 1997). Compared to other cereal crops, E. tef is more tolerant of extreme environmental conditions and is therefore considered as lower risk crop (Assefa et al., 2015). These characteristics, together with its grain nutrition, market value, desirable storage properties, make this crop attractive to smallholder farmers (Minten, Taffesse & Brown, 2018). The grain of E. tef is also gaining global popularity as healthy and high-performance food due to its high fiber contents and gluten-free nature (Spaenij-Dekking, 2005; Chanyalew et al., 2019). The long history of cultivation and variety selection coupled with the broad agro-ecology adaptation of the crop resulted in high genetic diversity in Ethiopia (Assefa, Chanyalew & Tadele, 2017). Currently, more than 5,000 E. tef accessions collected from different geographic regions of Ethiopia are preserved in the seed gene bank of the Ethiopia Biodiversity Institute (EBI; Tesema, 2013). The conserved accessions are the main sources of genetic variations to enrich the genetic base of cultivated varieties. To establish proper conservation and efficient utilization of the plant genetic resource, understanding genetic variations between and within gene bank samples is essential (Wambugu, Ndjiondjop & Henry, 2018). However, the studies of genetic diversity among accessions of E. tef are still highly limited and one of the most important reasons is the lack of effective molecular markers (Tadele, 2018; Chanyalew et al., 2019).
Advances in biotechnology, especially in the area of molecular biology has provided some critical tools for proper conservation and use of plant genetic resources (Yuan et al., 2017). From the perspective of improving crops through modern breeding programs, molecular markers have played significant roles, especially in the determination of genetic diversity and the classification of germplasm (Majeed et al., 2015; Nadeem et al., 2017). During the last few decades, several universal molecular markers such as amplified fragment length polymorphism (AFLP) (Bai et al., 1999), simple sequence repeats (SSR) (Abraha et al., 2016), random amplified polymorphic DNA (RAPD) (Bai et al., 2000) and inter simple sequence repeat (ISSR) (Assefa, Merker & Tefera, 2004) have been used in E. tef. Moreover, first draft genome (Cannorazzi et al., 2014) and chromosome-scale genome assembly (VanBure et al., 2020) of E. tef have been made publicly available online. These molecular studies have provided some insight into E. tef population genomics and phylogenetic relationships. Furthermore, the utilization of some universal chloroplast markers for the phylogenetic studies have been reported in previous studies (Espelund et al., 2000; Ingram & Doyle, 2003). The available reports concerning the E. tef plastome sequence variability are insufficient for population genetics and biogeographic studies (Assefa et al., 2011; Assefa et al., 2015. Also, there is no valuable molecular barcoding system to discriminate and classify the conserved accessions according to their geographical regions of collection. These will have a direct effect on the conservation and the sustainable utilization of the crop. Therefore, sequencing and comparative analysis of the plastome have the potential to detect intraspecific polymorphism and provide useful molecular markers for various studies in E. tef.
The plastome is commonly characterized by an extremely conserved structure and possessed a relatively slow evolutionary tempo (Greiner, Sobanski & Bock, 2015). It generally comprises a pair of inverted repeats (IRs) regions, one large single-copy (LSC) region and one small single-copy (SSC) region (Brears, Schardl & Lonsdale, 1986). Although overall plastome structure is always thought to be conserved, structural variations such as inversion (Lei et al., 2016; Kim & Cullis, 2017), gene duplication and IR boundary shifts (Zhu et al., 2016) have been detected among angiosperms. For the mutations of sequences, the single nucleotide polymorphism (SNP) and deletion or insertion (InDels) of nucleotide bases are the most common variations in the sequences of plastome (Decesare, Hodkinson & Barth, 2010; Kim et al., 2015). These variations have provided ideal information for developing polymorphic markers for numerous applications such as molecular barcoding (Okoth et al., 2016; Zong et al., 2019), phylogenetic reconstruction (Peterson, Romaschenko & Johnson, 2010), biogeographic studies (Kress et al., 2009; Xie et al., 2019), assessment of the maternal line of hybrid species (Schroeder, Höltken & Fladung, 2011; Tomar et al., 2014; Chung et al., 2019), and clarification of the evolutionary relationship between cultivated and crop wild relatives (Gao et al., 2019). Currently, with the advancement of next-generation sequencing technologies (NGS), sequencing of chloroplast genomes and the development of plastid genetic markers have become feasible in various plant genetic researches (Brozynska, Furtado & Henry, 2014; Bi et al., 2018).
In this study, the complete plastomes of 32 E. tef accessions were newly sequenced and assembled. All these plastomes were compared to examine the intraspecific chloroplast genomes sequence variability, to our knowledge, to gain the first compressive analysis of plastome structural variations and mutations across E. tef plastome. Specifically, the distribution of chloroplast simple sequence repeats (cpSSRs), single nucleotide polymorphism (SNPs) and InDels regions were investigated. Besides, phylogenetic analysis was performed to evaluate the genetic relationship of the studied accessions with their respective biogeographic distribution using variable sites detected in the present study. We also examined the impact of identified sequence variations on the evolution of protein-coding genes (PCGs). The markers could be a useful genomic resource for use in various studies such as molecular breeding, molecular barcoding, biogeography and population genetic diversity studies in E. tef.
Material and Methods
Plant sampling and DNA extraction
A total of 32 E. tef accessions were obtained from the Ethiopian Biodiversity Institute (EBI) seed genebank. These accessions were sampled from Amhara, Benishanguz Gumuz, Tigray, Oromia, and Southern regions, representing the geographic distribution of the species in Ethiopia (Fig. 1, Table 1). Ethiopian Biodiversity Institute approved this study (EBI 712222942018). The collected leaves were dried immediately using silica gel and preserved in the refrigerator (−20 °C) until DNA extraction. Total genomic DNA was isolated from the dried leaf of each accession using the MagicMag Genomic DNA Micro Kit (Sangon Biotech Co., Shanghai, China) following the protocol given by the manufacturer. The purity and quality of the DNA were detected by electrophoresis on the 1% agarose gel.
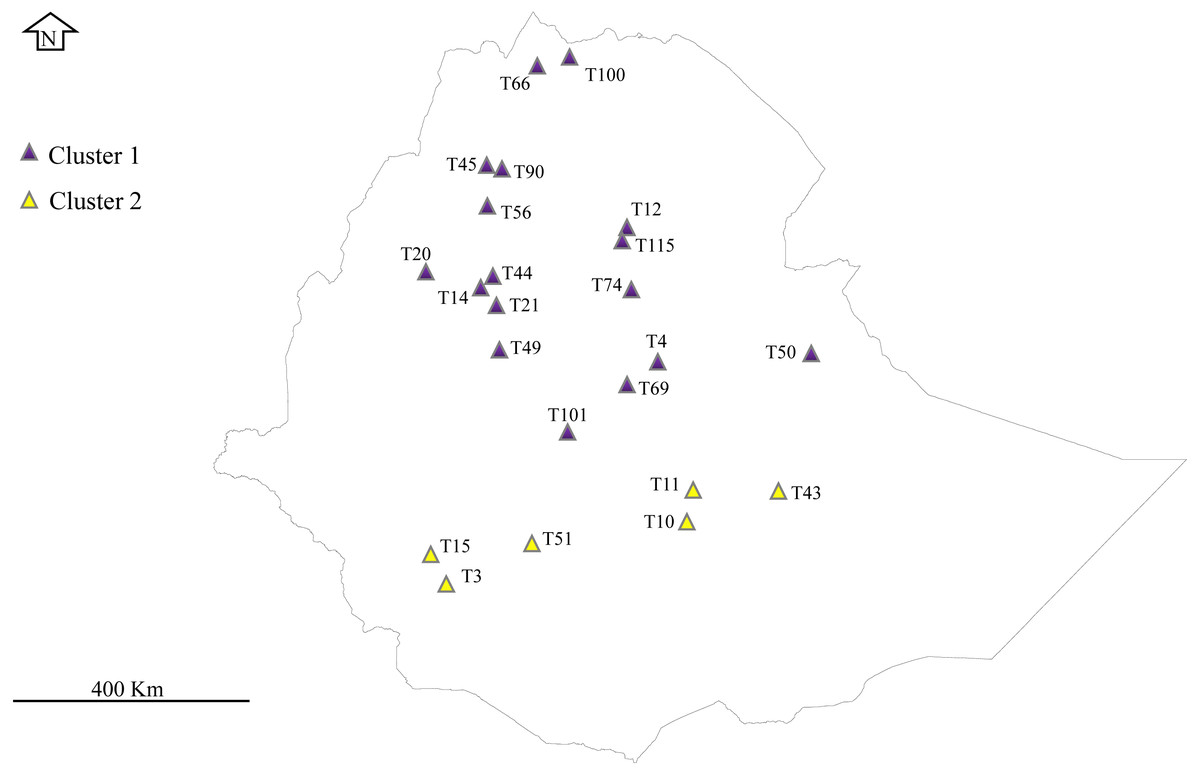
Figure 1: Phylogeographical distribution of sampled E. tef accessions.
The accessions collected from southern Ethiopia (cluster 2) were represented by yellow color. The blue color represents the accessions originated from the north and central part of Ethiopia. Sample without detail GPS points, including T1, T16, T24, T34, T36, T68, T93, T81 and T116 were not represented in the map. DIV-GIS software was used to show the GPS location of the accessions collection sites in Ethiopia.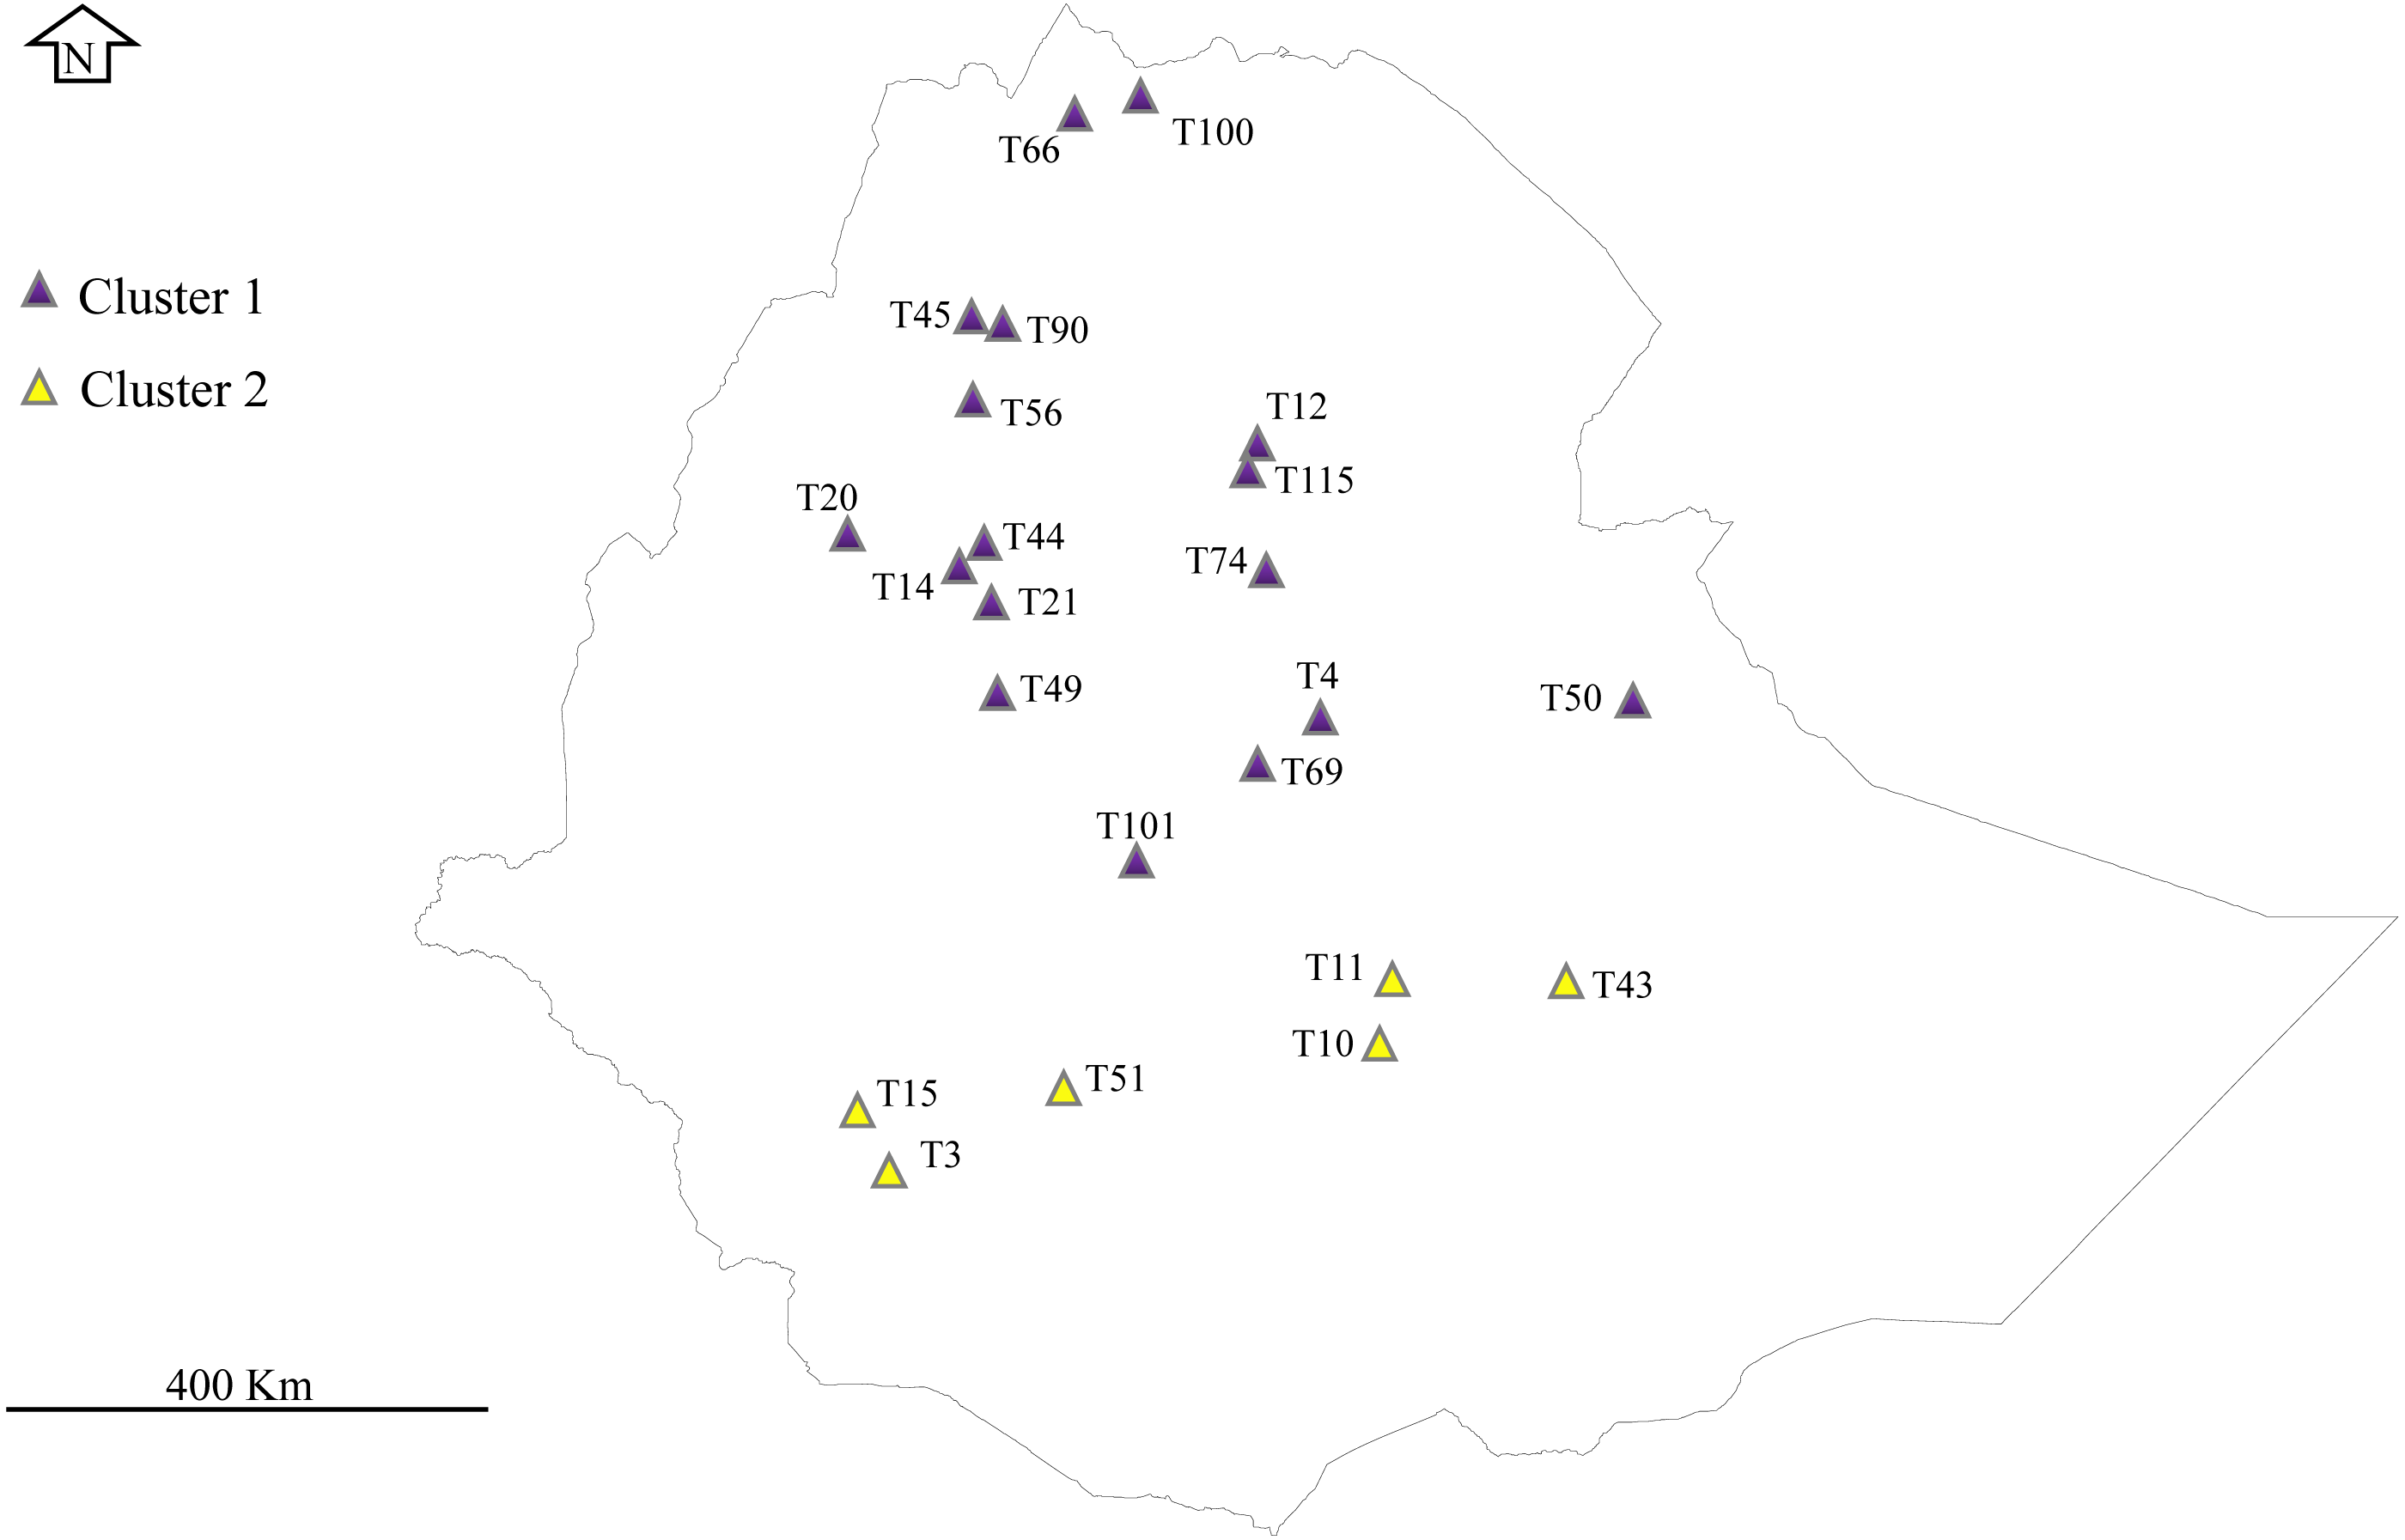
Chloroplast genome sequencing, assembly and annotation
Short inserts of ∼350 bp DNA sequencing library for each sample was constructed using TruSeq DNA sample preparation kits (Illumina, San Diego, CA, USA). And 150 bp paired-end reads sequencing was carried out using the Illumina Hiseq 2500 Platform (Illumina, San Diego, CA) at the Beijing Genomics Institute (Shenzhen, China). Approximately 10G raw data of each sample was generated, then filtered using Fastp with default parameters (Chen et al., 2018). The remaining clean reads were de novo assembled using NOVOPlasty 2.7.1 (Dierckxsens, Mardulyn & Smits, 2017) with Kmer 31–39, where E. tef (Gene bank accession no. NC_029413) was used as the seed and reference sequence. Finally, only one contig per accession was generated, then we remapped them against the previously published plastome of E. tef (NC_029413) using the software GENEIOUS R 8.0.2 (Kearse et al., 2012). Annotation of the assembled genomes was performed using the GeSeq (https://chlorobox.mpimp-golm.mpg.de/geseq.html; Tillich et al., 2017). In order to confirm the accuracy of annotation, each annotated gene was checked for start and stop codons using the software GENEIOUS R 8.0.2 (Kearse et al., 2012) manually. A circular map for the plastome was drawn using the OrganellerGenomeDraw 1.3.1 (OGDRAW) (Greiner, Lehwark & Bock, 2019). For the structural comparison, alignments of 32 plastomes were compared using mVISTA software (Frazer et al., 2004). In order to detect the IR expansions/contraction, all the annotated plastome sequences for the 32 E. tef accessions were compared to the LSC, SSC and IRs border using an online program IRscope (https://irscope.shinyapps.io/irapp/; Amiryousefi et al., 2018). All annotated plastome sequences were submitted to the National Center for Biotechnology Information (NCBI) database (accession numbers: MN780987 to MN781018).
| No | Sequence code |
Original country |
Latitude | Longitude | Altitude (m) |
Genome size |
LSC (bp) | IR(bp) | SSC(bp) | EBI voucher |
Genebank accession ID |
|---|---|---|---|---|---|---|---|---|---|---|---|
| 1 | T1 | ETH | 11°28′00″N | 39°17′00″E | 1,900 | 134,350 | 79,726 | 21,022 | 12,580 | 234,760 | MN781003 |
| 2 | T3 | ETH | 05°59′00″N | 37°32′00″E | 1,250 | 134,437 | 79,795 | 21,021 | 12,600 | 235,659 | MN781007 |
| 3 | T4 | ETH | 08°50′93″N | 39°00′00″E | NA | 134,351 | 79,728 | 21,021 | 12,581 | 221,627 | MN781018 |
| 4 | T10 | ETH | 06°58′49″N | 40°29′11″E | 1,783 | 134,349 | 79,726 | 21,021 | 12,581 | 28658 | MN781011 |
| 5 | T11 | ETH | 07°01′23″N | 40°20′56″E | 2,140 | 134,352 | 79,729 | 21,021 | 12,581 | 28660 | MN781004 |
| 6 | T12 | ETH | 11°23′00″N | 39°19′00″E | 2,630 | 134,352 | 79,729 | 21,021 | 12,581 | 234,764 | MN780995 |
| 7 | T14 | ETH | 10°27′00″N | 37°02′00″E | 2,440 | 134,349 | 79,726 | 21,021 | 12,581 | 55172 | MN781009 |
| 8 | T15 | ETH | 06°02′32″N | 37°24′57″E | 2,338 | 134,418 | 79,794 | 21,021 | 12,582 | 29751 | MN781006 |
| 9 | T16 | ERT | NA | NA | NA | 134,358 | 79,733 | 21,022 | 12,581 | 233,294 | MN781010 |
| 10 | T20 | ETH | 10°59′00″N | 36°38′00″E | 1,815 | 134,351 | 79,728 | 21,021 | 12,581 | 243,553 | MN780992 |
| 11 | T21 | ETH | 10°02′38″N | 37°22′15″E | 2,048 | 134,350 | 79,727 | 21,021 | 12,581 | 26358 | MN781013 |
| 12 | T24 | ETH | NA | NA | 1,600 | 134,421 | 79,797 | 21,021 | 12,582 | 202,439 | MN780993 |
| 13 | T34 | ETH | NA | NA | 2,800 | 134,351 | 79,728 | 21,021 | 12,581 | 206,841 | MN780989 |
| 14 | T36 | ETH | NA | NA | 1,550 | 134,350 | 79,727 | 21,021 | 12,581 | 236,495 | MN780991 |
| 15 | T43 | ETH | 07°03′53″N | 41°04′00″E | 1,248 | 134,419 | 79,795 | 21,021 | 12,582 | 28561 | MN780994 |
| 16 | T44 | ETH | 10°41′00″N | 37°22′00″E | 1,890 | 134,349 | 79,726 | 21,021 | 12,581 | 234,720 | MN781012 |
| 17 | T45 | ETH | 12°21′00″N | 37°31′00″E | 1,920 | 134,351 | 79,728 | 21,021 | 12,581 | 243,537 | MN781005 |
| 18 | T49 | ETH | 09°26′00″N | 37°07′00″E | 2,340 | 134,349 | 79,726 | 21,021 | 12,581 | 55263 | MN780999 |
| 19 | T50 | ETH | 09°30′00″N | 42°37′00″E | 1,925 | 134,351 | 79,727 | 21,022 | 12,582 | 29754 | MN781017 |
| 20 | T51 | ETH | 06°30′57″N | 38°34′14″E | 2,563 | 134,422 | 79,798 | 21,021 | 12,582 | 55126 | MN780996 |
| 21 | T56 | ETH | 11°45′00″N | 37°05′00″E | 1,955 | 134,351 | 79,728 | 21,021 | 12,581 | 242,143 | MN780990 |
| 22 | T66 | ETH | 14°06′00″N | 38°09′00″E | 1,300 | 134,350 | 79,727 | 21,021 | 12,581 | 238,202 | MN780987 |
| 23 | T68 | ETH | NA | NA | NA | 134,349 | 79,726 | 21,021 | 12,581 | 236,738 | MN781015 |
| 24 | T69 | ETH | 08°50′00″N | 39°20′00″E | 1,700 | 134,351 | 79,728 | 21,021 | 12,581 | 236,957 | MN781002 |
| 25 | T74 | ETH | 10°32′00″N | 39°55′00″E | 1,480 | 134,349 | 79,726 | 21,021 | 12,581 | 237,133 | MN781000 |
| 26 | T81 | ETH | NA | NA | 2,144 | 134,412 | 79,789 | 21,021 | 12,581 | 244,855 | MN780988 |
| 27 | T90 | ETH | 12°17′00″N | 37°44′00″E | 1,855 | 134,350 | 79,727 | 21,021 | 12,581 | 242,187 | MN781001 |
| 28 | T93 | ETH | NA | NA | 2,320 | 134,355 | 79,732 | 21,021 | 12,581 | 236,525 | MN780997 |
| 29 | T100 | ETH | 14°12′00″N | 38°56′00″E | 2,020 | 134,350 | 79,727 | 21,021 | 12,581 | 237,210 | MN780998 |
| 30 | T101 | ETH | 07°50′00″N | 39°05′00″E | 1,740 | 134,350 | 79,727 | 21,021 | 12,581 | 237,578 | MN781016 |
| 31 | T115 | ETH | 11°08′00″N | 39°13′00″E | 3,090 | 134,414 | 79,790 | 21,021 | 12,582 | 243,491 | MN781008 |
| 32 | T116 | ETH | 11°08′00″N | 39°13′00″E | 3,090 | 134,350 | 79,727 | 21,021 | 12,581 | 243,503 | MN781014 |
Notes:
- ETH
-
Ethiopia
- ERT
-
Eritrea
- EBI
-
Ethiopian Biodiversity Institute seed bank accession number
- NA
-
not available
Screening variable regions and intraspecific comparison
Considering the wide range of cpSSR markers applications in the breeding scheme, population and phylogenetic studies (Melotto-Passarin et al., 2011; Diekmann, Hodkinson & Barth, 2012; Ebrahimi et al., 2019), Firstly, we detected the location and types of cpSSRs in the plastome of E. tef accessions using MISA perl script (Beier et al., 2017). The minimum number of repeat unit was adjusted to eight, six, five, five, three, and three, for mononucleotides, dinucleotides, trinucleotides, tetranucleotides, pentanucleotides, and hexanucleotides, respectively. We then employed REPuter (Kurtz et al., 2001) to identify four types of large repeating sequences (reverse, forward, complement and palindromic) with a minimum repeat size of 30 bp, hamming distance equal to 3 and maximum computed repeats was set to 50 bp. To compare the cpSSR of E. tef with related species, three chloroplast genomes were chosen from sub-family Chlorodoideae including Eragrostis minor (NC_029413), Neyraudia reynadiana (NC_024262), and Melanocenchris abyssinica (NC_036694)and cpSSRs were detected using MISA (Beier et al., 2017)) with same settings. Multiple alignments of 32 plastomes performed using an online program MAFFT 7 (Katoh, Rozewicki & Yamada, 2017) with default parameters, and then mapped to reference genome using GENEIOUS R 8.0.2 (Kearse et al., 2012). Using the cpSSR information of T3 as the reference, we screened the variable cpSSR among the aligned plastomes of all accessions. After masked the polymorphic cpSSR regions, we further identified the SNPs and InDels separately, as well as their positions in the mapped genome. Additionally, if the polymorphic positions located in the coding sequences, we aligned the sequences using GENEIOUS R 8.0.2 (Kearse et al., 2012) to analyze further if there are any changes in the amino acid of the gene containing variable sites. The primers for all identified variable regions were designed using the online Primer 3.0 (http://bioinfo.ut.ee/primer3/) program with default parameters.
Phylogenetic analysis
The phylogenetic trees were constructed using two data sets: (1) the complete plastome sequences of 32 E. tef accessions (2) concatenation of sequences extracted from twenty polymorphic regions (SNPs and InDels) identified in the current study. Sequence length was determine based on the designed PCR product and was tested for their performance in delineating accessions based on their phylogeographic origin. Before the phylogenetic tree construction, one copy of the IR was removed from the complete chloroplast genome. All sequences alignment was accomplished using MAFFT 7 (Katoh, Rozewicki & Yamada, 2017) plugin in Phylosuite 1.2.1 (Zhang et al., 2019). The phylogenetic analyses were performed using maximum likelihood (ML) and Bayesian inference (BI). ModelFinder (Kalyaanamoorthy et al., 2017) was used to select the best-fit model with default setting and the maximum likelihood (ML) analysis was performed using IQ-TREE 1.6.12 (Trifinopoulos et al., 2016) with 1000 bootstrap replications. The BI analysis was performed by MrBayes 3.2.6 (Ronquist et al., 2012), with a total of 2,000,000 generations set to perform the analysis. Four chains run with sampling after every 3000 generations and the first 25% trees were discarded as burn-in, and the remaining trees were constructed a majority rule consensus tree.
Analyses of signatures of selection
To detect the evidence of selective acting in mutational PCGs, the ratio of nonsynonymous (ka) to synonymous (ks) substitution (ka/ks) of mutational PCGs were calculated using DnaSP version. (Librado & Rozas, 2009). Each extracted PCGs with mutational was aligned using GENEIOUS R 8.0.2 (Kearse et al., 2012) and average pairwise values of ka/ks ratio were determined for all accessions.
Results
Feature of sequenced E. tef plastomes
The size of the complete plastome sequences of E. tef ranged from 134,349 to 134,437 bp (Table 1). They possess a pair of IRs regions (42,042–42,044 bp), one pair of IRs regions (42,042–42,044 bp), one LSC region (79,726–79,798 bp) and one SSC region (12,581–12,600 bp). The guanine-cytosine (GC) content of plastomes was approximately 38.3% and the IR region was slightly higher (44%) compared to LSC (36.3%) and SSC (32.1%) regions. For analysis of the IR junction (contraction/expansion), we compared the border between LSC/IRb/SSC/IRa of all 32 E. tef accessions, and also observed highly conserved IR junction sites (Fig. S1).
All 32 E. tef plastomes possessed common gene contents, which included a total of 112 individual genes, including 77 PCGs, 31tRNAs and 4 ribosomal RNA genes (Fig. 2). Among these, the LSC region contains 59 PCGs and 22 of them are tRNA genes, while 10 PCG and one tRNA genes are located in the SSC region. Eight PCGs (rps7, rps12, rps15, rpl2 , rpl23 rps19, ndhB, yf68), eight tRNA (trnI-CAU, trnH-GUG, trnL-CAA, trnI-GAU, trnV-GAC, trnR-ACG, trnA-UGC, trnN-GUU) and four rRNA genes (rrn4.5, rrn5, rrn16, rrn23) were duplicated in IR regions. Fifteen genes contained introns, of which nine of them are PCGs (ndhA, ndhB, petB, petD, atpF, rps12, rps16, rpl2 and rpl16) and five tRNA genes (trnA-UGC, trnV-UAC, trnK-UUU, trnG-UCC, and trnI-GAU) had one intron, and ycf3 gene contained three introns (Table S1).
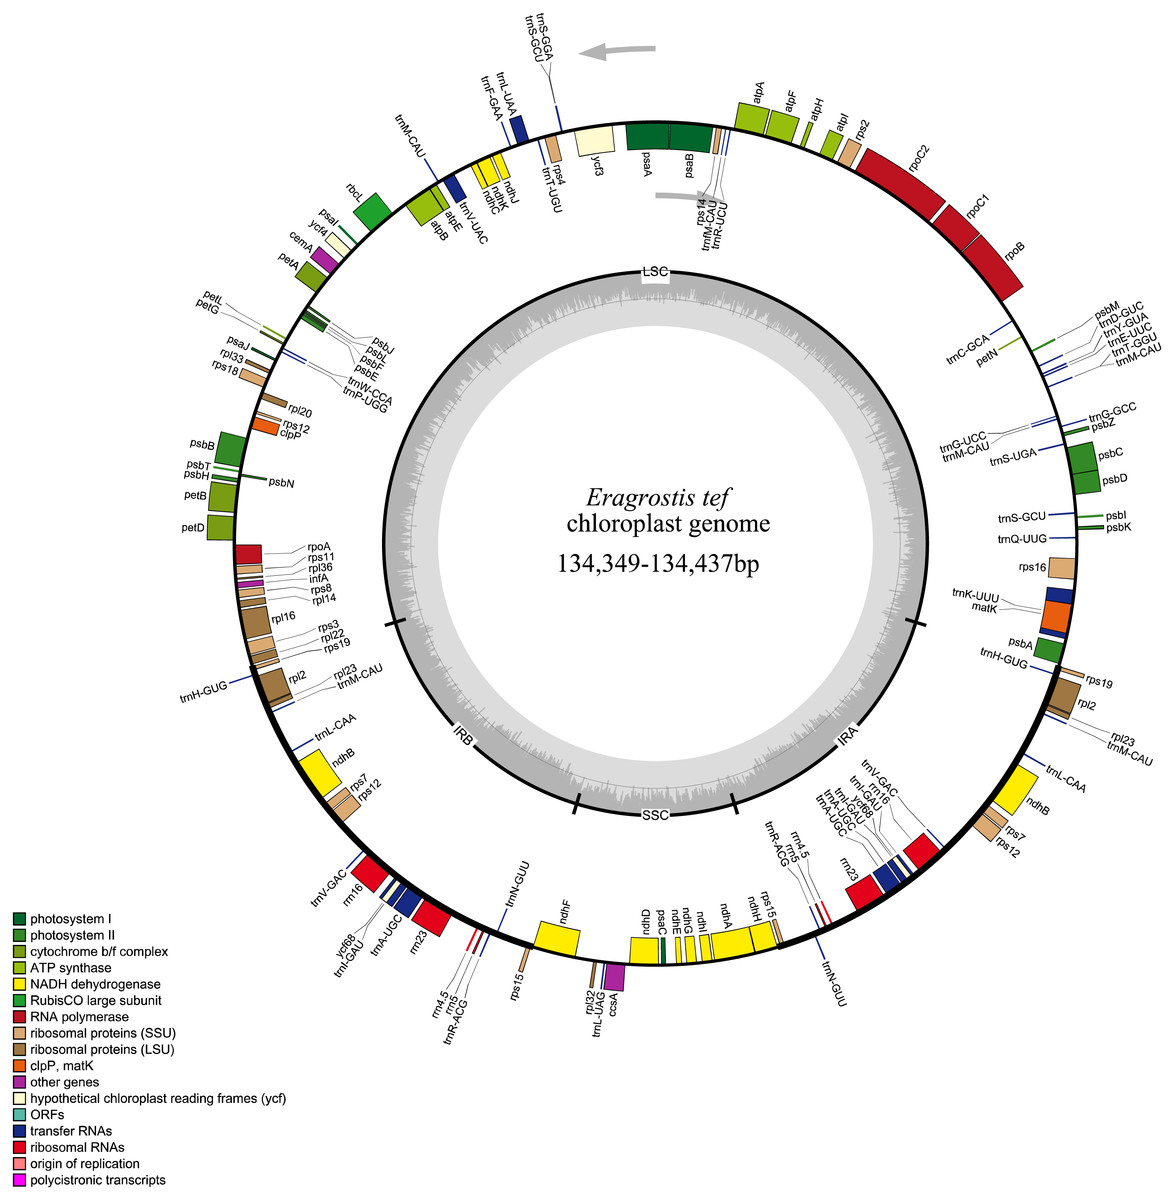
Figure 2: Whole plastome map of E. tef.
Genes shown on the outside of the large circle are transcribed clockwise, while genes shown on the inside are transcribed counterclockwise.The thick lines indicate the extent of the inverted repeats (IRa and IRb), which separate the genome into small and large single-copy regions.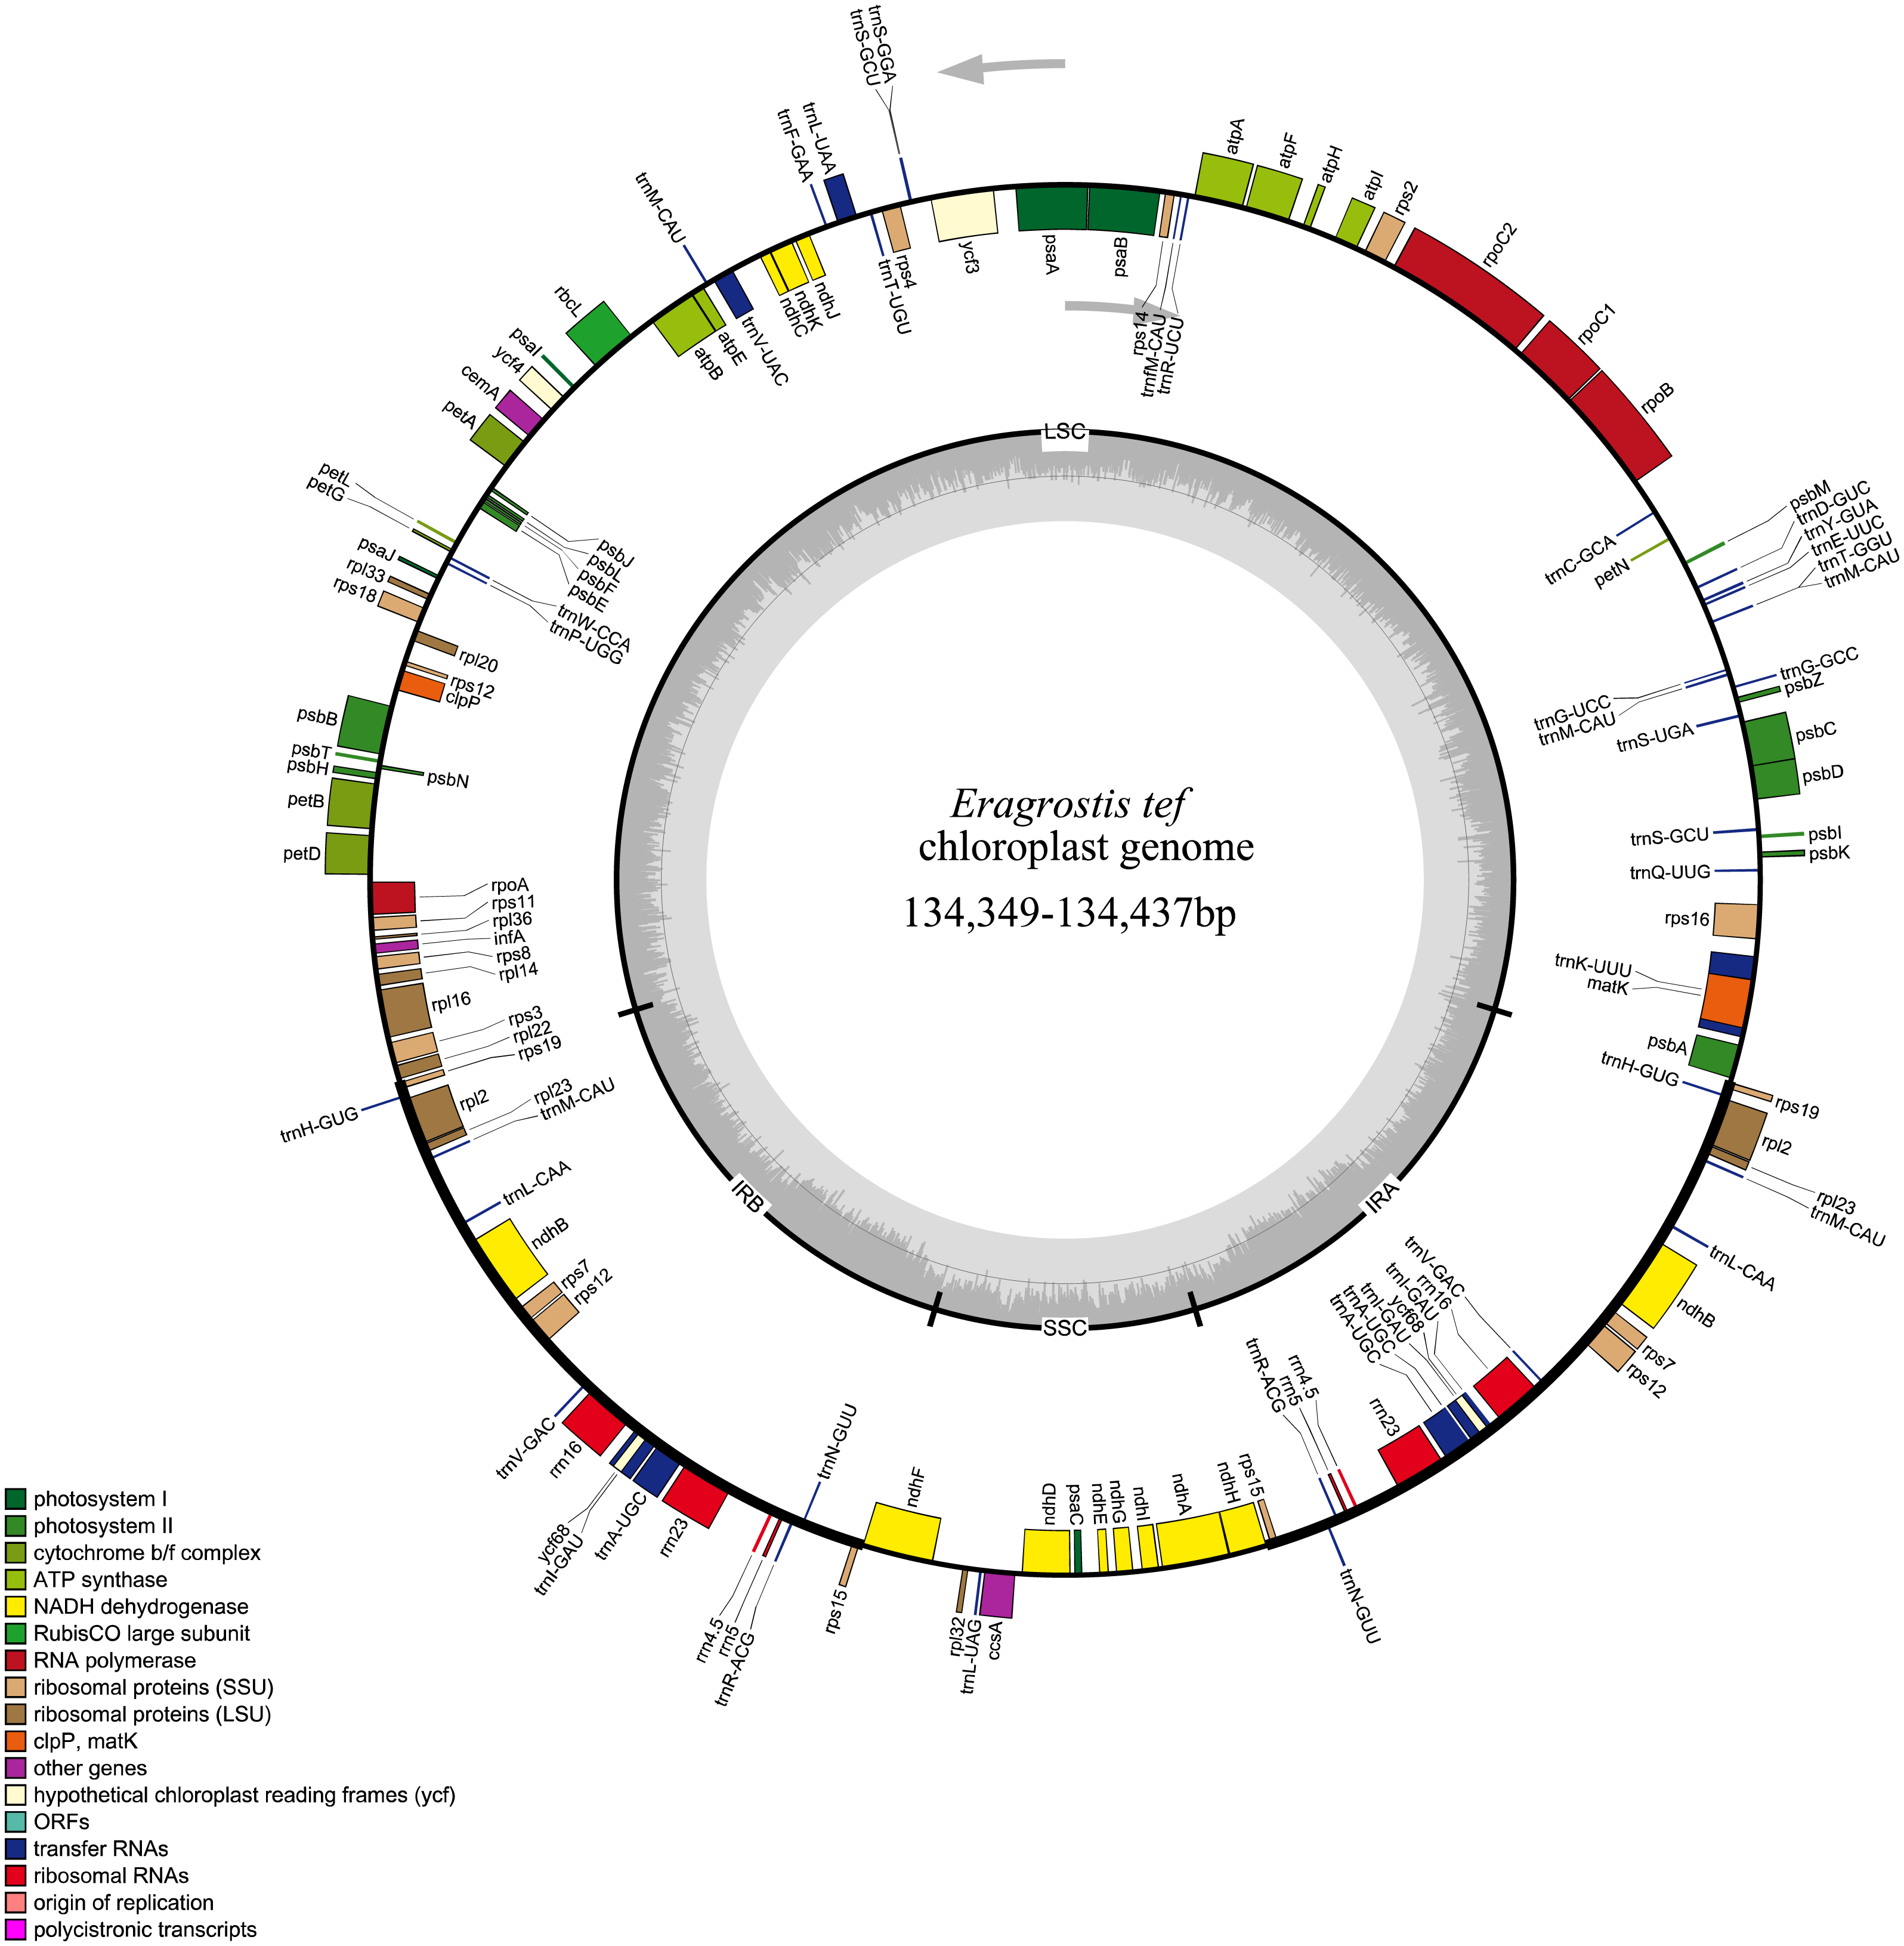
Simple sequence repeats
A total of 143 cpSSRs loci were identified in the plastome of E. tef accession (Table S2). The number of detected cpSSRs and their distributions are similar among compered accessions. These cpSSRs were mainly sited in the LSC region (78%), whereas 13% and 9% were localized in SSC and IR, respectively. The majority of cpSSRs were found in intergeneric space regions of the genome (73%) and the other 19% were located in the twelve PCGs (rpoB, rpoC1, atpF, rps14, ndhK, ycf4, petA, petL, psaJ, psbB, rpl16, ndhF, Table S2). The remaining 9% was located in the intron region. Among the cpSSR categories, mononucleotide cpSSRs are quite plentiful in the genome (94%), followed by dinucleotide cpSSRs (5%) and tetranucleotide cpSSRs (1%). No of tri-, penta- and hexa- repeat types were detected in the E. tef. The most common of a repeat mononucleotide was A/T (90%) motif. Thirteen cpSSRs sites are found polymorphic within E. tef accessions and all of them were situated in the LSC region of the genome (Table S3). Three plastomes were chosen from the subfamily Chloridoideae and their cpSSRs repeat number was compared with the E. tef. A total of 142, 141 and 118 cpSSRs were found in the M. abyssinica, E. minor and N. reynaudiana, respectively (Table S4). In addition to cpSSRs, large repeat sequences were analyzed using REPuter, and 44 repeats (Table S5), which include 28 forward (F), 15 palindromic (P) and one reverse (R) repeats, were found. There were no complement repeats in the E. tef. The repeat sequence that ranged between 30 to 40 bp were the most common (27 repeat loci). The majority (55%) of these repeats were located in the noncoding region of the plastome.
SNPs and InDels polymorphism among E. tef accessions
After masked cpSSR regions, the intraspecific comparison of 32 E. tef accessions revealed 21 (12 InDels and 9 SNPs) polymorphic sites (Table 2). Of these, 16 sites were situated in the LSC region, and the SSC region only includes three sites. The IR regions contained only one variable site in trnN-GUU-rps15, which is one base deletion. The majority (81%) of the variable sites were located in the noncoding regions. Four of 21 variable sites were detected in PCGs (Table 2). Most of the SNPs were identified in the noncoding regions of the plastomes. T/C base substitutions accounted for the highest percentage (23%) of all SNPs, followed by T/A (15%), G/C (15%), G/T (15%), A/G (7.7%), G/A (7.75%), and A/T (7.7%). Besides, mutational sites identified in the PCGs (atpE, psbB, ndhB and petB) were classified as synonymous mutations (Table 2).
| Location | Type | Region | Effect on protein | Synonymous (ks) value |
|---|---|---|---|---|
| rps16 intron | SNP | LSC | ||
| trnM-CAU-trnE-UUC (IGS) | SNP | LSC | ||
| atpE (PCG) | SNP | LSC | Synonymous | 0.010 |
| clpP-psbB (IGS) | SNP | LSC | ||
| psbB (PCG) | SNP | LSC | Synonymous | 0.002 |
| petB (PCG) | SNP | LSC | Synonymous | 0.006 |
| ndhB (PCG) | SNP | IR | Synonymous | 0.002 |
| rpl16 intron | SNP | LSC | ||
| psaC-ndhE (IGS) | SNP | IR | ||
| trnY-GAU-trnD-GUC (IGS) | InDeLs | LSC | ||
| psaA-ycf3 (IGS) | InDeLs | LSC | ||
| petA-psbJ (IGS) | InDeLs | LSC | ||
| trnT-UGU-trnS-UGA (IGS) | InDeLs | LSC | ||
| ndhC-trnV-UAC (IGS) | InDeLs | LSC | ||
| atpB-rbcL (IGS) | InDeLs | LSC | ||
| rpl33-rps18 (IGS) | InDeLs | LSC | ||
| petD-rpoA (IGS) | InDeLs | LSC | ||
| trnN-GUU-rps15 (IGS) | InDeLs | IR | ||
| ccsA-ndhD (IGS) | InDeLs | LSC | ||
| psaC-ndhE (IGS) | InDeLs | SSC | ||
| psaJ-rpl33 (IGS) | InDeLs | LSC |
Notes:
- PCG
-
Protein coding gene
- IGS
-
Intergenic spacer
The current study revealed that InDels were the abundant (12 InDels) type of polymorphism in the E. tef plastomes, and nearly all of them were found in the LSC region. Only one InDel was found in the SSC region (psaC-ndhE). The majority of InDels (81%) are single base pairs and all single base-pair InDels are A or T. Two InDels in the IGS regions (trnY-GAU-trnD-GUC and psaA-ycf3) gene were specific to the T16 accession. Thirty-four pairs of primer sequences (12 InDels, 9 SNPs, 13 cpSSRs) were developed based on the detected polymorphic sites in plastomes (Tables S3, S6).
Phylogenetic analysis
The phylogenetic relationship of 32 E. tef accessions was established using the complete plastome sequences and variable loci identified in the present study (Tables S3, S6). Both ML and BI gave identical tree topologies and clusters (Fig. 3). In the phylogenetic analysis, all E. tef accessions were divided into two clusters: one formed from accessions of south Ethiopia (Fig. 3) and others included the accessions from central and northern regions. Similarly, the phylogenetic tree inferred from twenty variable sites did show unambiguous biogeographic patterns in the accessions from the south (T3, T15, T24, T43, and T51) (Fig. 3). However, the phylogenetic relationships derived from both datasets did not provide clear biogeographic patterns.
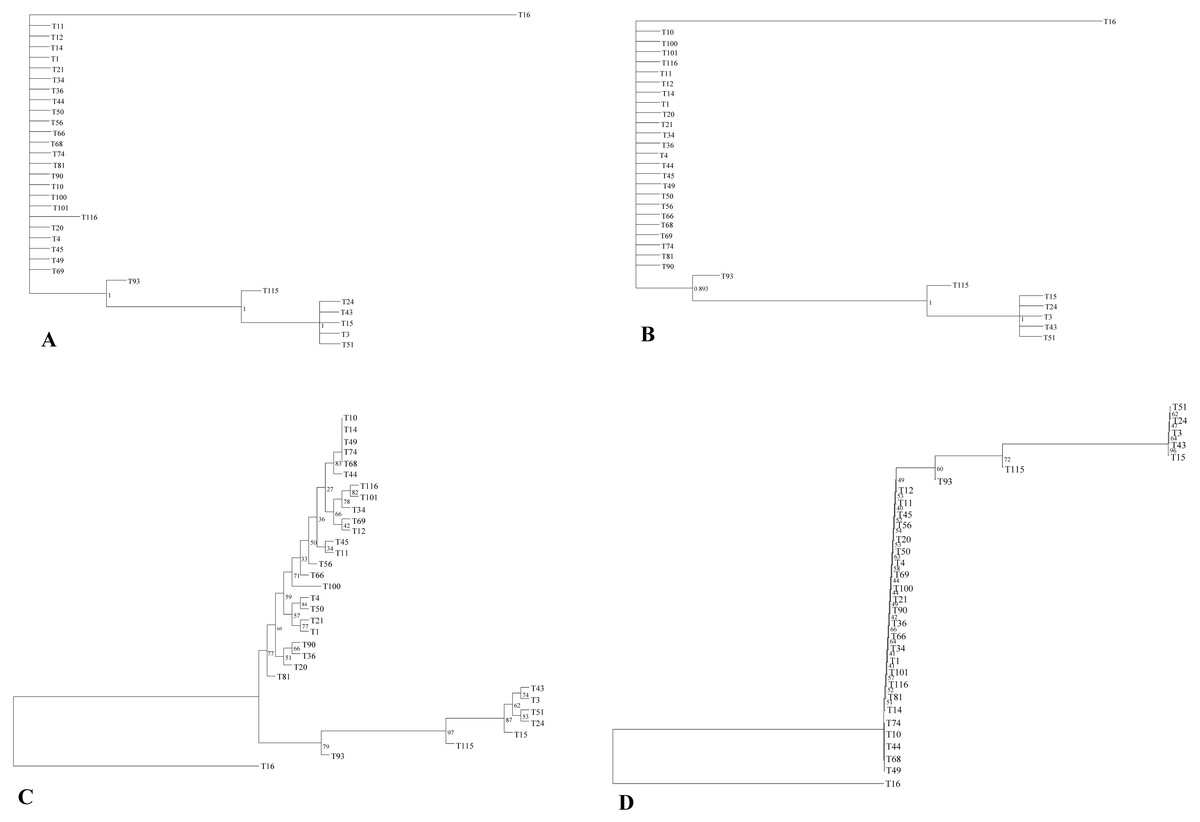
Figure 3: Phylogenetic relationships among E. tef accessions inferred from Bayesian (BI) (A, B) and maximum likelihood (ML) methods (C, D) using complete plastome sequences and twenty variable loci, respectively.
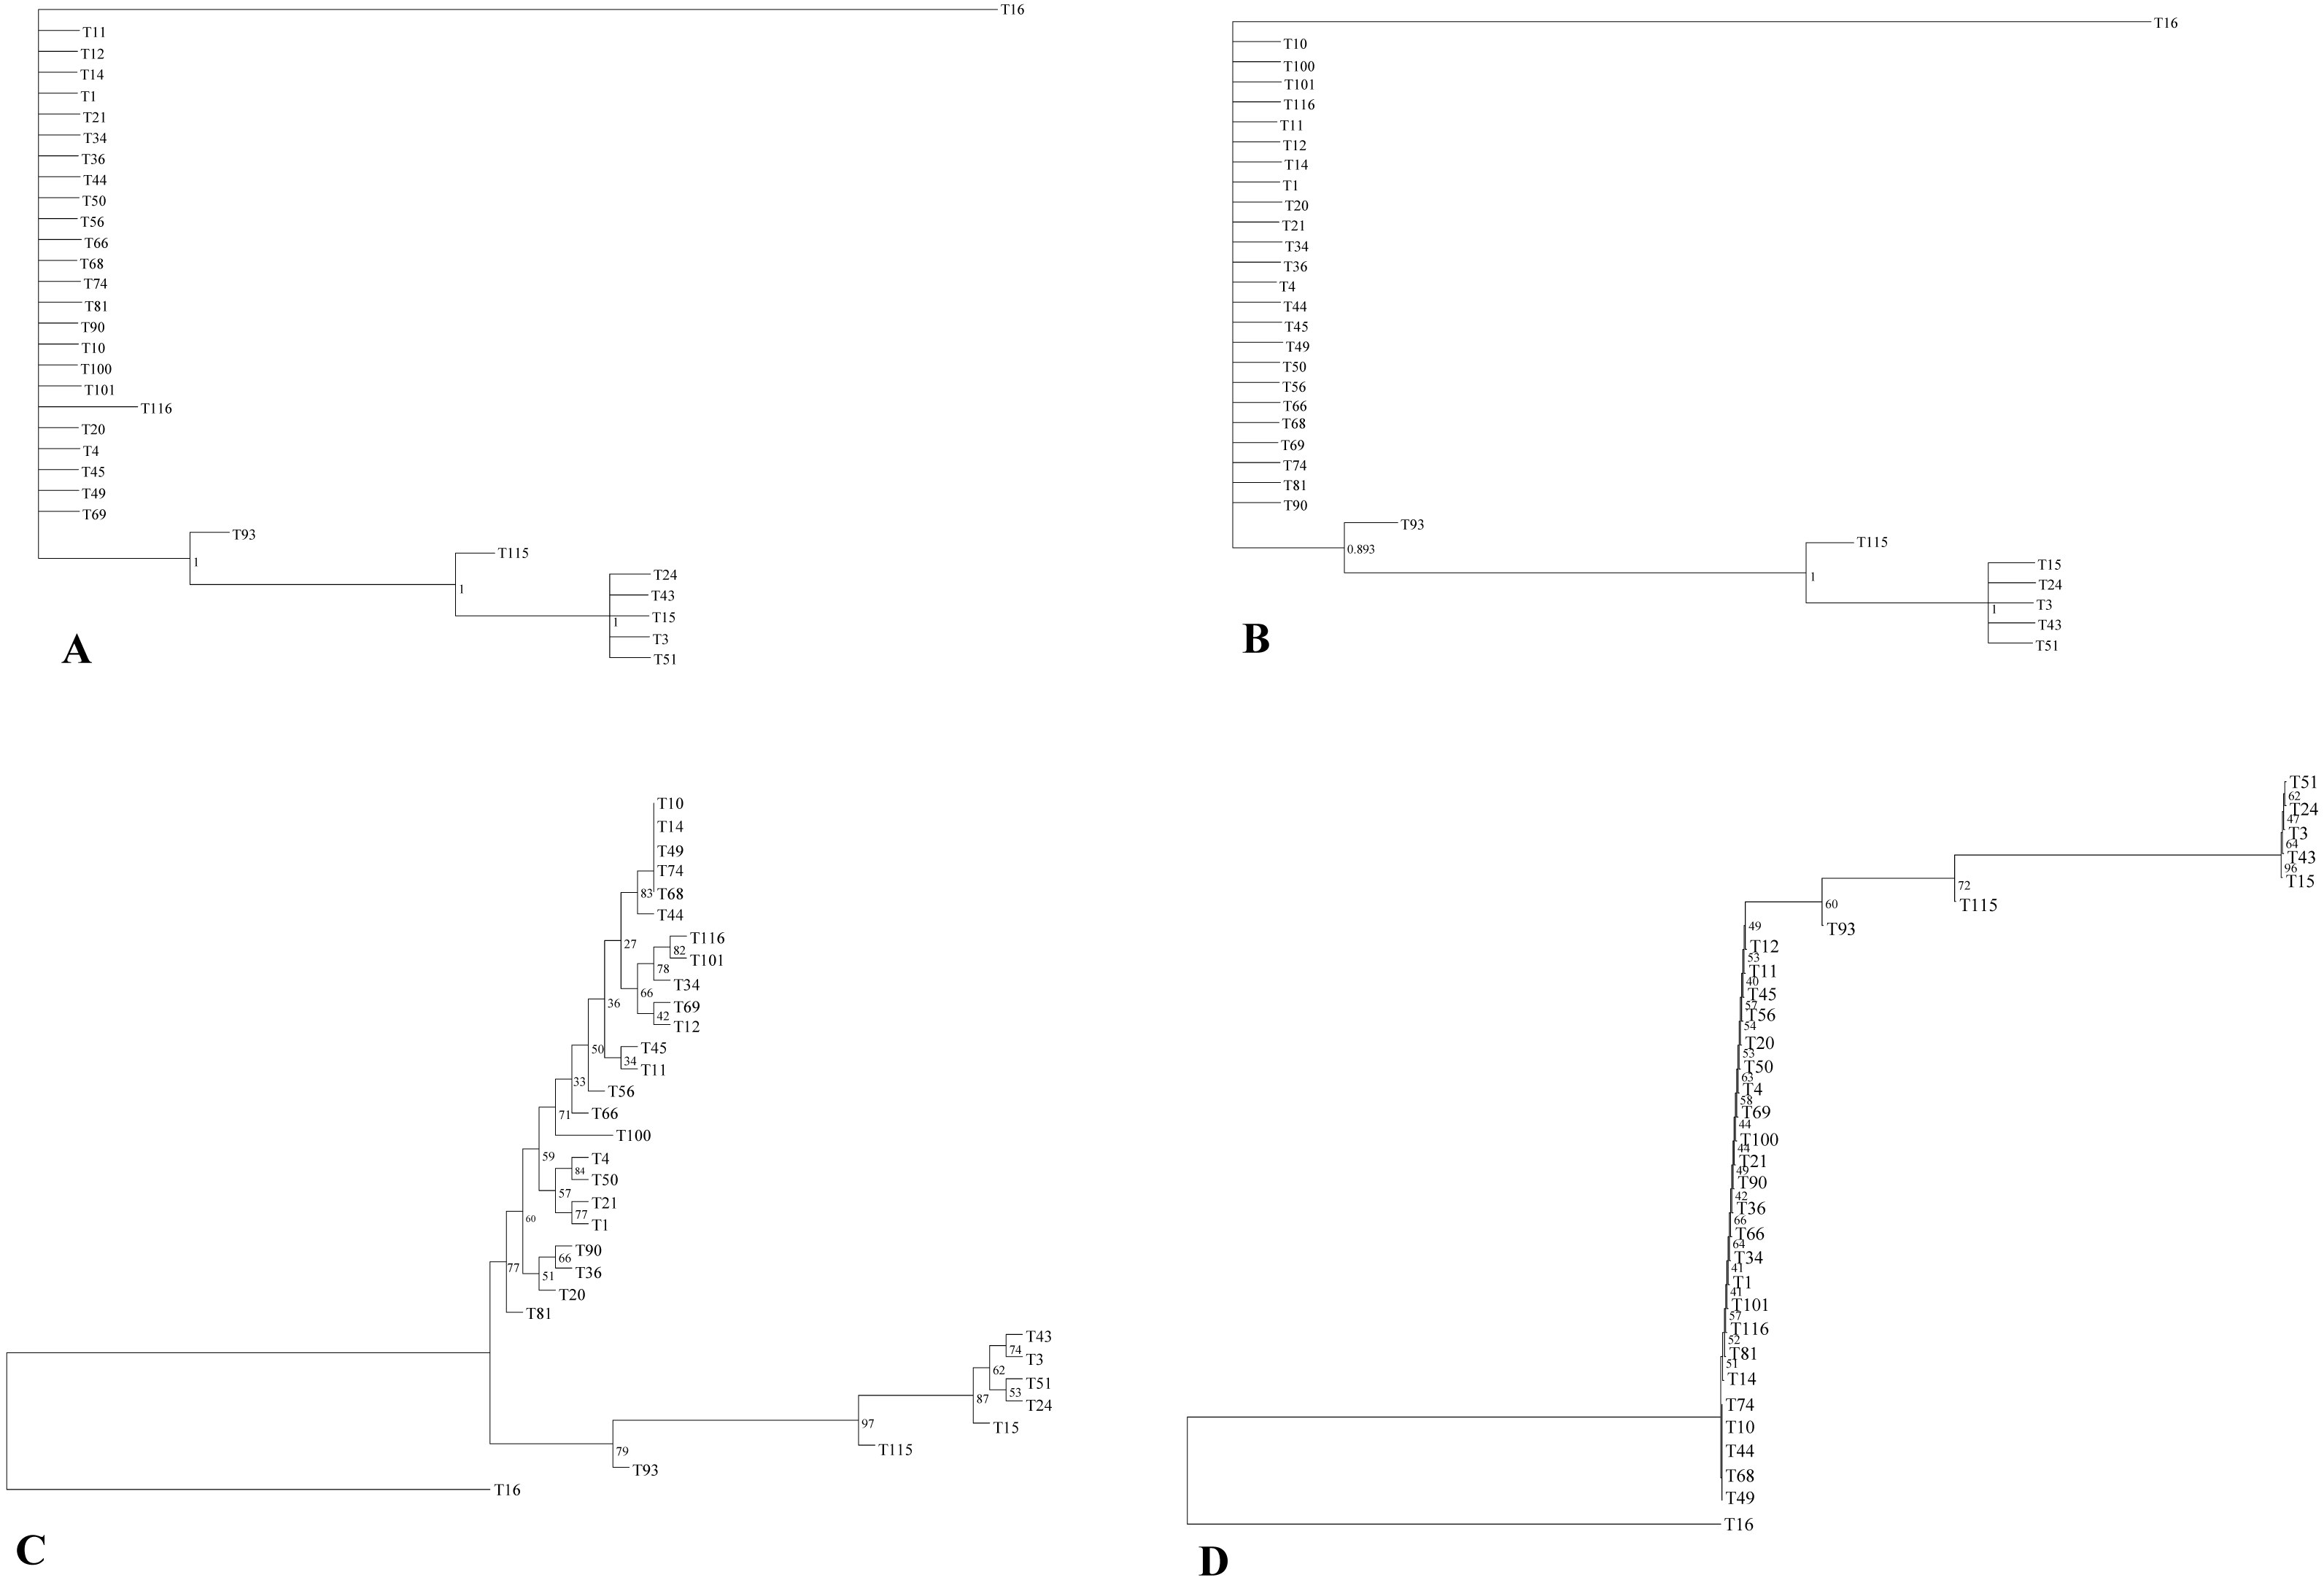
Selection analyses
We examined the pattern of nonsynonymous to synonymous substitution ratio (ka/ks) among four mutational PCGs (atpE, psbB, ndhB and petB) of E. tef accessions. The highest average ks pairwise value was found in atpE (0.010) (Table 2). The ka/ks ratio for PCGs showed zero values for all analyzed accessions.
Discussion
Plastome variations in E. tef
In this study, we conducted whole plastome comparison and determined the site of mutational changes in E. tef. The intra-specific comparison among 32 E. tef accessions revealed similar genome structure and no IR region expansion or contraction has occurred within the accessions. The result suggests that the E. tef plastome sequence is highly conserved (Figs. S1; S2). This finding was similar to other studies showing low intraspecific genetic variation (Jiang, Hinsinger & Strijk, 2016; Jeon & Kim, 2019). Although the plastomes composition and structures of 32 E. tef accessions are highly conserved, we also identified several mutational regions containing variable loci, which could provide potential information for the development of molecular marker and evolutionary studies. In our study, 143 cpSSRs identified in the E. tef, including thirteen polymorphic cpSSRs. The distributions of cpSSRs are non-random and a similar number of repeats among E. tef accessions. The number of cpSSRs detected in the E. tef was also relatively similar to other species in the subfamily Chloridoideae including E. minor, M. abyssinica and N. reynaudiana. A comparison of cpSSRs revealed a relative conservatism in repeat numbers and consistent with other reports (Wheeler et al., 2014; Jiang, Hinsinger & Strijk, 2016). Most of the cpSSR in E. tef is distributed in the noncoding region of the genome, which is consistent with other studies (Li et al., 2018; Abdullah et al., 2019). Chloroplast derived microsatellite markers were developed and utilized in various studies such as assessment of the maternal line of hybrid wheat (Tomar et al., 2014), genetic diversity and relationships analysis among potato accessions (Lee et al., 2019) and species differentiation (Decesare, Hodkinson & Barth, 2010). Our study provides cpSSRs data that could provide valuable molecular tools for the evolutionary studies of E. tef.
Although plastomes are highly conserved, there are hotspots region with SNPs and indels mutations, commonly used as DNA barcoding (Kress et al., 2005; Fan et al., 2018). These variations are uniparentally inherited and thus analytically attractive to trace the evolutionary history of maternal lines in the crop breeding program (Keeling, 2010; Tomar et al., 2014). In the present study, intraspecific chloroplast polymorphic sites were detected within the E. tef accessions. The 21 variable sites (12 InDels and 9 SNPs) identified in the present study include: rps16 intron, trnM-CAU-trnE-UUC, atpE, petA-psbJ, clpP-psbB, psbB, ndhB, petB, psaC-ndhE, rpl16 intron, ccsA-ndhD, psaA-ycf3, trnT-UGU-trnS-UGA, ndhC-trnV-UAC, atpB-rbcL, psaJ-rpl33, rpl33-rps18, petD-rpoA, trnY-GAU-trnD-GUC, trnN-GUU-rps15. The identified variable sites have provided valuable insight into the intraspecific genetic diversity in E. tef and could provide a valuable genomic resource for plastid marker development. The noncoding regions of plastomes have higher sequence variation than PCGs (Choi, Chung & Park, 2016; Skuza et al., 2019) and are widely used in population genetics and phylogenetic studies. This because in the genome, the PCGs is highly conserved than the noncoding regions (Cao et al., 2018; Wu et al., 2018). Similarly, in the current study, 81% of the identified SNPs and InDels markers were sited in the noncoding region of the plastid genomes. In general, nucleotide substitutions less frequently occur in PCGs than noncoding regions of plastomes (Kim et al., 2015; Daniell et al., 2016).
The nonsynonymous (ka) and synonymous (ks) substitution ratio (ka/ks) are widely used as an estimator for adaptive evolution on PCGs (Erixon & Oxelman, 2008; Gao et al., 2018). The fact that the positive selection in PCGs of plastomes viewed as an important driving force of adaptive evolution (Johnson & Melis, 2004; Zhong et al., 2009; Hu et al., 2015). We analyzed ka/ks ratio of four mutational PCGs of E. tef accessions, which indicated that all four mutational PCGs were under purifying selection (ka/ks < 1).
Phylogenetic analysis
In previous studies, plastid markers have been used to determine the E. tef phylogenetic relationship (Espelund et al., 2000; Ingram, 2010). However, complete plastome and multi loci markers provide more detailed insight (Krawczyk et al., 2018; Wu et al., 2018). In this study, two datasets (complete plastome and twenty variable loci) were applied to determine whether the phylogenetic relationships of E. tef accessions reflected the biogeographic pattern. The phylogenetic tree has divided the accessions into two clusters with identical tree topologies. We found that phylogeny inferred from both datasets and analysis methods (BI and ML) have been able to delineate accessions from south Ethiopia (T3, T15, T24, T43, T51) with robust support (Fig. 3). Furthermore, patterns of mutations among accessions are consistent with all tree topologies. For example, several unique mutational sites were identified in accession from Eritrea (T16), which might be a reason for the relatively long branch length (Fig. 3). Overall, both datasets were able to provide the phylogenetic relationship with a more informative biogeographical pattern among the accessions from the south (Fig. 3) and also identify accession (T16) from Eritrea (Fig. 3). This indicated that the identified variable sites could be useful molecular markers in phylogenetic and biogeography studies. Phylogenetic relationships among Eragrostis have been investigated based on a small number of plastid loci (rps16, trnL-UAA, trnL-trnF) (Espelund et al., 2000; Ingram, 2010), but these have failed to provide intra-specific variations and sufficient phylogenetic signal of E. tef.
Despite the existence of clusters with a clear biogeographical pattern, the phylogenetic analysis did not reveal a robust biogeographical structure. For example, accessions from the western and central parts of the country are not clustered with their respective geographic origin. Similar analyses conducted in the previous study using the nuclear genome also did not show unambiguous geographic distribution patterns (Fikre, Tesfaye & Assefa, 2019). The lack of clear spatial structure may be attributed to gene flow between adjacent populations and seed exchange among farmers (Assefa, Merker & Tefera, 2004). We also infer that the limited geographical representation of our studied accessions might be the reason to contribute the insufficient geographical information.
Conclusions
In this study, a comparison of 32 complete plastomes of E. tef accessions was performed and revealed a low level of sequence variability. Only 34 polymorphic sites (13 cpSSRs, 12 InDels and 9 SNPs) were identified in the plastome of these accessions. The noncoding regions of the genome exhibited higher variable sites than PCGs. The newly sequenced E. tef plastomes also provide an additional genomic resource for undertaking various studies in an economical crop.
Additionally, the phylogenetic tree provides an informative insight into the genetic relationship of sampled accessions with their biogeographic distribution. In the future, we would suggest expanded sampling of E. tef and its wild relatives need to be used for assessing the biogeography of this economically important crop. Genome-wide association study is also imperative to identify the genetic basis of agriculturally important traits in E. tef. Overall, in our study, the complete plastomes and detected variable sites could be a useful genomic resource for molecular breeding, identification, population genetics, and biogeography studies of E. tef and related crop species in the Chloridoideae.
Supplemental Information
Comparisons of the LSC, SSC, IR region boundaries within 32 E. tef accessions
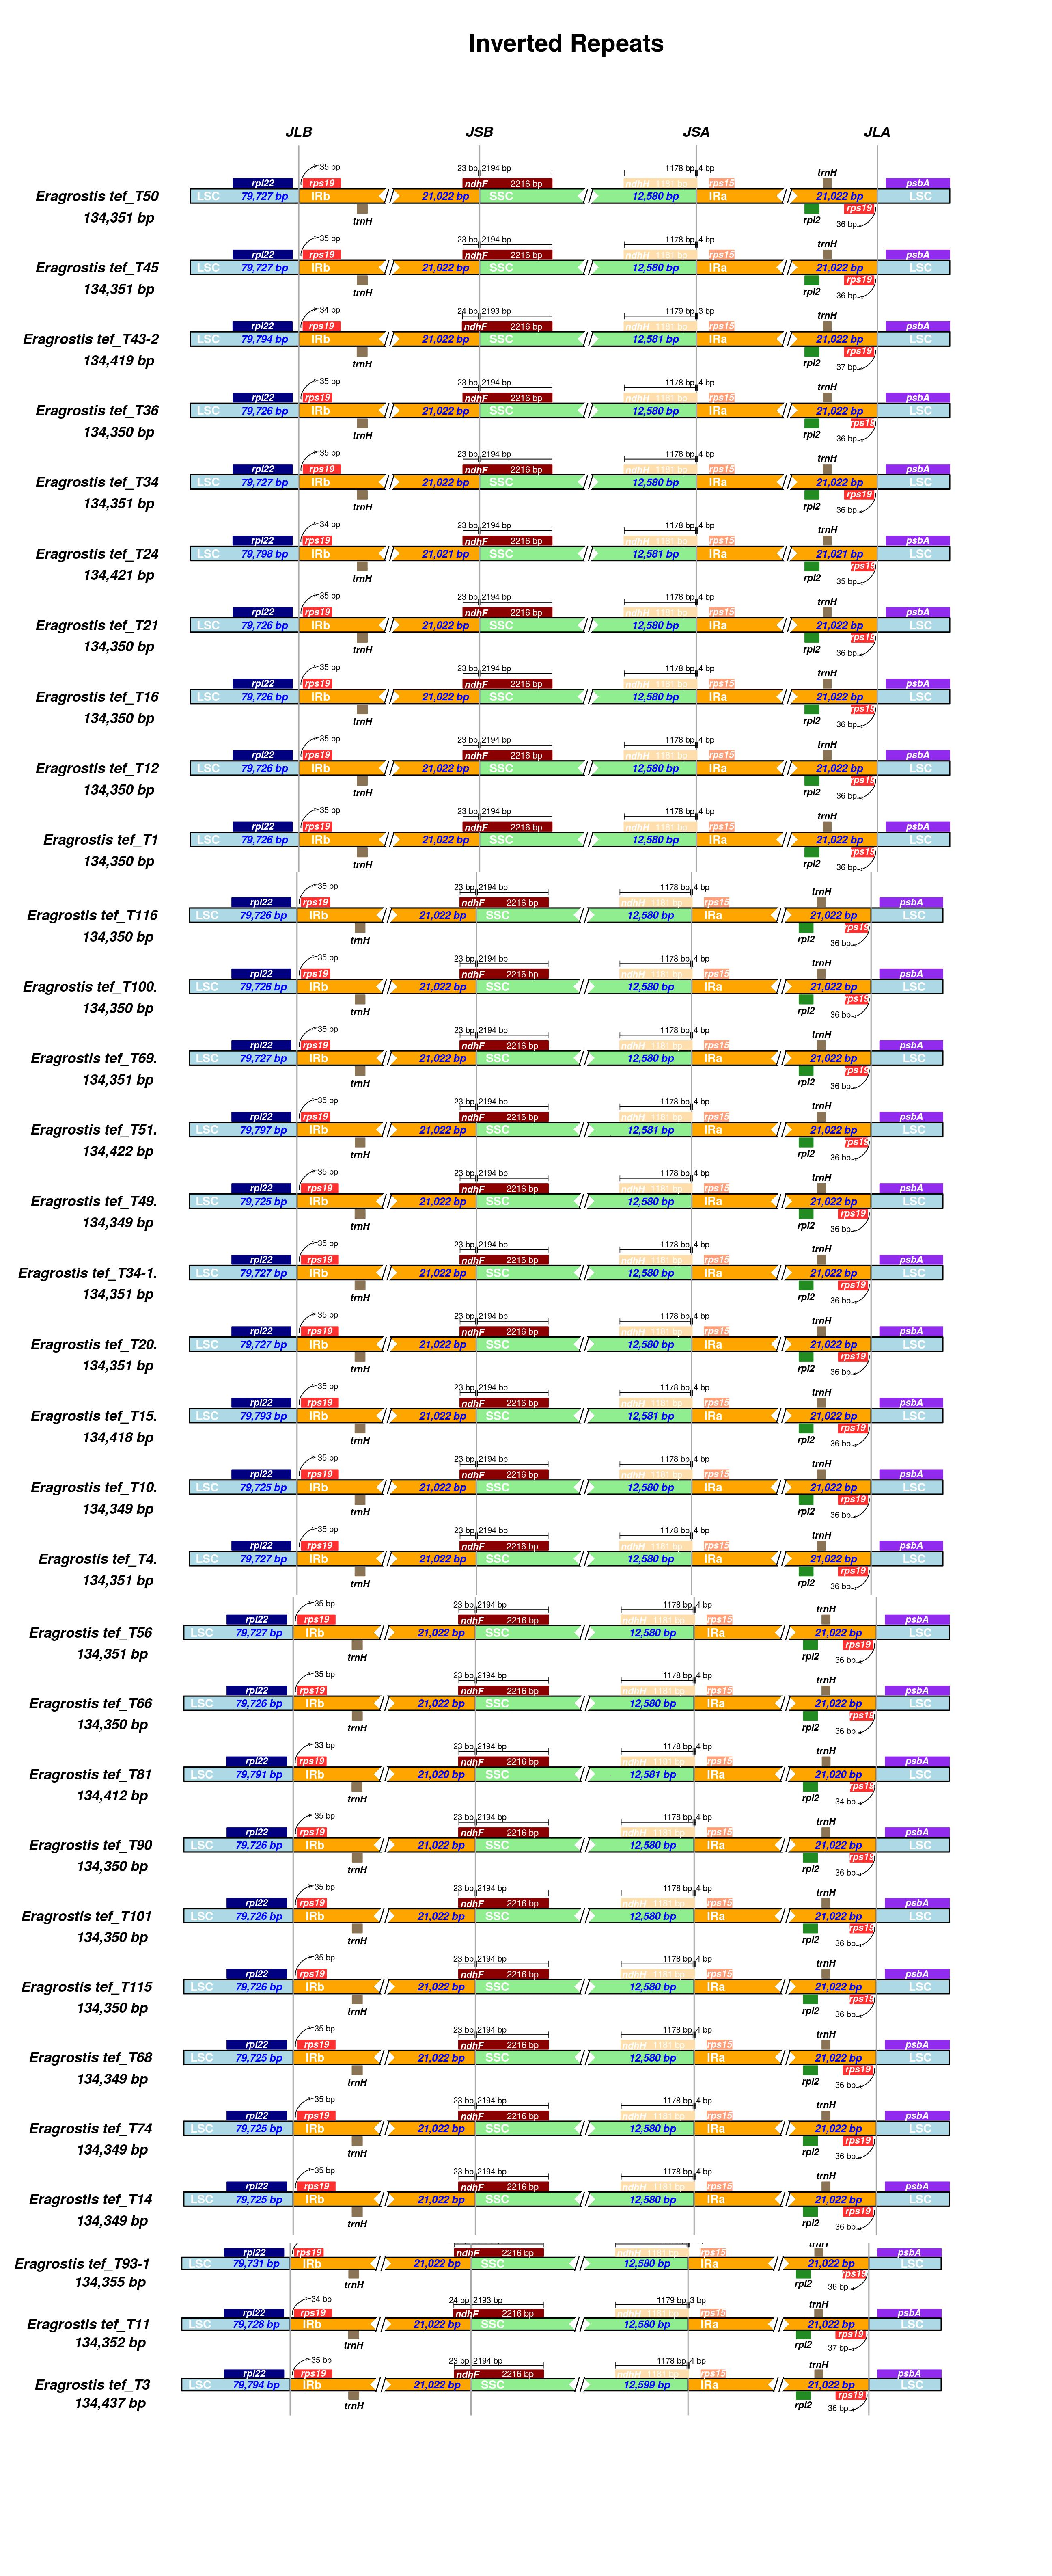
Sequence identity plots based on 32 E. tef plastomes
The vertical scale indicates the percentage of identity ranging from 50 to 100. Gene transcription direction was indicated by gray arrows.
List of cpSSRs markers with primer sequence and genome position in the E. tef.
CpSSR types and amount in the E. tef, E. minor, N. reynaudiana and M. abyssinica plastomes
The distribution of long repeat sequences identified in E. tef plastomes by REPuter software
Primer pairs designed for the identified SNPs and InDels in the plastomes of E. tef
The distribution of long repeat sequence identified in E. tef plastomes by REPuter.