
Identification of gene expression and DNA methylation of SERPINA5 and TIMP1 as novel prognostic markers in lower-grade gliomas
- Published
- Accepted
- Received
- Academic Editor
- Jafri Abdullah
- Subject Areas
- Genomics, Neurology, Oncology, Translational Medicine
- Keywords
- Lower-grade glioma, SERPINA5, TIMP1, DNA methylation, Bioinformatics analysis, Prognostic markers
- Copyright
- © 2020 Zeng et al.
- Licence
- This is an open access article distributed under the terms of the Creative Commons Attribution License, which permits unrestricted use, distribution, reproduction and adaptation in any medium and for any purpose provided that it is properly attributed. For attribution, the original author(s), title, publication source (PeerJ) and either DOI or URL of the article must be cited.
- Cite this article
- 2020. Identification of gene expression and DNA methylation of SERPINA5 and TIMP1 as novel prognostic markers in lower-grade gliomas. PeerJ 8:e9262 https://doi.org/10.7717/peerj.9262
Abstract
Background
Lower-grade gliomas (LGGs) is characteristic with great difference in prognosis. Due to limited prognostic biomarkers, it is urgent to identify more molecular markers to provide a more objective and accurate tumor classification system for LGGs.
Methods
In the current study, we performed an integrated analysis of gene expression data and genome-wide methylation data to determine novel prognostic genes and methylation sites in LGGs.
Results
To determine genes that differentially expressed between 44 short-term survivors (<2 years) and 48 long-term survivors (≥2 years), we searched LGGs TCGA RNA-seq dataset and identified 106 differentially expressed genes. SERPINA5 and TIMP1 were selected for further study. Kaplan–Meier plots showed that SERPINA5 and TIMP1 expression were significantly correlated with overall survival (OS) and relapse-free survival (RFS) in TCGA LGGs patients. We next validated the correlation between the candidate genes expression and clinical outcome in CGGA LGGs patients. Multivariate analysis showed that TIMP1 mRNA expression had a significant prognostic value independent of other variables (HR = 4.825, 95% CI = 1.370–17.000, P = 0.014). Then, differential methylation sites were identified from differentially candidate gene expression groups, and all four methylation sites were significantly negatively correlated with gene expression (spearman r < − 0.5, P < 0.0001). Moreover, hyper-methylation of four methylation sites indicated better OS (P < 0.05), and three of them also shown statistical significantly association with better RFS, except for SERPINA5 cg15509705 (P = 0.0762).
Conclusion
Taken together, these findings indicated that the gene expression and methylation of SERPINA5 and TIMP1 may serve as prognostic predictors in LGGs and may help to precise the current histology-based tumors classification system and to provide better stratification for future clinical trials.
Introduction
Gliomas are the most common primary malignancies of the central nervous system that include astrocytoma, ependymoma, oligodendroglioma, and mixed oligoastrocytomas, and ranged in grade II to IV as defined by the World Health Organization (WHO). Because of its histopathological heterogeneity, the clinical outcome of glioma patients varies widely (Louis et al., 2007; Louis et al., 2016). Lower-grade gliomas (LGGs), comprising WHO grades II and III astrocytoma, oligodendroglioma and mixed oligoastrocytoma, exhibit infiltrative and highly invasive nature and intrinsic tendency to recur or progress into WHO grade IV gliomas (Brat et al., 2015). Despite recent advances in neurosurgery, radiotherapy and chemotherapy, LGGs patients have a wide range of survival, ranging from 1 to 15 years (Brat et al., 2015; Ceccarelli et al., 2016; Ricard et al., 2012). Currently, biomarkers used to treat and predict the prognosis of LGGs are limited (Brennan et al., 2013; Louis et al., 2014), so it is urgent to identify more molecular markers to provide a more objective and precise tumor classification system for LGGs.
The genetic and epigenetic landscapes of LGGs have been extensively studied (Brat et al., 2015; Chan, Mao & Ng, 2016; Suzuki et al., 2015). Transcriptomic data, one of the most commonly available high-throughput molecular data, plays a critical role in identifying novel tumor genetic biomarker and discovering new drug targets. Verhaak et al. (2010) analyzed gene expression data of glioblastoma (GBM) and classified GBM into Proneural, Neural, Classical, and Mesenchymal subtypes. Weller et al. (2015) analyzed transcriptome-wide data of primary tumor samples identified eight transcriptionally different groups (five isocitrate dehydrogenase (IDH)1/2 mutant, three IDH1/2 wild type). Recently, studies have revealed that IDH mutations disrupt histone demethylation and suggest a better survival rate (Lu et al., 2012). In particular, IDH mutation and 1p/19q deletion are used as biomarkers to classify gliomas in the 2016 WHO classification of central nervous system tumors (Louis et al., 2016). However, current molecular classification does not guarantee accurate diagnosis and individualized medication for LGG patients.
DNA methylation, an epigenetic modification via methylation of cytosin carbon 5, is an important epigenetic modification related to the pathogenesis of gliomas (Ellis, Atadja & Johnstone, 2009; Herman et al., 1996; Noushmehr et al., 2010). Previous evidences demonstrated that the increased methylation of DNA in 5’ upstream regulatory sites negatively correlate with gene expression of some tumor-suppression genes (Merlo et al., 1995). It is widely recognized that the activity of DNA-repair enzyme O (sup 6)- methylguanine-DNA methyltransferase (MGMT) is controlled by its promoter methylation status, which can effectively predict the responsiveness of the gliomas to alkylating agents (Esteller et al., 2000; Hegi et al., 2005). These evidences suggested that alteration of DNA methylation can be exploited for functional characterizations and diagnosis of gliomas. However, there is still no clear understanding of the epigenetic alterations in LGGs, and of the potential role of DNA methylation markers as prognostic biomarkers.
In the present study, we performed an integrated analysis of gene expression data and DNA methylation data from The Cancer Genome Atlas (TCGA) and Chinese Glioma Genome Atlas (CGGA) databases to determine novel prognostic genes and methylation sites in LGGs. We found that the gene expression and methylation of SERPINA5 and TIMP1 can function as prognostic predictors in LGGs, which might help to precise the current histology-based tumors classification system and to provide better stratification for future clinical trials.
Materials and Methods
Lower-grade glioma datasets
TCGA LGG dataset was downloaded from the University of California Santa Cruz cancer browser https://genome-cancer.ucsc.edu/ (version: 2015-02-24) as training dataset. In total, 473 samples (225 grade II, 248 grade III gliomas) having clinical data were profiled for class discovery and survival analysis. A total of 131 samples (97 grade II, 34 grade III gliomas) from CGGA repository (http://cgga.org.cn/) was included in our analysis as validation dataset, and all samples’ clinical data were downloaded for survival analysis. Overall survival (OS) was defined as the time interval from resection until the date of death. Relapse-free survival (RFS) is the period from resection to the radiological evidence of first tumor recurrence.
Gene expression data analysis
Gene expression data of TCGA LGG are from the Illumina HiSeq 2000 RNA Sequencing platform, and all counts data is then log2(count+1) transformed. The differential gene expression analysis and the adjusting for multiple testing was performed with edgeR package (Robinson, McCarthy & Smyth, 2010). The CGGA microarray dataset was generated by Agilent Whole Human Genome Array, and probe intensities were normalized using GeneSpring GX 11.0 (Yan et al., 2012). In the TCGA LGG dataset, 299 patients were classified as short-term survivors (<2 years) and the remaining 174 patients as long-term survivors (≥2 years). In order to exclude the influence of loss of follow-up or short follow-up time, we excluded the samples that did not reach the end time, and only samples that had died and had a clear survival time were included for screening of differential expressed genes (DEGs). Thus, a total of 44 short-term survivors (<2 years) and 48 long-term survivors (≥2 years) were included in the gene differential expression analysis. Genes were considered to have significant difference in expression if —log fold change (FC)— ≥ 1.0 and adjusted P < 0.05. The prognostic value of DEGs generated from TCGA lower-grade glioma dataset were then validated using Kaplan–Meier survival analysis with the CGGA LGG microarray dataset.
DNA methylation analysis
DNA methylation data of TCGA LGG are generated by the Illumina Infinium HumanMethylation450 platform. Mapping between probes on the RNA-seq and DNA methylation probes on the methylation array was performed. The β value was used to estimate the methylation level of probes. Probes with β ≥0.5 was considered as hyper-methylated sites, and β <0.5 was considered as hypo-methylated sites. The correlation between gene expression levels and DNA methylation levels were assessed using Spearman’s correlation analysis. —Spearman r— ≥0.6 was indicated a strong correlation and P < 0.05 was considered as statistically significant (Zeng et al., 2018).
To investigate the correlation between gene expression and DNA methylation, we performed a parallel DNA methylation analysis of the candidate genes. Mapping SERPINA5 and TIMP1 to DNA methylation probes identified 23 and 14 methylation sites, respectively. To obtain differentially methylated sites, patients were divided into two groups according to the median of gene expression. Of the 37 methylation sites, 4 differential methylation sites (SERPINA5 cg15509705; TIMP1 cg27151711; TIMP1 cg16523424; TIMP1 cg04791822) were identified (Table S2).
Functional enrichment analysis
The Database for Annotation, Visualization and Integrated Discovery (DAVID) was used to identify the potential biological functions of co-differentially expressed genes (co-DEGs) in LGGs (https://david.ncifcrf.gov/home.jsp) (Huang da, Sherman & Lempicki, 2009; Yan et al., 2019). Gene ontology (GO) analysis, including biological processes (BP), molecular function (MF), and cellular composition (CC), was performed to annotate these genes and determine functional enrichment. P <0.05 was considered as statistically significant for pathway enrichment. Then, the protein and protein interaction network of SERPINA5 and TIMP1 were constructed with GENEMANIA online database (https://genemania.org/) (Warde-Farley et al., 2010; Zhang et al., 2017).
Statistical analysis
Statistical analyses were performed with SPSS 13.0 (SPSS Inc., Chicago, IL, USA) and GraphPad Prism 5.0 (Graphpad Inc., San Diego, CA, USA). Nonparametric test was performed to identify genes that were differentially expressed between two groups. Spearman’s correlation analysis was used to determine the correlation between gene expression levels and DNA methylation status. Kaplan–Meier survival analysis was carried out to assess the survival distribution and the log-rank test was performed to determine the significance of the differences between two groups (Wang et al., 2019). For multivariable analysis, a Cox proportional hazards model was constructed for OS with a limited backward-LR procedure and was adjusted by potential confounding covariates. Hazard ratio (HRs) and 95% confidence intervals (CIs) were used to describe the risk. P <0.05 was considered as statistically significant.
Results
Identification of prognostic DEGs in LGGs (Fig. 1)
We first sought to identify DEGs between 44 short-term survivors (<2 years) and 48 long-term survivors (≥2 years) in the LGGs of TCGA microarray dataset. In total, 106 genes (78 upregulated genes and 28 down-regulated genes) were identified to be differentially expressed (Fig. 1A, Table 1). The results of two-dimensional hierarchical cluster indicated that the mRNA expression profiles of short-term survivors and long-term survivors distributed in separate clusters (Fig. 1B).
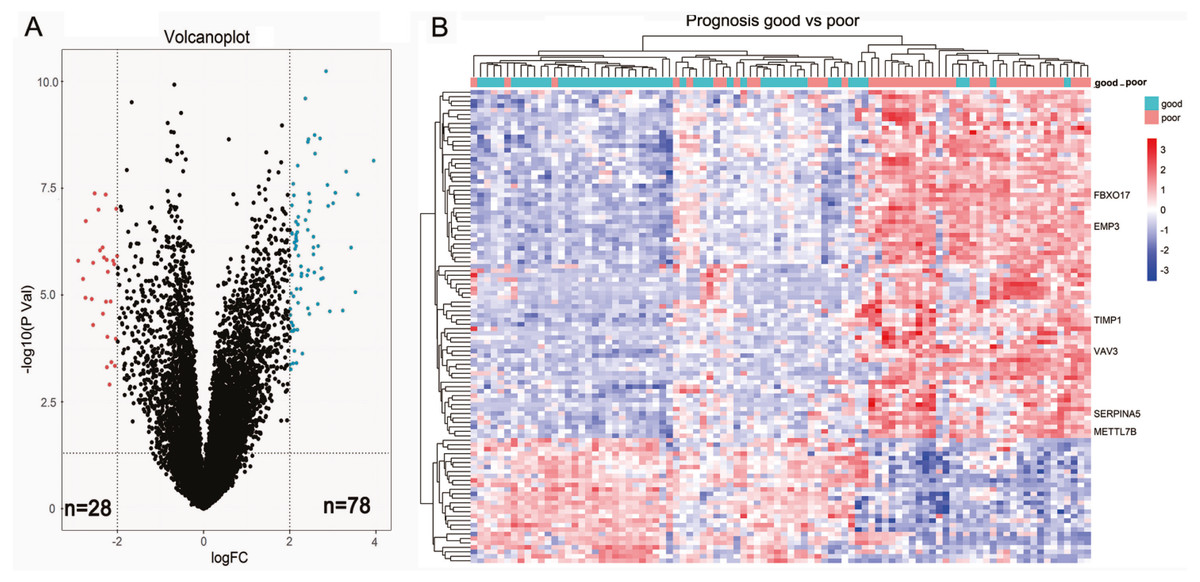
Figure 1: Identification of differential expressed genes between short-term survivors (<2 years) and long-term survivors (≥2 years) in the lower-grade gliomas in the TCGA microarray dataset.
(A) Volcano plot of the differential genes expression analysis. (B) Hierarchical cluster analysis of the mRNA expression profiles of short-term survivors and long-term survivors.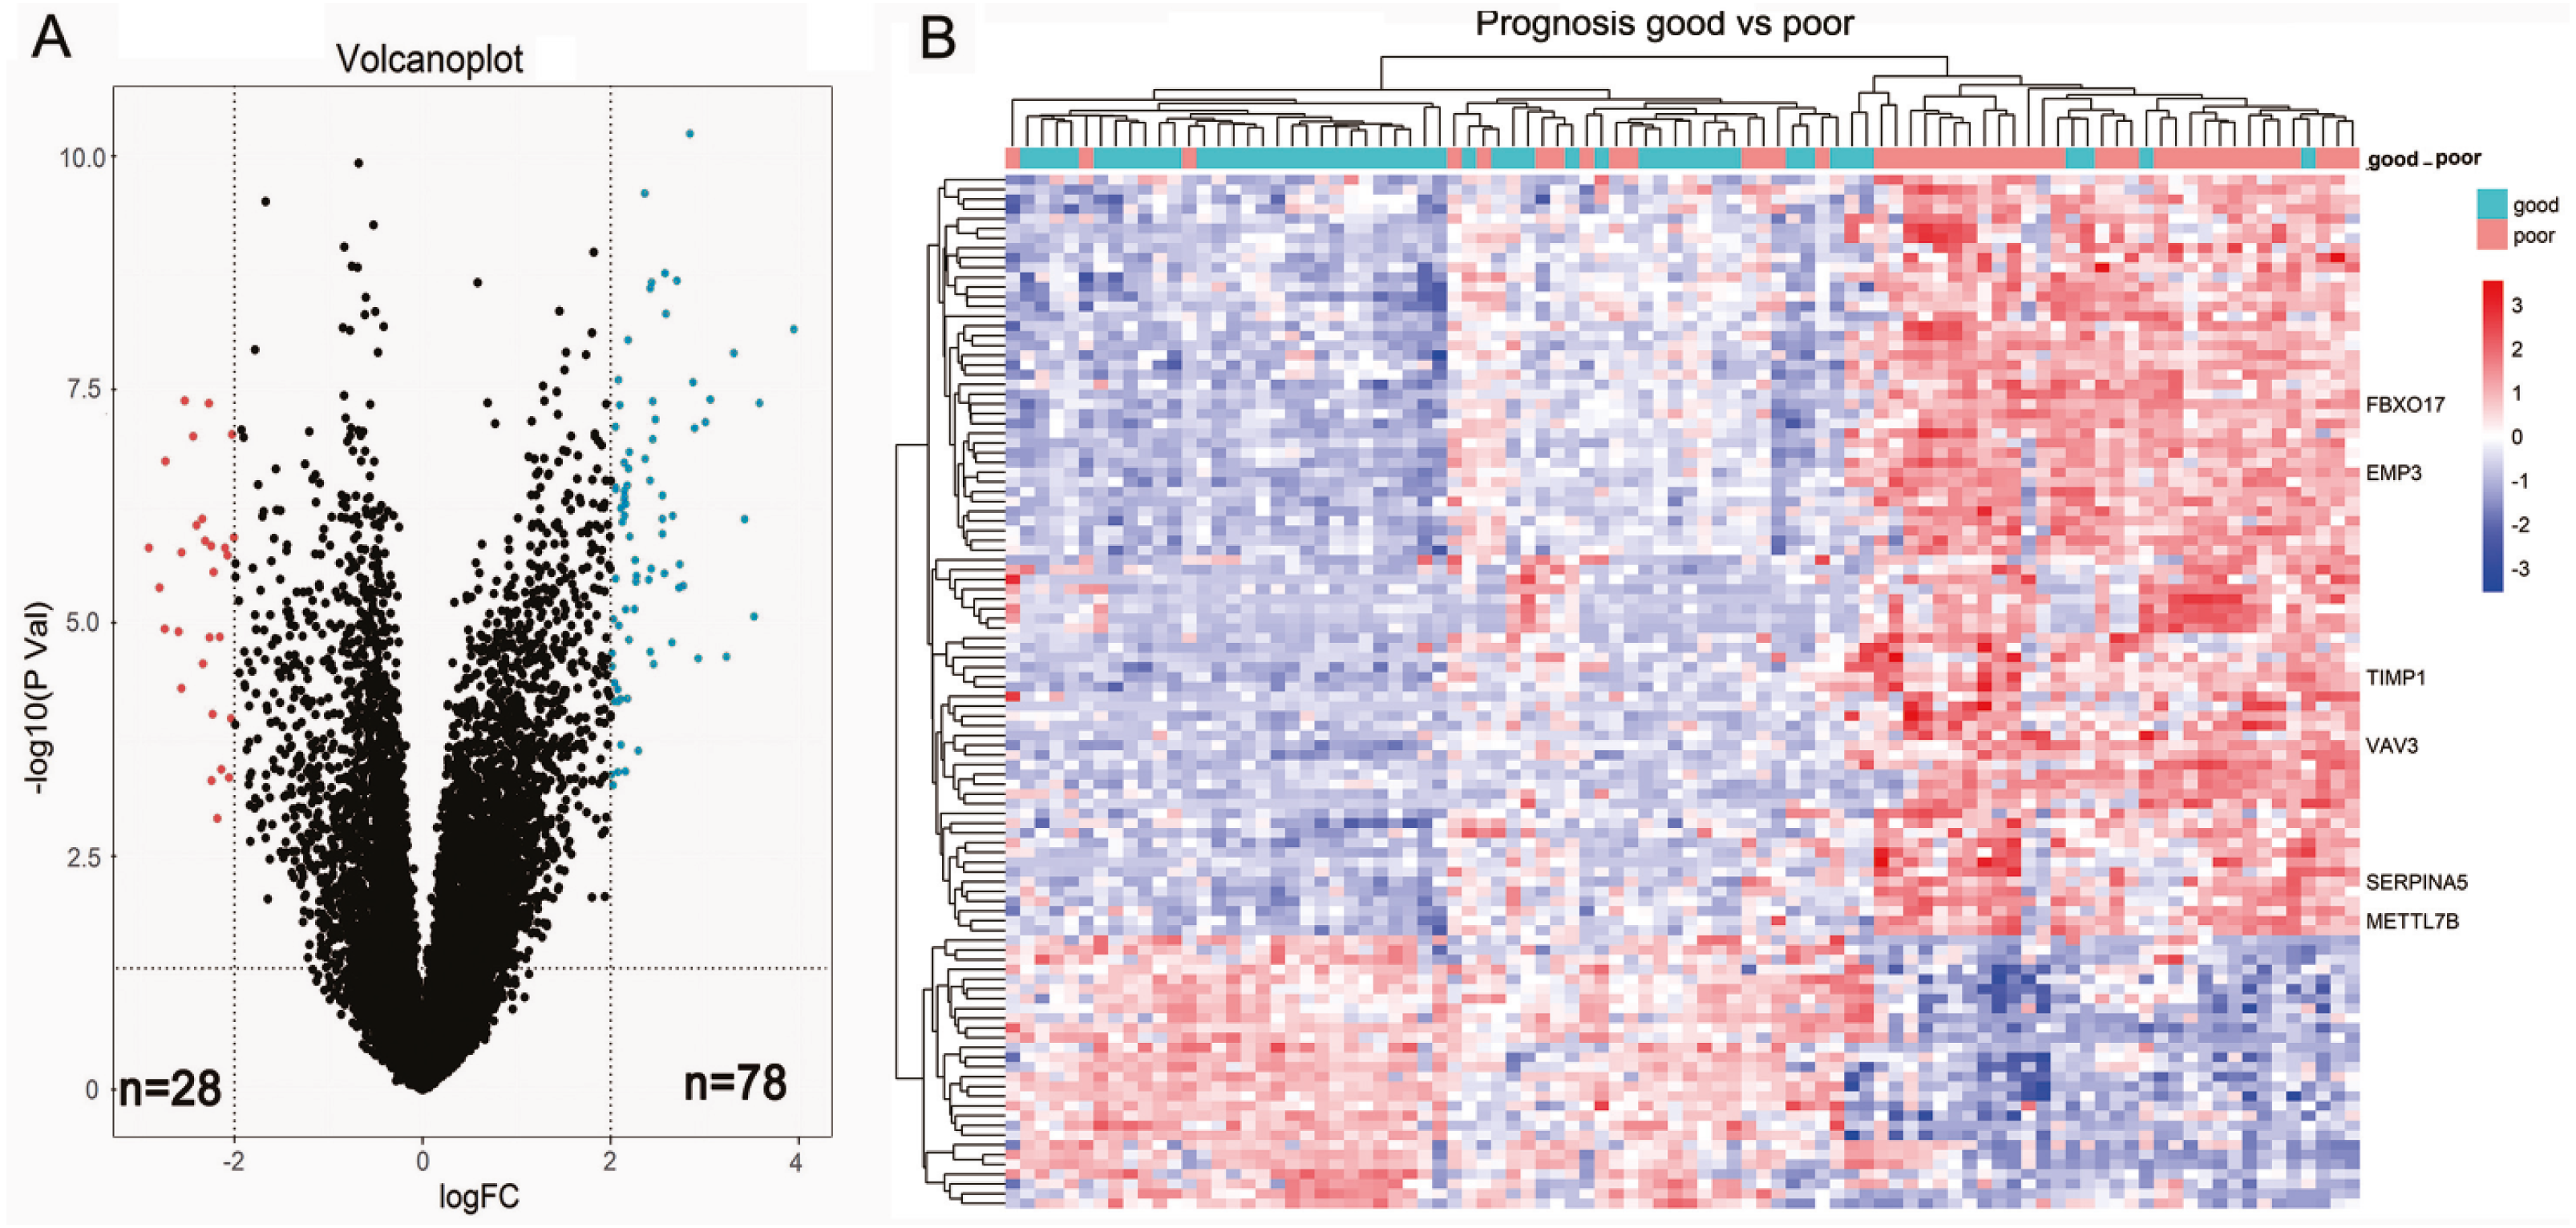
| Differentially expressed genes (DEGs) | |
|---|---|
| Up-regulated genes | EMP3, FBXO17, SERPINA5, VAV3, IGFBP2, TIMP1, METTL7B, CHI3L1, GALNT3, ABCC3, ZDHHC23, STAC, AQP5, CMYA5, MOXD1, FBLN7, HILS1, HOXA3, VASN, HOXA5, TOM1L1, MAP1LC3C, C13orf26, EVC2, WISP1, RARRES2, PDLIM4, SHROOM3, NPNT, RBP1, NKX2-5, GDF15, ANXA1, IGF2BP3, ADAM12, TSTD1, FABP5, TRPM8, DSG2, MEOX2, MAOB, PLA2G5, C11orf63, RYR3, HOXB3, HOXA2, PLA2G2A, CLEC5A, LOXL1, RGS22, FMOD, SHOX2, DMRTA2, PDPN, CA3, POSTN, SAA1, WNT16, CNGA3, LGR6, HOXA4, GPR1, LTF, HOXA7, TCTEX1D1, C21orf62, HMGA2, CXCL14, OTP, EYA4, HOXD11, SLC47A2, DDIT4L, COL22A1, IL13RA2, DES, ALDH1A3, C2orf39 |
| Down-regulated genes | ADAMTS20, CRTAC1, TMEM100, DAPL1, HMX1, WNT7B, NEUROD4, GFRA1, NDST4, FERMT1, PRLHR, DLL3, C5orf38, LPPR3, SMOC1, SFRP2, LOC154822, KLRC2, CSMD3, CUX2, PAX1, IRX2, HPSE2, SPHKAP, TSHR, psiTPTE22, TLX1, IRX1 |
Functional enrichment analysis of DEGs in LGGs
To explore the potential biological functions of prognostic related DEGs in LGGs, GO categories and KEGG Pathway enrichment analysis were performed using the DAVID online database. GO analysis revealed that 106 DEGs were significantly enriched in cell components such as proteinaceous extracellular matrix, extracellular space, extracellular exosome and basement membrane, and was involved in the biological processes such as multicellular organism development, thyroid gland development and anterior/posterior pattern specification (Table S1 ). KEGG Pathway enrichment analysis showed that DEGs mainly enriched in phenylalanine metabolism and histidine metabolism, but the result was not significant (Table S1).
Survival value of top significant DEGs in LGGs
Then, TCGA-LGG and CGGA-LGG datasets were used to verify the prognostic value of the top eight significant changed genes, including EMP3, FBXO17, METTL7B, SERPINA5, SSTR5, TIMP1, TMEM61, VAV3. In the TCGA LGG dataset, SERPINA5 high expression indicated the worse OS and RFS of LGG patients (Figs. 2D, 2L). However, TIMP1 high expression can only predict the shorter OS of patients and has no significant correlation with the RFS of LGG patients (Figs. 2F, 2N). Moreover, the expression of SERPINA5 and TIMP1 in the CGGA dataset were coincident with those of TCGA dataset, with significant differences in OS (Fig. 3). Additionally, SERPINA5 and TIMP1 mRNA expression were significantly increased with the increase of glioma grades in both TCGA LGG dataset and CGGA dataset (Fig. 4).
The association between expression of the candidate genes and clinical characteristics in CGGA lower-grade glioma patients is presented in Table 2. Univariate analysis indicated that karnofsky performance score (KPS) ≥70 was significantly associated with better survival in patients (HR = 0.127, 95% CI [0.037–0.434], P = 0.001), and tumor grade (grade III vs grade II) was significantly correlated with poor survival in patients (HR = 8.883, 95% CI [3.670–21.501], P = 0.000001). Multivariate analysis, adjusted for KPS and tumor grade, also showed that the top two DEGs were significantly associated with survival. TIMP1 high expression group exhibited poor survival as compared to low expression group (HR = 8.656, 95% CI [2.578–29.060], P = 0.014). Unfortunately, SERPINA5 high expression was not an independent poor predictor for OS of LGGs patients (HR = 0.473, 95% CI [0.192–1.164], P = 0.103).
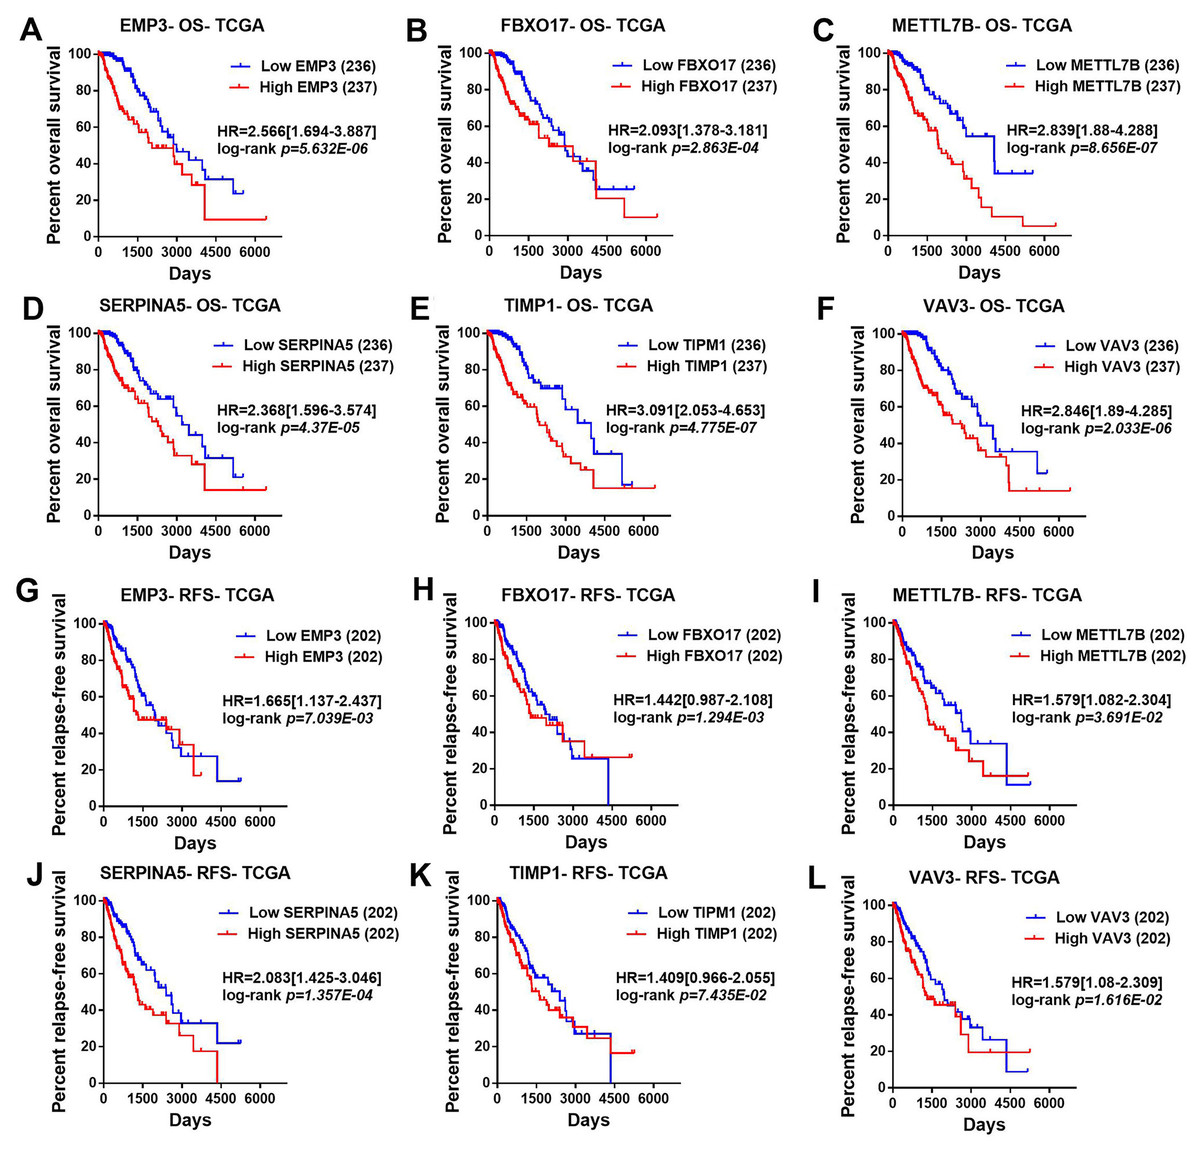
Figure 2: Correlation between the top six significant changed genes’ expression and patients’ survival in lower-grade glioma with TCGA LGG dataset.
(A–F) Kaplan–Meier plot for overall survival between LGG patients with high level and low level of EMP3, FBXO17, METTL7B, SERPINA5, TIMP1, VAV3 mRNA expression in TCGA LGG dataset. (G–L) Kaplan–Meier plot for relapse-free survival between LGG patients with high level and low level of EMP3, FBXO17, METTL7B, SERPINA5, TIMP1, VAV3 mRNA expression in TCGA LGG dataset.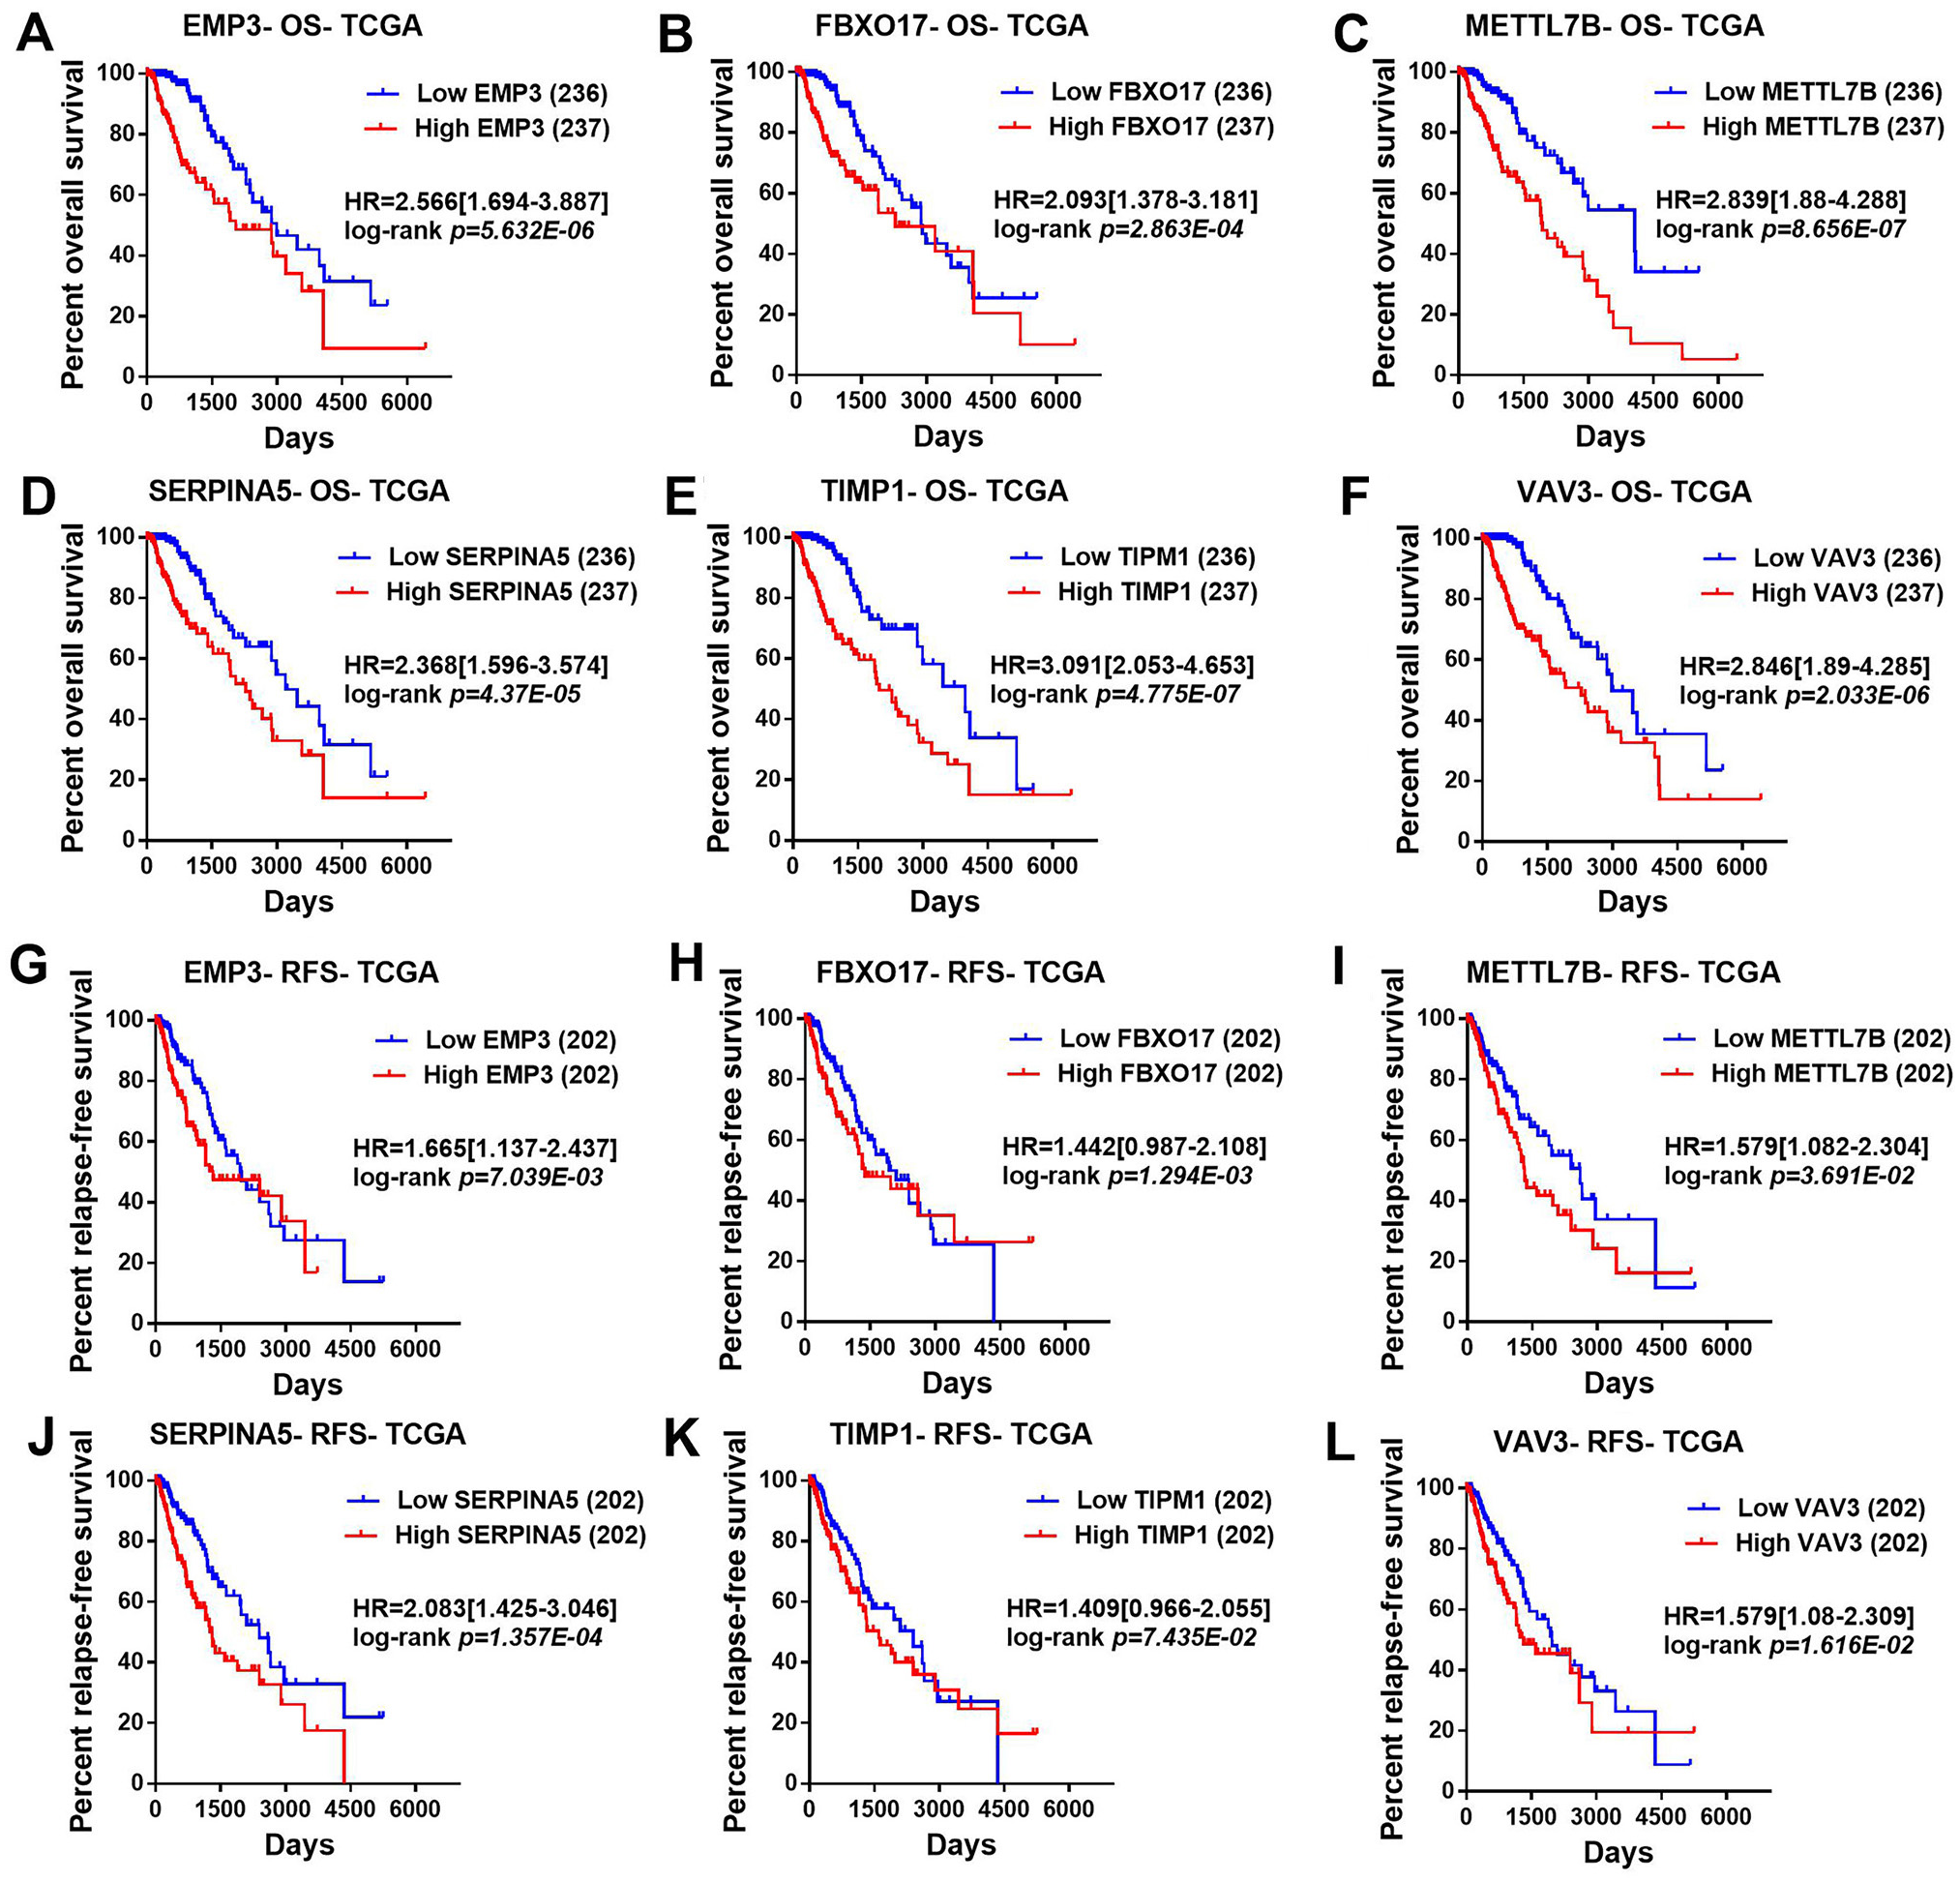
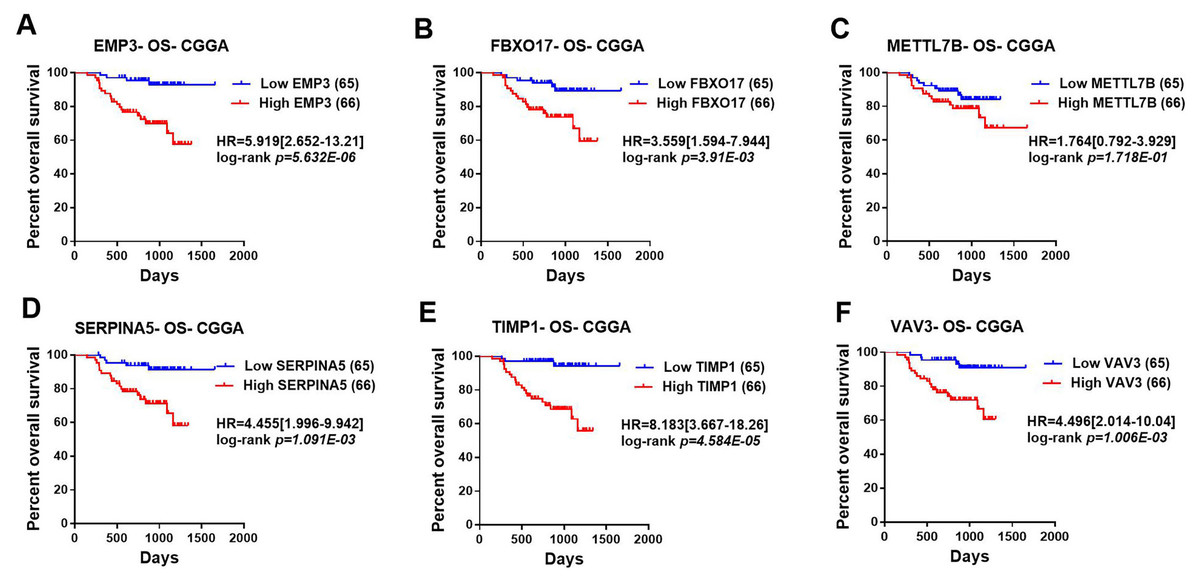
Figure 3: Correlation between the top six significant changed genes’ expression and patients’ survival in lower-grade glioma with CGGA dataset.
(A–F) Kaplan–Meier plot for overall survival between patients with high level and low level of EMP3, FBXO17, METTL7B, SERPINA5, TIMP1, VAV3 mRNA expression in CGGA dataset.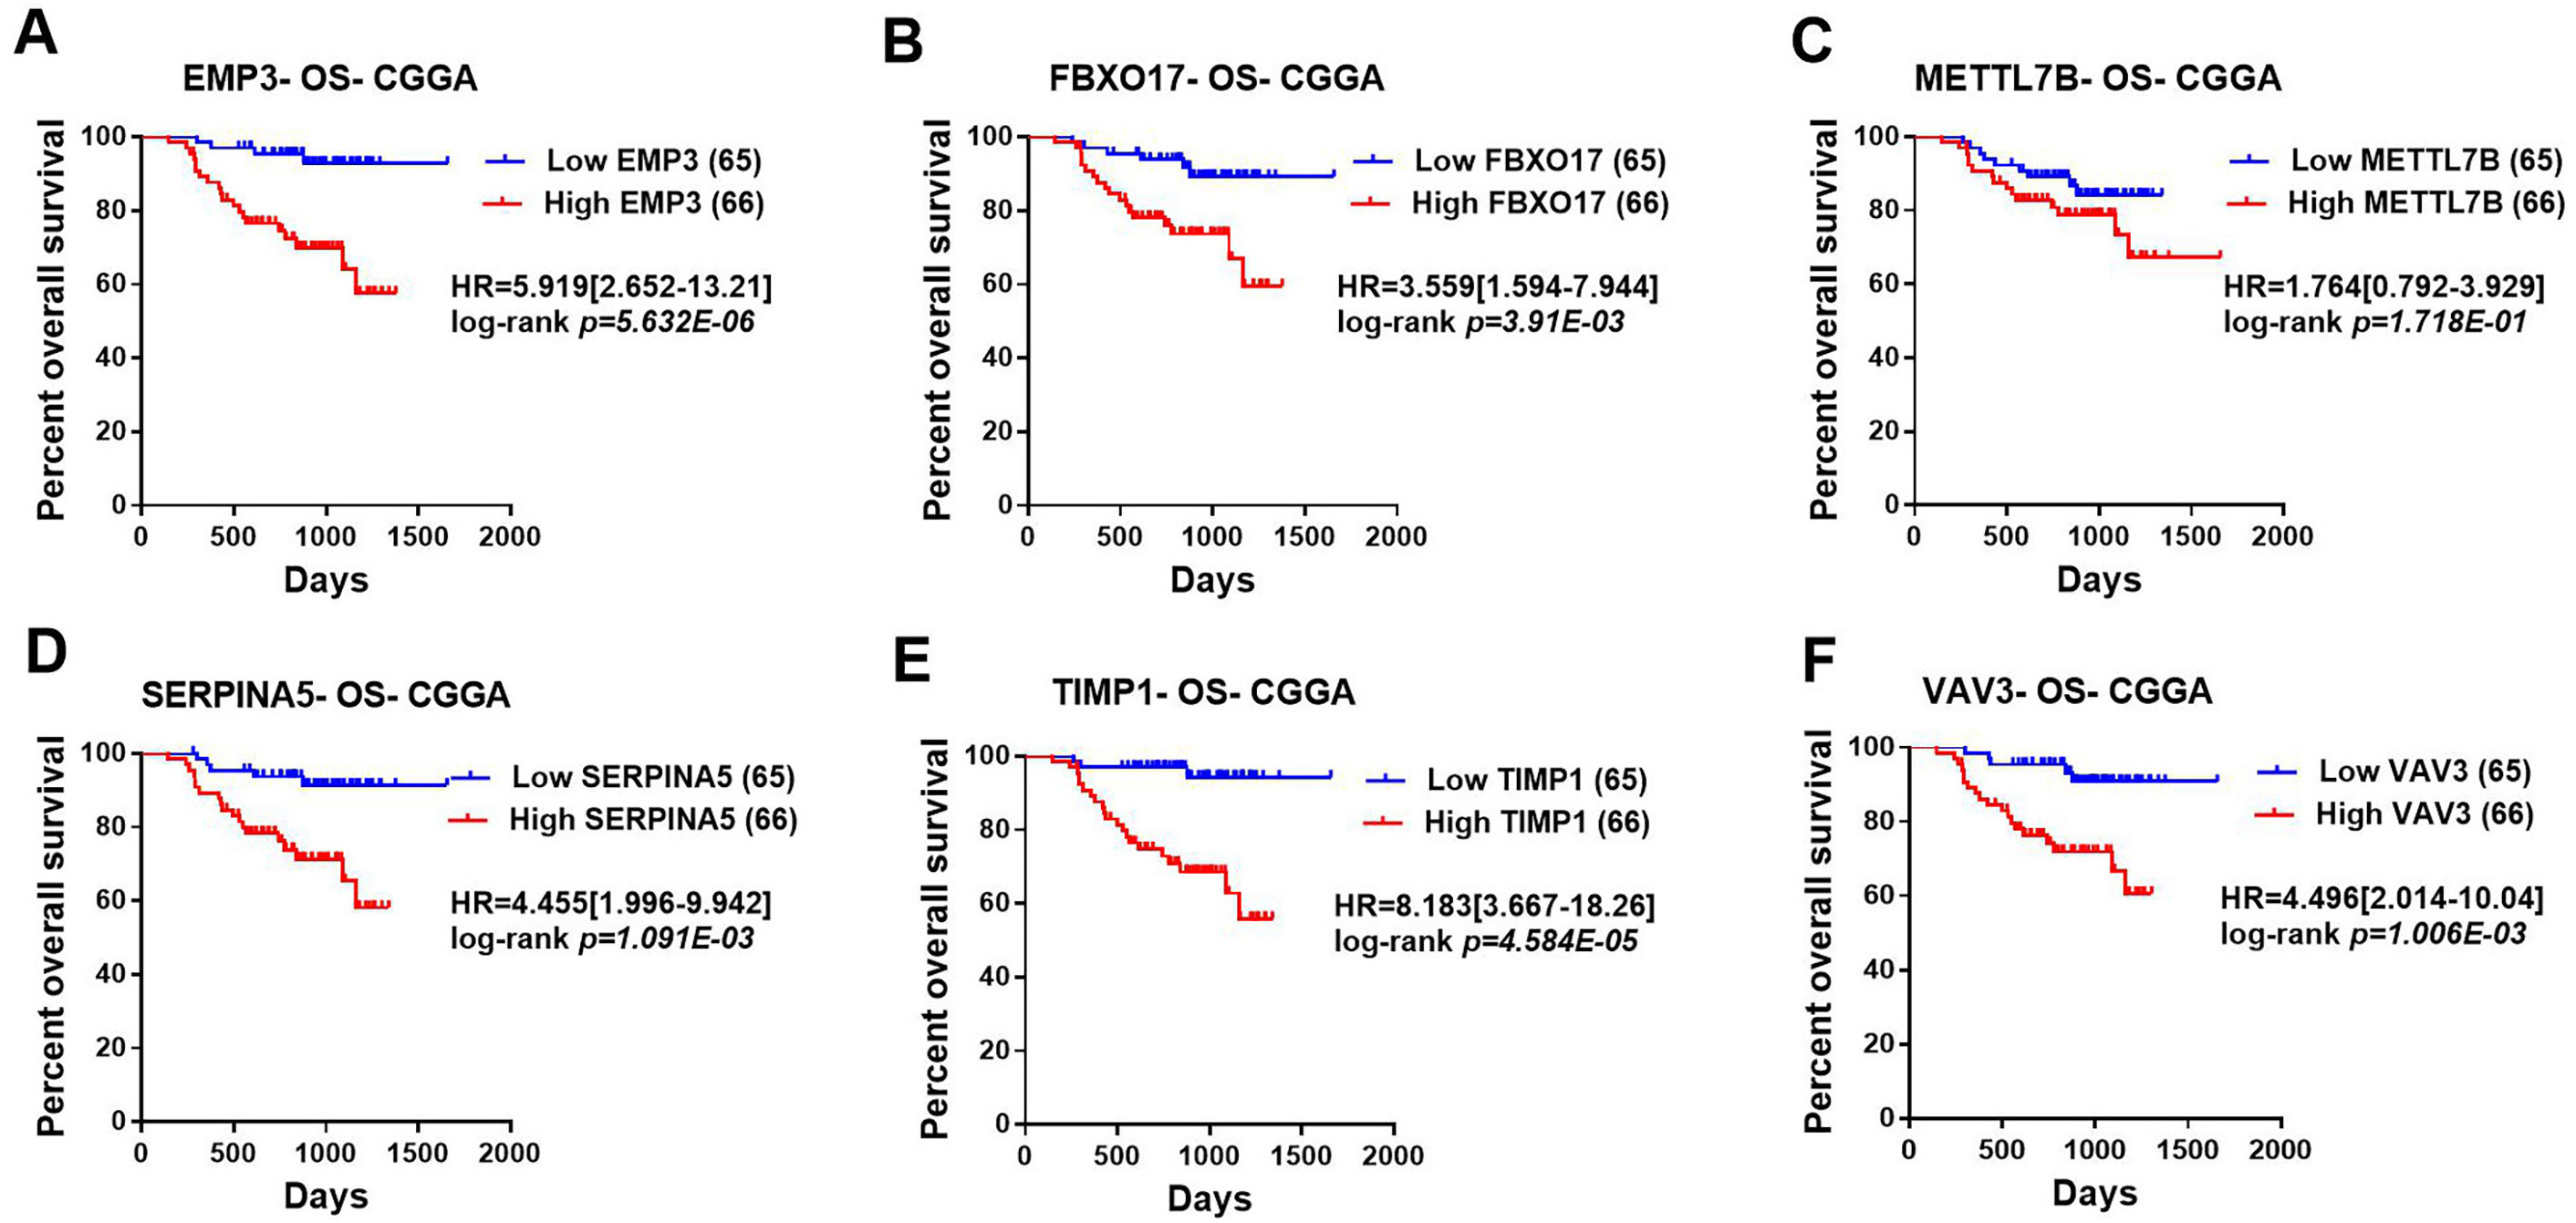
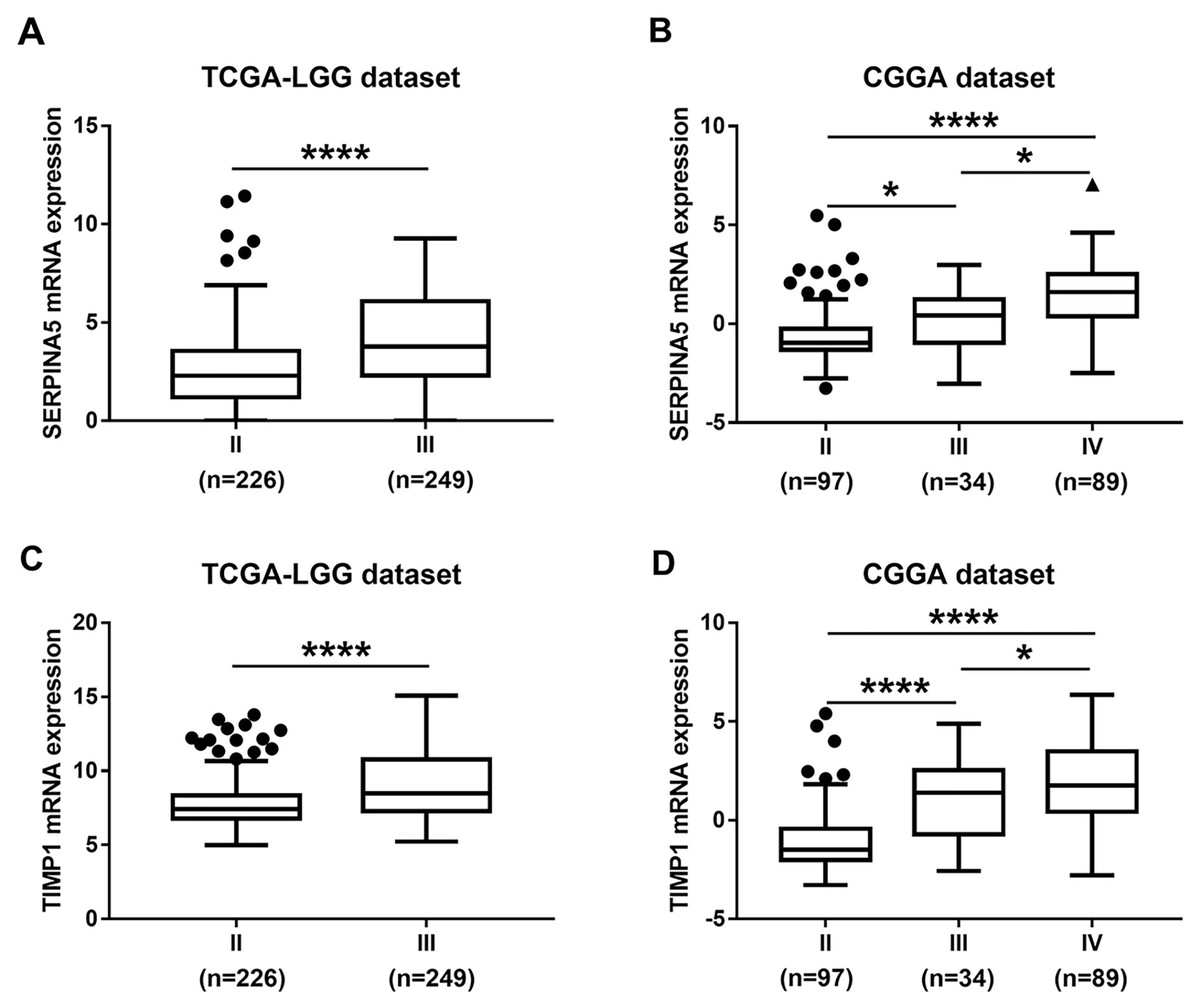
Figure 4: SERPINA5 and TIMP1 mRNA expression in glioma tissues.
(A, B) The mRNA expression of SERPINA5 in grade II or grade III patients in TCGA LGG and CGGA LGGs cohort. The results are mean ± SD, ∗P < 0.05, ∗∗∗∗P < 0.0001. (C, D) The mRNA expression of TIMP1 in grade II or grade III patients in TCGA LGG and CGGA LGGs cohort. The results are mean ± SD, ∗P < 0.05, ∗∗∗∗P < 0.0001.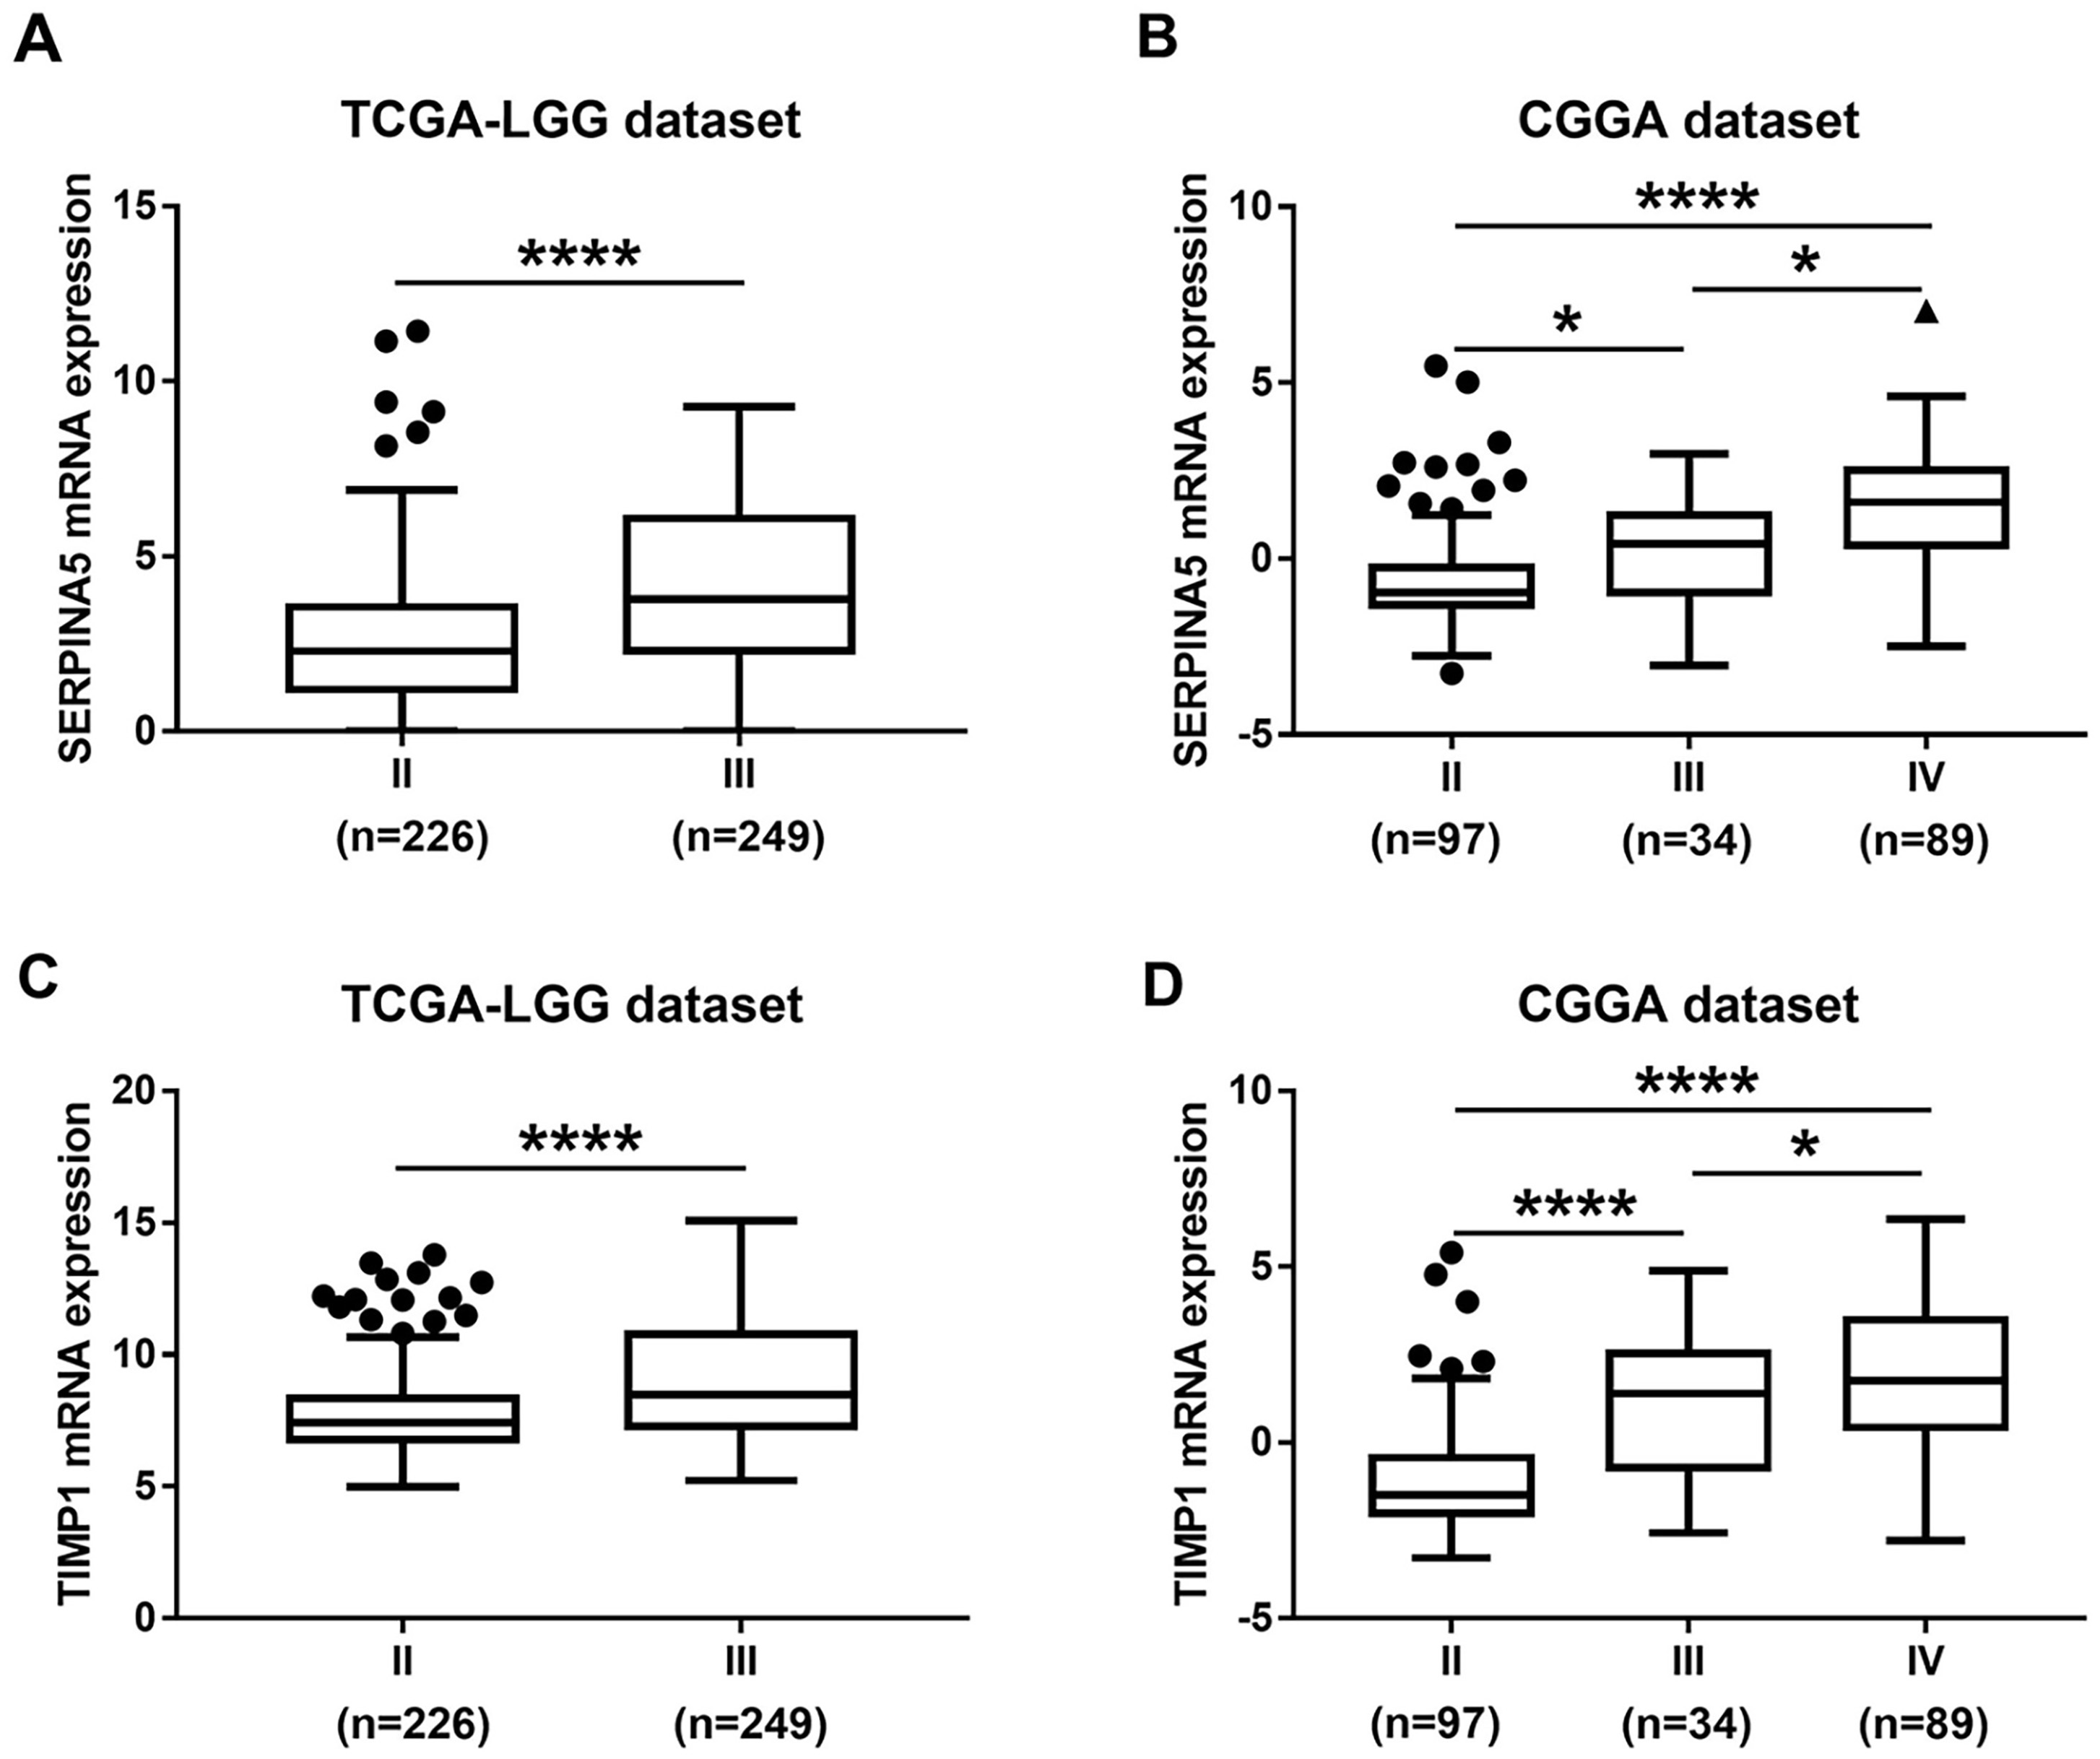
DNA promoter hypermethylation silences SERPINA5 and TIMP1 mRNA expression
To investigate the correlation between gene expression and DNA methylation, we performed a parallel DNA methylation analysis of the candidate genes. Mapping SERPINA5 and TIMP1 to DNA methylation probes identified 23 and 14 methylation sites, respectively. To obtain differentially methylated sites, patients were divided into two groups according to the median of gene expression. Of the 37 methylation sites, 4 differential methylation sites (SERPINA5 cg15509705; TIMP1 cg27151711; TIMP1 cg16523424; TIMP1 cg04791822) were identified (Table S2). As shown in Fig. 5, the methylation status of 4 methylation sites were remarkably lower in high gene expression group than low gene expression group. Furthermore, the correlation analysis revealed that 4 methylation sites were negatively correlated with gene expression levels (Spearman r < − 0.4, P < 0.0001, Fig. 5).
SERPINA5 and TIMP1 methylation are potent prognostic markers for LGGs
In order to identify the effect of these methylation sites on prognosis, we assessed the association between 4 methylation sites and prognosis with the TCGA LGG DNA methylation dataset. The samples were divided into two groups with methylation β value of 0.5 as the cut-off value and the prognostic difference were compared. As shown in Figs. 6A–6D, hyper-methylation of 4 methylation sites indicated better OS (SERPINA5 cg15509705: HR = 1.66, 95% CI [1.101–2.501], P < 0.0001; TIMP1 cg27151711: HR = 5.375, 95% CI [2.435–11.87], P < 0.0001; TIMP1 cg16523424: HR = 3.978, 95% CI [2.245–7.049], P <0.0001; TIMP1 cg04791822: HR = 7.284, 95% CI [2.458–21.59], P <0.0001). In addition, except for SERPINA5 cg15509705 (HR = 1.411, 95% CI [0.967–2.058], P = 0.0762, Fig. 6E), hypo-methylation of 3 other methylation sites the high-risk group exhibited significantly worse RFS (TIMP1 cg27151711: HR = 4.700, 95% CI [2.127–10.38], P <0.0001; TIMP1 cg16523424: HR = 3.037, 95% CI [1.738–5.307], P < 0.0001; TIMP1 cg04791822: HR = 5.653, 95% CI [1.936–16.51], P < 0.0001, Figs. 6F–6H).
Functional enrichment analysis of SERPINA5- and TIMP1-associated co-expressed genes
Then, we used GENEMANIA online database to identify the proteins interacting with SERPINA5 and TIMP1. As shown in Fig. 7A, SERPINA5 mainly interacts with PROC, which has serine hydrolase activity and functions as a negative regulation of hemostasis and coagulation. While TIMP1 interacts with extracellular matrix proteins MMP1, MMP3 and MMP9, and participants in the processes of extracellular matrix disassembly and organization, collagen catabolism and metabolism (Fig. 7B).
| Overall survival | Univariate | Multivariate | ||
|---|---|---|---|---|
| P-value | HR [95% CI] | P-value | HR [95% CI] | |
| Age | 0.066 | 1.037[0.998–1.078] | ns | – |
| Gender: male vs female | 0.474 | 1.342[0.599–3.006] | ns | – |
| Histology, Astrocytoma | 0.104 | 2.024[0.866–4.731] | ns | – |
| Oligoastrocytoma/Oligodendroglioma | ns | – | ||
| KPS: ≥70 vs <70 | 0.001 | 0.127[0.037–0.434] | ns | – |
| IDH1: mut vs wild type | 0.305 | 0.656[0.293–1.467] | ns | – |
| Tumor grade: Grade ?vs Grade? | 0.000001 | 8.883[3.670–21.501] | 0.000257 | 5.551[2.214–13.915] |
| SERPINA5 expression: high vs low | 0.103 | 0.473[0.192–1.164] | ns | – |
| TIMP1 expression: high vs low | 0.000478 | 8.656[2.578–29.060] | 0.014 | 4.825[1.370–17.000] |
Notes:
Bold font indicates statistical significance.
- KPS
-
karnofsky performance score
- IDH1
-
isocitrate dehydrogenase 1
- SERPINA5
-
Serpin family A member 5
- TIMP1
-
TIMP Metallopeptidase Inhibitor 1
- HR
-
Hazard ratio
- CI
-
confidence intervals
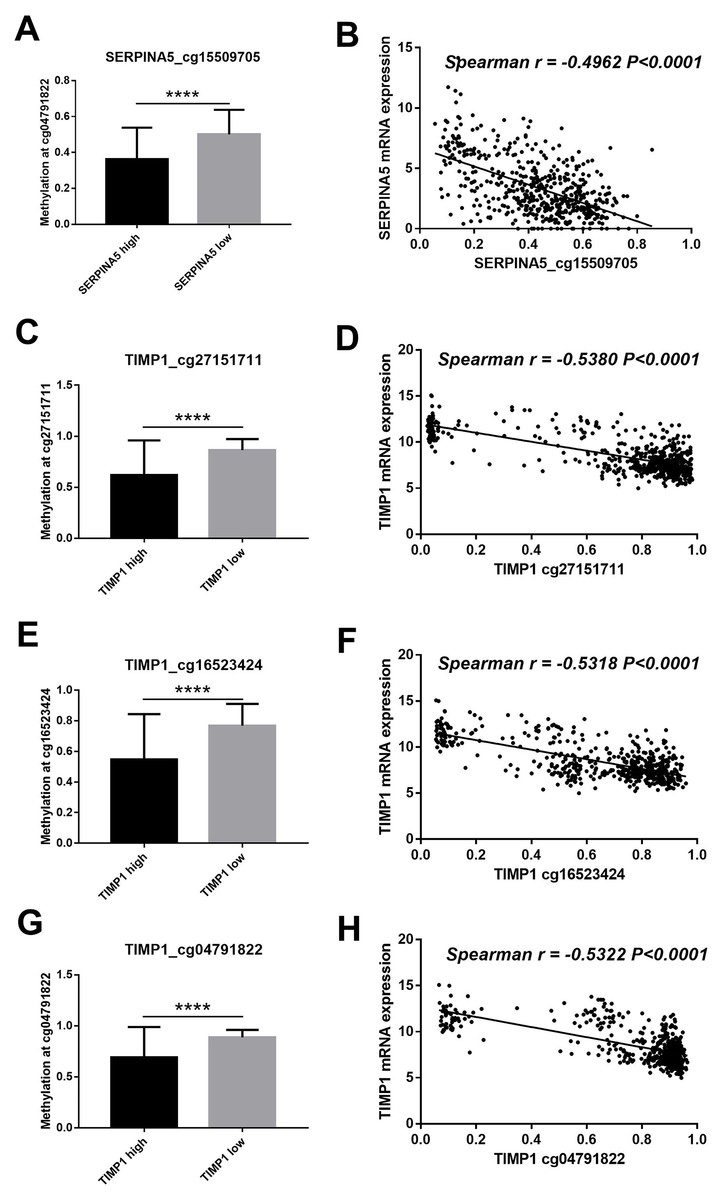
Figure 5: DNA methylation of SERPINA5 and TIMP1 is related to gene expression.
(A, C, E, G) According to the median of gene expression, LGGs samples were divided into two groups to obtain differential methylation site between two groups. The results are mean ± SD, ∗∗∗∗P < 0.0001. (B, D, F, H) The correlation betweenSERPINA5 and TIMP1 gene expression levels and DNA methylation levels of CpG sites were assessed using Spearman’s correlation analysis.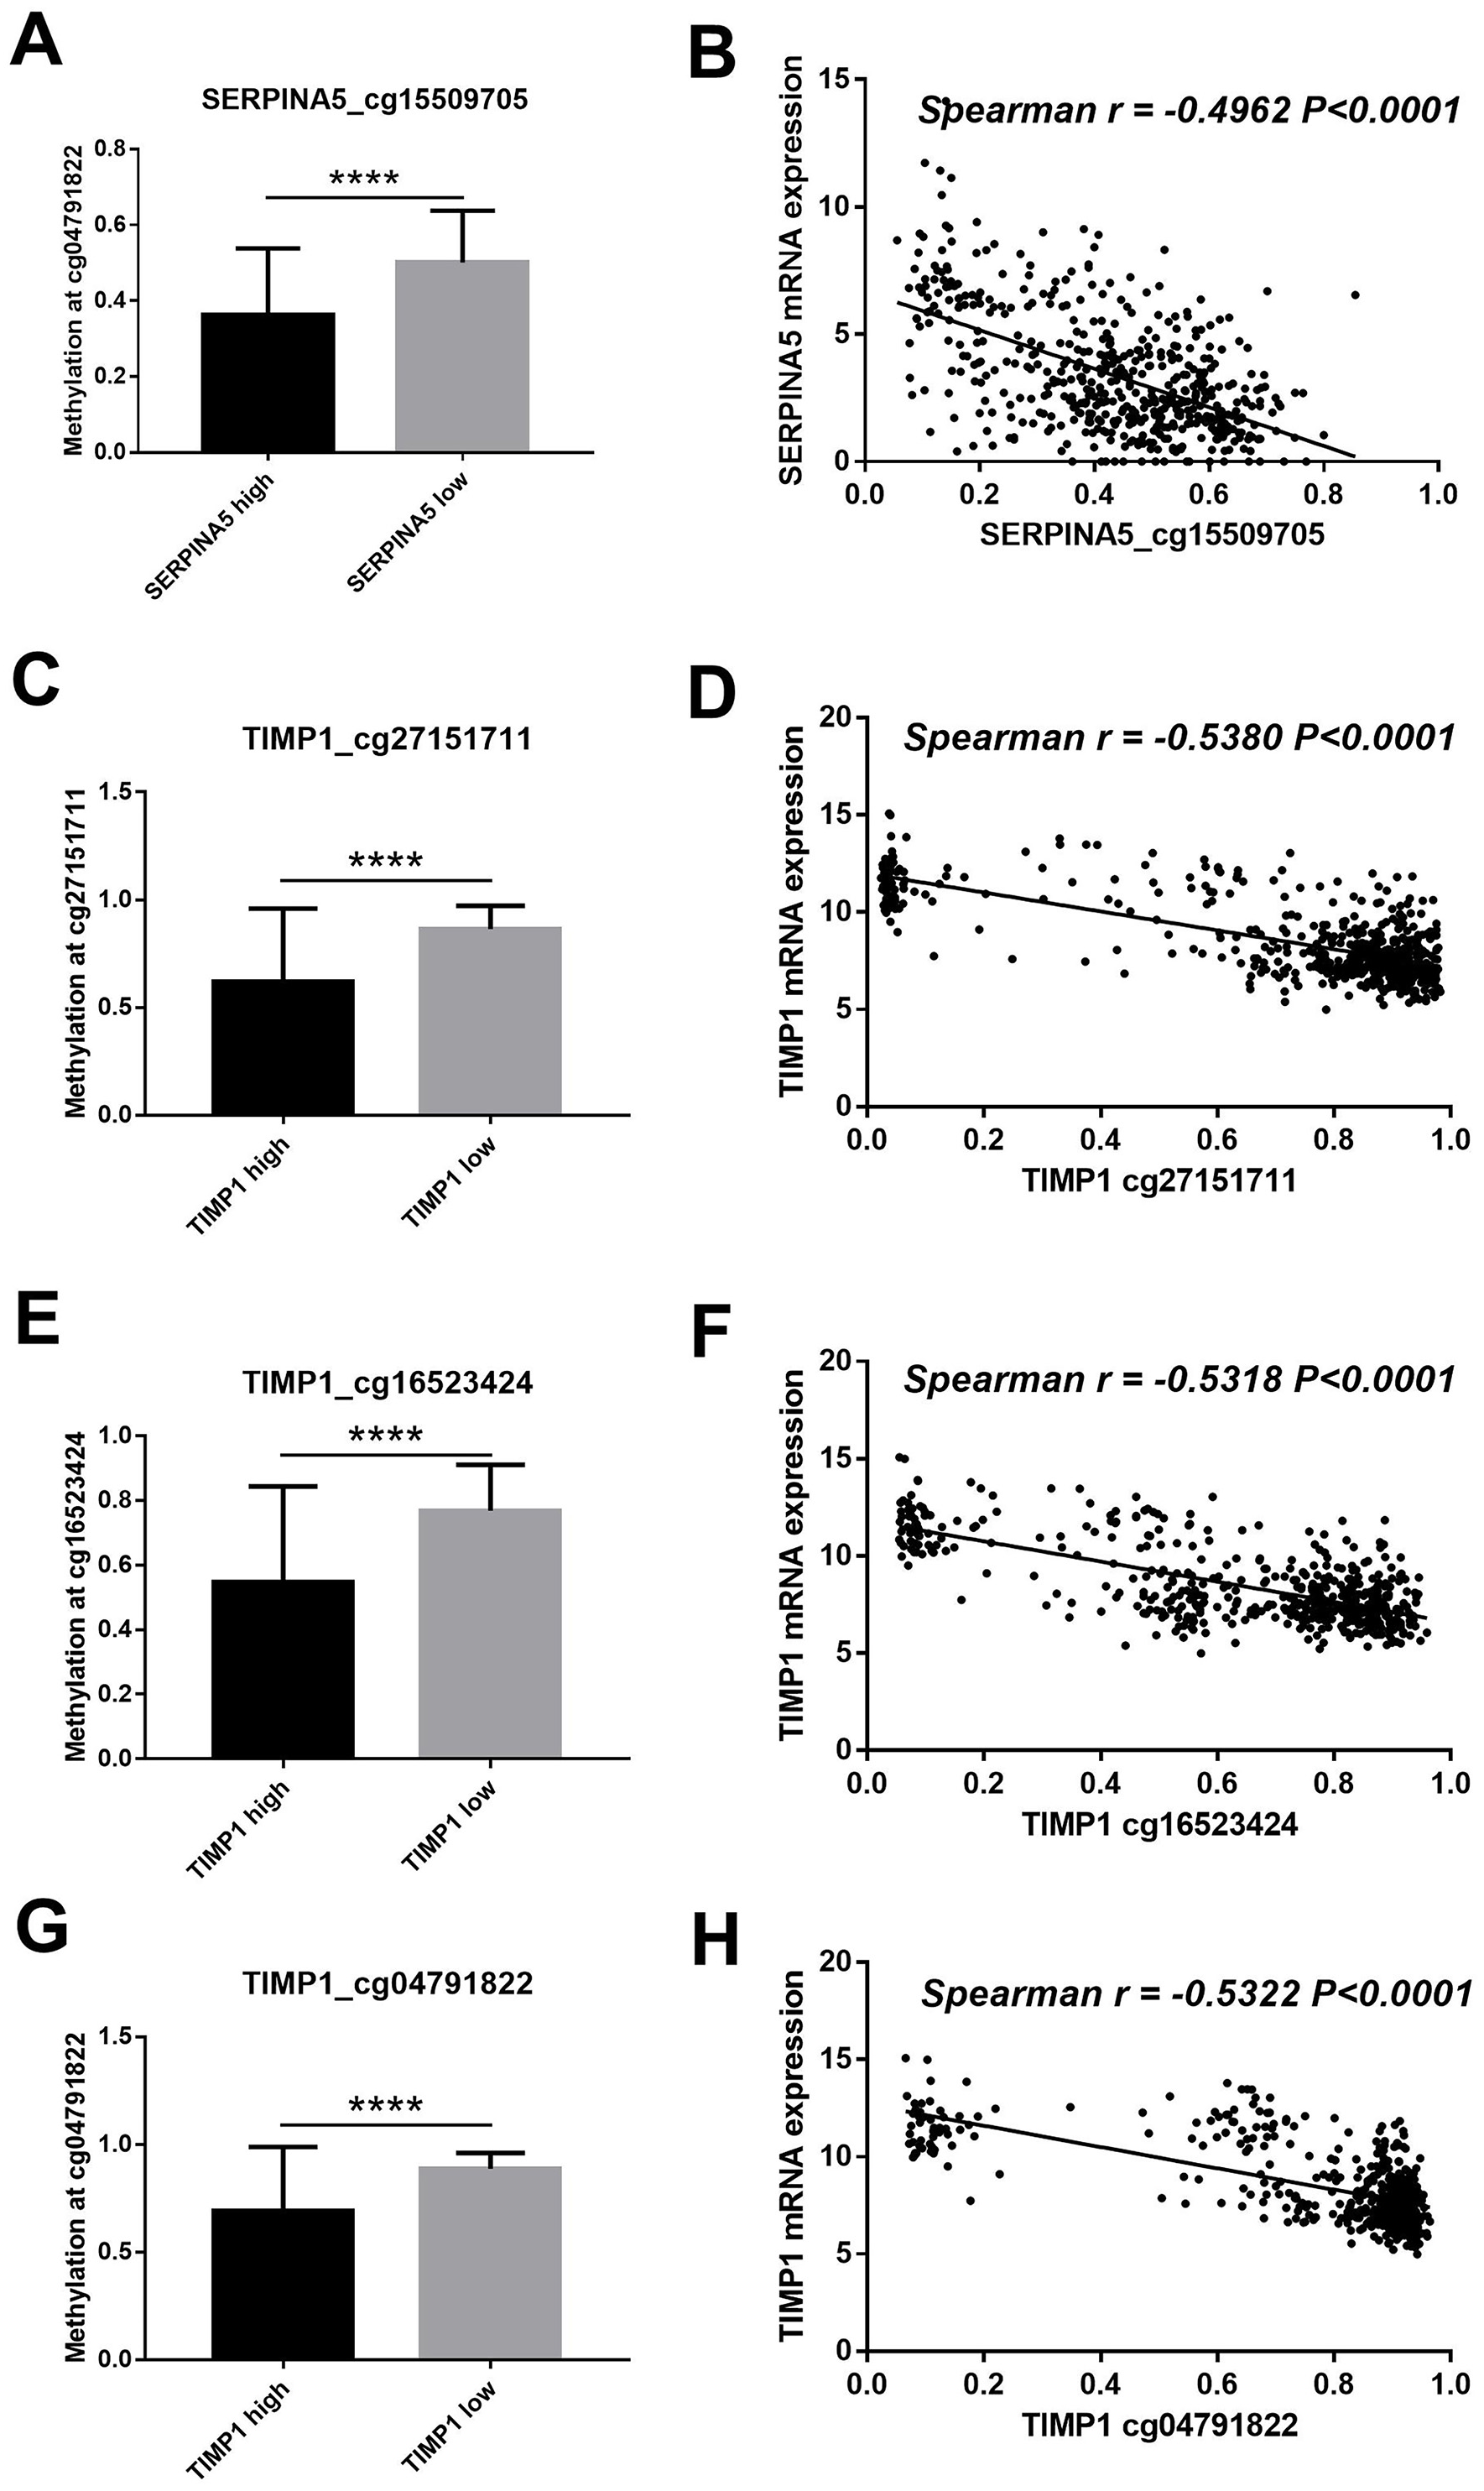
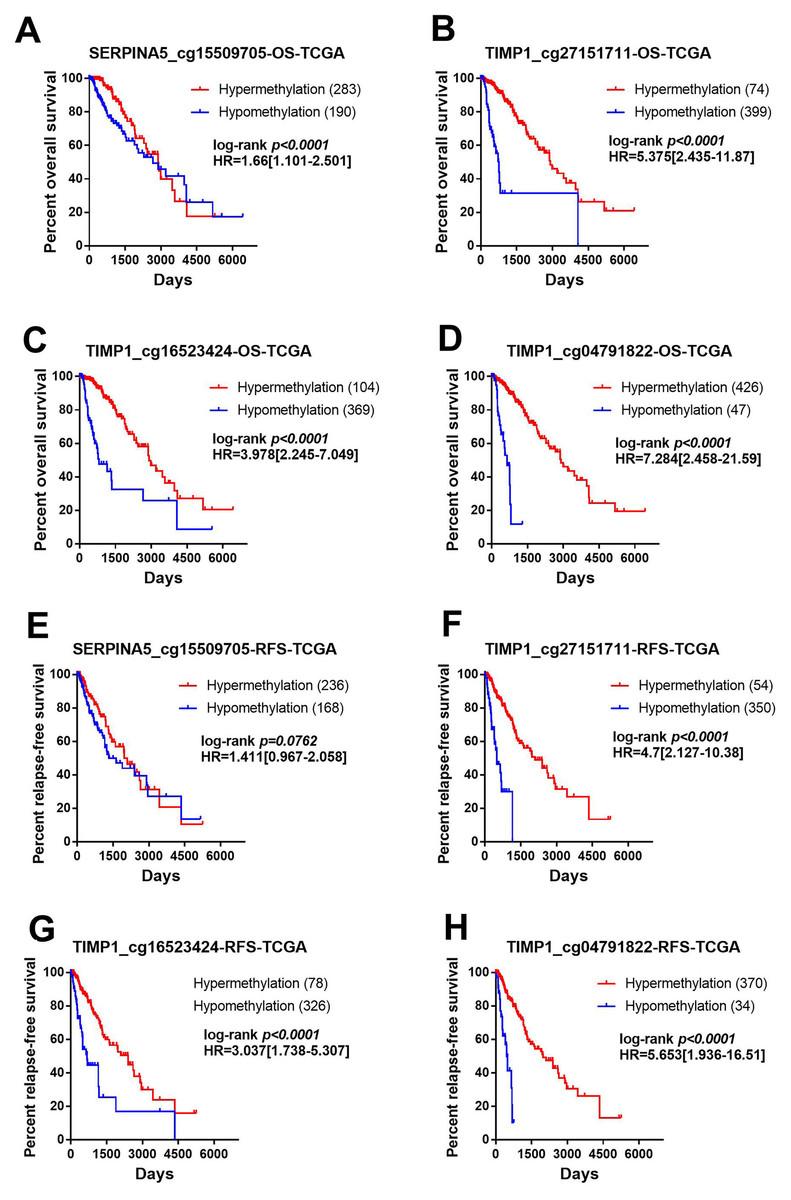
Figure 6: Methylation of SERPINA5 and TIMP1 CpG sites is associated with the survival of LGGs patients.
Samples were divided into two groups with methylation beta value of 0.5 as the cut-off value and compared the difference of prognosis between the two groups. (A–D) Kaplan–Meier survival curves for overall survival between differentially methylated status of SERPINA5 and TIMP1 and patients in the TCGA LGG patients. (E–H) Kaplan–Meier plot for relapse-free survival between patients with hyper-methylation and hypo-methylation of SERPINA5 and TIMP1 in TCGA LGG patients.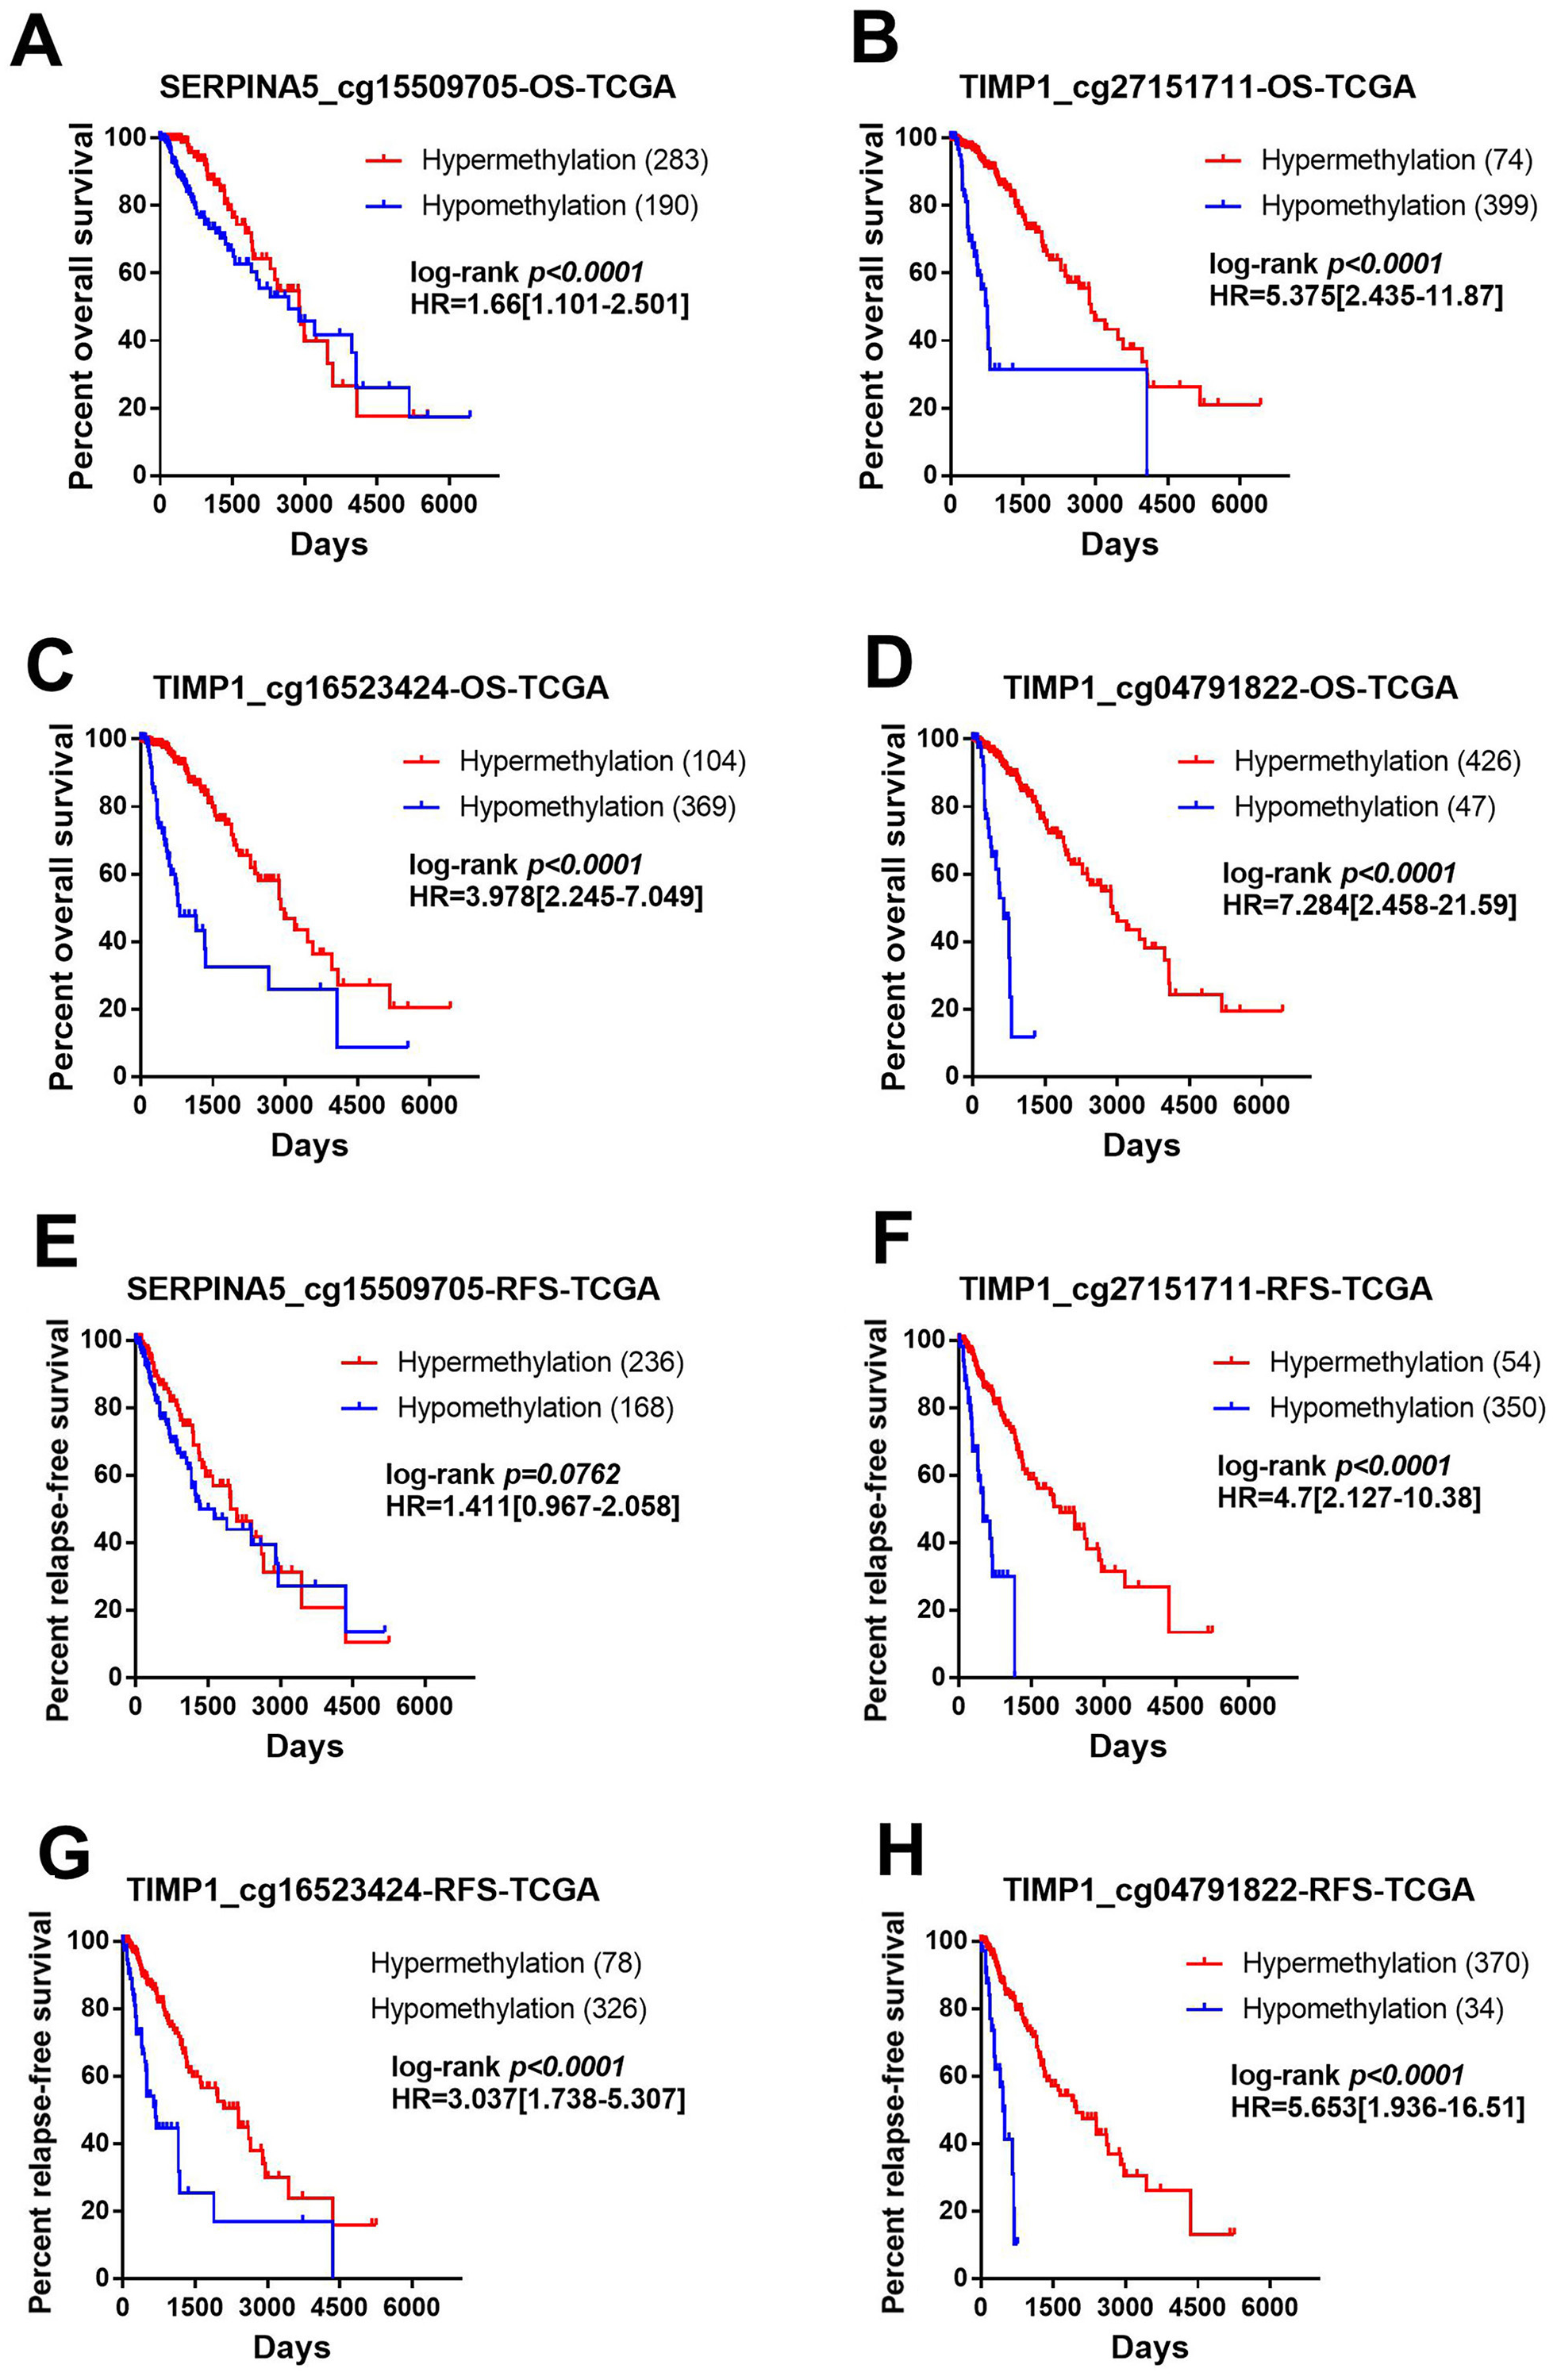
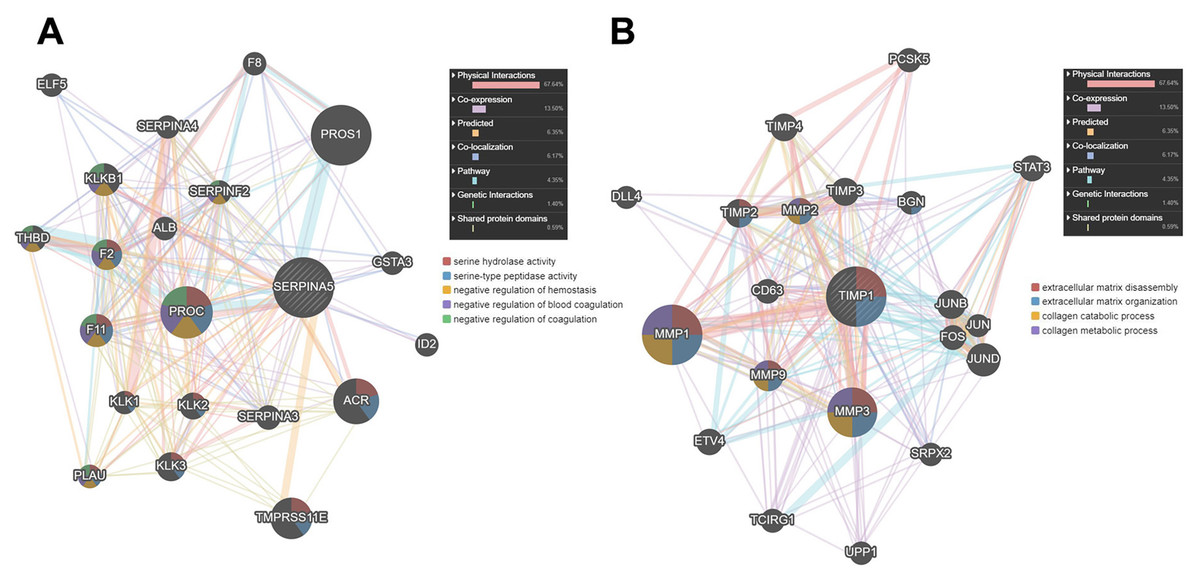
Figure 7: The PPI network of SERPINA5 and TIMP1 generated by the GENEMANIA online database.
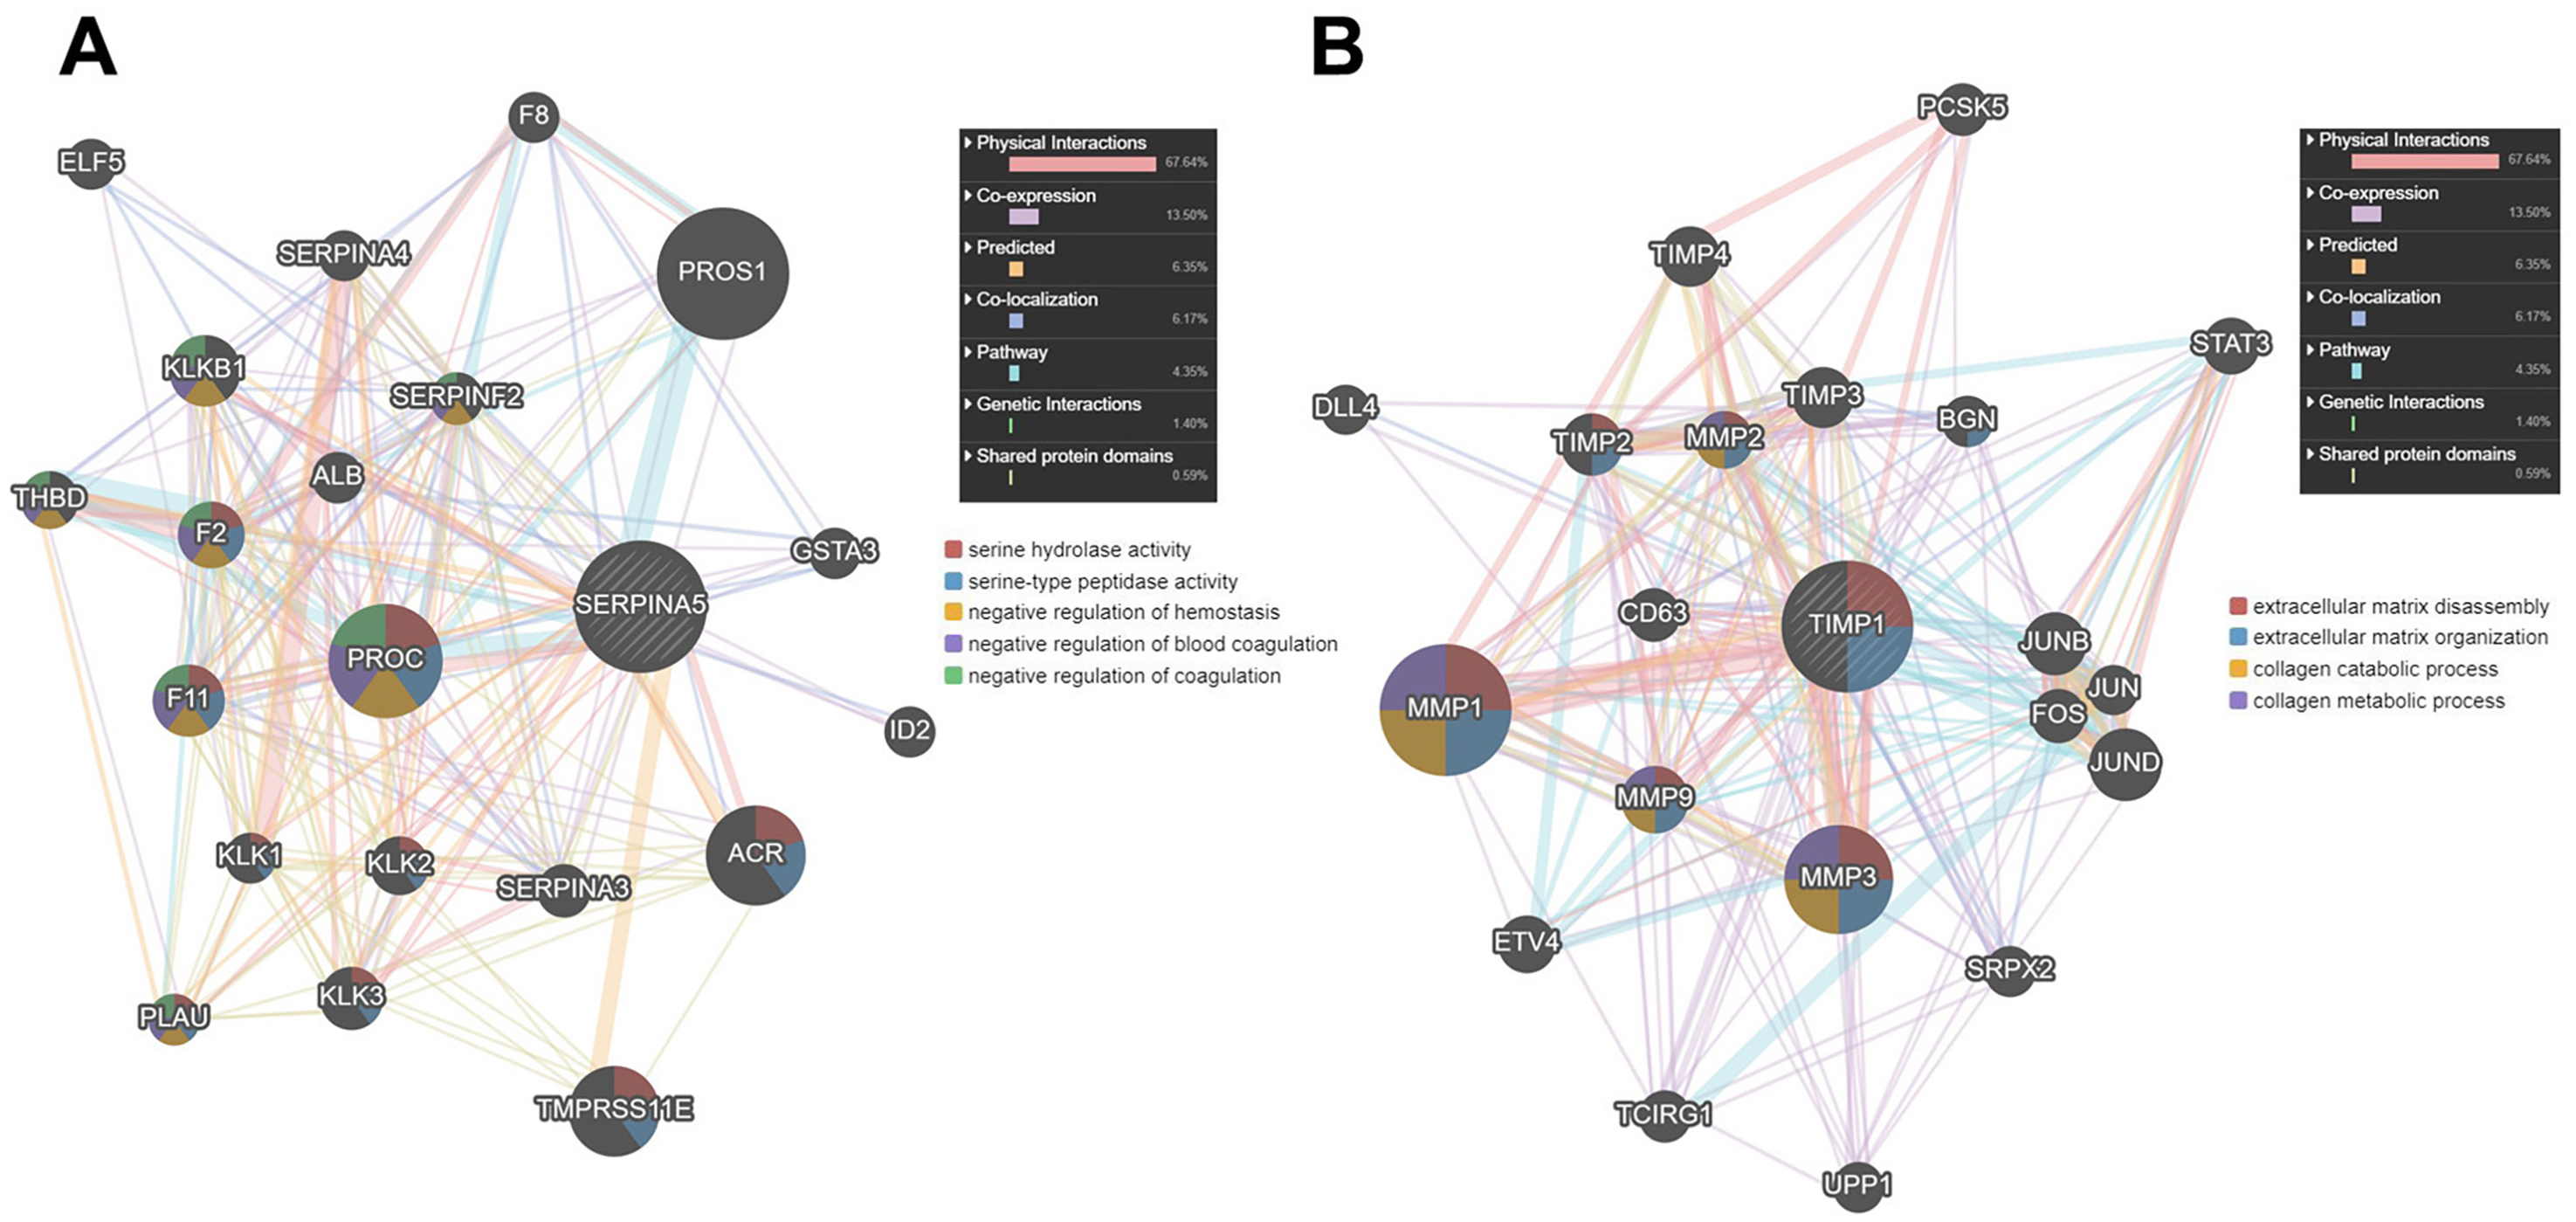
Discussion
This study was conducted to identify DEGs between long-term and short-term survivors in LGGs with TCGA LGG RNA-seq dataset and we obtained 106 DEGs, among which SERPINA5 and TIMP1 were differentially expressed. Since removing the “the samples that did not reach the end time” might skew the results, we analyzed the differentially expressed genes without removing any data, and SERPINA5 and TIMP1 were also differentially expressed between short-term and long-term survivors in LGGs (SERPINA5: log FC = 0.833, adjusted P = 0.00488; TIMP1: log FC = 0.788, adjusted P = 0.00253). Thus, this study focused on these two genes.
SERPINA5 (protein C inhibitor, PCI) is a member of serine protease inhibitor super family, which can inhibit several serine proteases, including protein C and various plasminogen activators and kallikreins, and it thus plays diverse roles in hemostasis and thrombosis in multiple organs (Yang & Geiger, 2017). Extracellular matrix degradation is facilitated by uPA, allowing tumor cells to invade surrounding tissue (Fortenberry, 2015). SerpinA5 is an uPA inhibitor that prevents the conversion of plasminogen to plasminogen and subsequent extracellular matrix degradation (Smith & Marshall, 2010). Previous studies indicated that the dysregulation of SERPINA5 has been implicated in migration, invasion and metastasis in hepatocellular carcinoma, ovarian and prostate cancers (Bijsmans et al., 2011; Cao et al., 2003; Jing et al., 2014). However, the roles of SERPINA5 in gliomas remains unknown. In this study, we found that SERPINA5 expression was significantly correlated with OS and RFS in LGG patients, and SERPINA5 high expression indicated patients with worse survival. More recently, researchers have found that the high methylation degree of CpG sites significantly correlated with lower SERPINA5 expression levels and two distinct CpG sites of the SERPINA5 promoter were hypermethylated in normal epithelial prostate cells, benign hyperplasic cells and low-invasive malignant LNCaP cells, whereas essentially unmethylated in aggressive DU-145 and PC-3 cell line (Hagelgans et al., 2017). In addition, SERPINA5 has been identified to be more highly methylated in HR-, basal-like, or p53 mutant breast cancer than HR+, luminal A, or p53 wild-type breast cancers, and gene signature composed of SERPINA5 and 3 other genes can predict the prognosis of patients with stage I LUAD (Conway et al., 2014; Luo, Wang & Zhang, 2018). These evidences suggested that methylation of SERPINA5 may be used to indicate the malignancy of some tumors and to predict the prognosis of patients. In this study, our results also shown that hyper-methylation of SERPINA5 was statistical significantly association with lower expression and better prognosis in LGGs. Previous research has reported that the expression of coagulation inhibitors PRCO and SERPINA5 is strongly regulated by sex-specific GH patterns (Wong et al., 2008). While the exact role of SERPINA5 in glioma progression remains to be determined.
Experimental studies have demonstrated the contribution of TIMPs to the majority of cancer hallmarks, and human cancers invariably have shown TIMP deregulation in the tumor or stroma (Jackson et al., 2017). Previous studies reported that the characteristic of human neural stem cells (hNSCs) migration towards intracranial glioma is regulated by the TIMP1 (Lee et al., 2014). Moreover, researchers have shown that both serum TIMP1 level and TIMP1 mRNA expression of glioma tissue in GBM patients were significantly higher than grade II/III patients (Sreekanthreddy et al., 2010; Xu et al., 2019), and serum angiogenic profile in GBM patients identified that the serum TIMP-1 level as an independent predictor of survival (Crocker et al., 2011). The overall relationship of high TIMP1 expression with poor cancer outcome has been demonstrated in gliomas (Aaberg-Jessen et al., 2009). Consistent with previous studies, our results shown that TIMP1 high expression was also independent poor predictor for OS. Additionally, we also found that methylation of TIMP1 were highly negatively correlated with its gene expression and hyper-methylation of TIMP1 indicated better OS and RFS. Collectively, these results suggested that TIMP1 may be an important biomarker in glioma patient fluids and target for designing therapy. Thus, further studies should be performed to establish the exact mechanisms of TIMP1 in the tumor microenvironment and its pro-tumorigenic function in gliomas. TIMP1 mainly participants in the processes of extracellular matrix disassembly and organization (Soini et al., 2001). Further experiments are needed to explore the precise role of TIMP1 in glioma progression, and the potential application for the novel treatment of LGGs.
Previous evidences indicated that dysregulation of F-box protein-mediated ubiquitylation has been implicated in cancer and other diseases (Duan et al., 2012; Frescas & Pagano, 2008). In this study, we also found that FBXO17 high expression indicated LGGs patients with worse survival. Moreover, our results shown that hyper-methylation of FBXO17 was statistical significantly association with lower expression and better prognosis in LGGs (Fig. S1 ). In addition, it has been reported that EMP3 high expression is associated with a worse prognostic significance in OS in glioma patients (Gao et al., 2016; Zeng et al., 2018). Consistent with previous studies, our study also supported an oncogenic role on the part of EMP3 in glioma.
IDH1/2 mutations are clearly important prognostic markers in gliomas (Sanson et al., 2009; Weller et al., 2009; Yan et al., 2009). In LGGs, patients with IDH1/2 mutation have better prognosis than patients with IDH wild-type (Lu et al., 2012). In anaplastic oligodendroglial tumors, IDH1 mutation are prognostic for overall survival but not predictive for outcome to PCV chemotherapy (Van den Bent et al., 2010). In this study, we analyzed the prognostic value of IDH mutation for LGG patients using CGGA LGG dataset and found that there was no significant difference in overall survival between IDH mutation and IDH wild-type patients, which may be caused by the unbalanced distribution of 1p/19q co-deletion, MGMT methylation and the TCGA molecular subtypes. Therefore, it is a limitation that we did not compare the prognostic value of the proposed markers (SERPINA5 and TIMP1) with the previously recommended or currently used marker IDH1.
Conclusions
In this study, we identified SERPINA5 and TIMP1 as prognostic predict markers in LGGs, and the methylation of these genes is correlated with the survival of LGG patients. Our research indicated that both genes expression strongly correlated with methylation level are more likely to be associated with cancer outcomes. In addition, the present study firstly revealed that SERPINA5 hypo-methylation was negatively correlated with its expression, and both hypo-methylation and high expression of SERPINA5 predict poor survival in LGGs.
Supplemental Information
Methylation of FBXO17 CpG sites is associated with its expression and survival of LGGs patients
(A–C) Kaplan–Meier plot for survival between patients with high level and low level of FBXO17 expression in TCGA LGG and CGGA LGG dataset. (D) DNA methylation of FBXO17 CpG sites correlates with its gene expression in TCGA LGG dataset. (E, F) Methylation of FBXO17 CpG sites is associated with survival of LGGs patients in TCGA LGG dataset