Genetic diversity of Alternaria species associated with black point in wheat grains
- Published
- Accepted
- Received
- Academic Editor
- Tatiana Tatarinova
- Subject Areas
- Agricultural Science, Biodiversity, Genetics, Mycology
- Keywords
- Alternaria, Fungi, Molecular marker, Genetic diversity, Retrotransposon
- Copyright
- © 2020 Turzhanova et al.
- Licence
- This is an open access article distributed under the terms of the Creative Commons Attribution License, which permits unrestricted use, distribution, reproduction and adaptation in any medium and for any purpose provided that it is properly attributed. For attribution, the original author(s), title, publication source (PeerJ) and either DOI or URL of the article must be cited.
- Cite this article
- 2020. Genetic diversity of Alternaria species associated with black point in wheat grains. PeerJ 8:e9097 https://doi.org/10.7717/peerj.9097
Abstract
The genus Alternaria is a widely distributed major plant pathogen that can act as a saprophyte in plant debris. Fungi of this genus frequently infect cereal crops and cause such diseases as black point and wheat leaf blight, which decrease the yield and quality of cereal products. A total of 25 Alternaria sp. isolates were collected from germ grains of various wheat cultivars from different geographic regions in Kazakhstan. We investigated the genetic relationships of the main Alternaria species related to black point disease of wheat in Kazakhstan, using the inter-primer binding site (iPBS) DNA profiling technique. We used 25 retrotransposon-based iPBS primers to identify the differences among and within Alternaria species populations, and analyzed the variation using clustering (UPGMA) and statistical approaches (AMOVA). Isolates of Alternaria species clustered into two main genetic groups, with species of A.alternata and A.tennuissima forming one cluster, and isolates of A. infectoria forming another. The genetic diversity found using retrotransposon profiles was strongly correlated with geographic data. Overall, the iPBS fingerprinting technique is highly informative and useful for the evaluation of genetic diversity and relationships of Alternaria species.
Introduction
Kazakhstan is an important bread wheat exporter due to the exceptional grain quality and high protein content of wheat crops. Spring wheat is the main export crop in Kazakhstan, grown on approximately 14.3 million ha (FAO, 2013), most of which is concentrated in North Kazakhstan. In this region, climatic conditions favor the development of pathogenic microorganisms in wheat crops, reducing the productivity and quality of grain (https://stat.gov.kz/) (Fehér et al., 2017).
The genus Alternaria is widely distributed, and can act as both a saprophyte in plant debris and a plant pathogen (Lawrence et al., 2013). Fungi of the genus Alternaria commonly infect cereal crops and cause diseases such as black point and wheat leaf blight, which decrease the yield and quality of cereal products (Woudenberg et al., 2015). Specifically, deterioration of cereal products is caused by mycotoxins produced by Alternaria fungi, which can have carcinogenic and allergic effects (Pinto & Patriarca, 2017; Somma et al., 2019; Tralamazza et al., 2018; Wenderoth et al., 2019). Successful breeding work on resistance to fungal diseases requires knowledge of their genetic variability in each ecological region (Xu, 2016). However, precise taxonomic identification poses a substantial challenge, especially for the Alternaria genus, which exhibits significant variability in its cultural and morphological characteristics (Shamim et al., 2017). Nevertheless, this remains an important issue to address, as Alternaria spp. were found to predominate the mycobiota in wheat from North Kazakhstan’s main wheat-producing area (Gannibal, Klemsdal & Levitin, 2007).
A number of different techniques are currently available to identify genetic differences between organisms and perform comparative analyses based on genomic DNA. One of the most common methods to study the genetic diversity of Alternaria is polymorphism analysis of internal transcribed (ITS) and intergenic spacer (IGS) regions of ribosomal DNA (Andersen et al., 2009; Ozer & Bayraktar, 2018). Another class of molecular tools to measure genetic diversity is molecular markers such as RAPD (Random Amplified Polymorphic DNA) (Williams et al., 1990), AFLP (Amplified Fragment Length Polymorphism) (Vos et al., 1995), ISSR (Inter-Simple Sequence Repeat) (Sivolap, Kalendar & Chebotar, 1994; Zietkiewicz, Rafalski & Labuda, 1994), or SSR (Simple Sequence Repeat). Molecular markers have become enormously important because they enable the quantification of genetic diversity, measure inbreeding, characterize new species, taxonomy, and evolutionary origin. However, each type of marker comes with disadvantages including time/labor requirements, cost, speed, effectivity, genome coverage, and degree of polymorphism detection. For example, RAPD is an inexpensive and time-effective technique used to analyze genomic polymorphism among related organisms (Williams et al., 1990). However, this method is sensitive when the PCR conditions change due to mismatches between primer and template, and mismatches can lead to inefficient amplification of targeted regions of DNA template. The ISSR technique is an extended version of the RAPD technique, which retains the same positive and sensitive features as RAPD (Zietkiewicz, Rafalski & Labuda, 1994). RAPD and ISSR are the most common DNA-based techniques that provide highly discriminating information with relatively good reproducibility. Similarly, AFLP analysis has the capability to detect various polymorphisms in different genomic regions simultaneously. However, AFLP is a more complex—and hence time-consuming—method. It involves several steps, including two PCR rounds and restriction-ligation with an adaptor. The AFLP protocol is critically dependent on DNA quality, but is capable of revealing numerous polymorphic bands with just a few primer combinations.
In addition to these DNA profiling methods for investigating genetic variation in fungi, using multicopy and genomic abundance of retrotransposons can extend knowledge of phylogenetic relationships and estimate genetic diversity (Hosid et al., 2012; Kalendar, Amenov & Daniyarov, 2019; Kalendar & Schulman, 2014; Kalendar et al., 2017). Retrotransposon-based DNA profiling applications offer a simple, cost-effective (Gribbon et al., 1999; Kalendar et al., 2011; Kalendar & Schulman, 2006) and highly reproducible way to study genetic polymorphisms. These beneficial features are based on the fact that retrotransposons (in particular, Long Terminal Repeat (LTR) retrotransposons) are distributed throughout the genome and are involved in recombination events that occur during meiosis (Belyayev et al., 2010; Hosid et al., 2012; Schulman & Kalendar, 2005; Vicient et al., 2001; Vicient, Kalendar & Schulman, 2005). Transcriptionally active retrotransposons also play an important role in gene regulation and adaptation to ecological stress, because their activity is induced by stressful environmental conditions (Vicient et al., 2001).
According to the concept of “two-speed” genomes, phytopathogenic fungi potentially cause multiple gene rearrangements produced by retrotransposons. As many plant pathogenic fungi have genomes expanded by retrotransposon insertions, the hypothesis that “bigger can be better” was proposed as a mechanism of antagonistic co-evolution with a host (Raffaele & Kamoun, 2012). Ultimately this promotes rapid evolution of pathogenic microorganisms. The “two-speed” genome concept highlights compartmentalization into repeat-dense regions with higher recombination rates, and gene-dense regions that remains fairly conserved over evolutionary time. The “two-speed” genome hypothesis explains the independence of genes encoding essential housekeeping functions in the core genome, while allowing novel genes to evolve in the accessory genome (Dodds, 2010; Dong, Raffaele & Kamoun, 2015). These findings have led to the “two-speed genome” model in which endogenous fungi genomes have a bipartite architecture with gene-sparse, retrotransposon-rich elements that are thought to contribute to the potential to rapidly evolve virulence.
LTR retrotransposon sequences are commonly used to identify the molecular genetic polymorphism within lines and varieties of plant and animal breeds. Specifically, PCR methods based on detection of transposable element insertion site polymorphisms include Inter-retrotransposon amplified polymorphism (IRAP) (Kalendar et al., 1999), REtrotransposon-Microsatellite Amplified Polymorphism (REMAP) and Sequence-Specific Amplification Polymorphism (SSAP) (Waugh et al., 1997). However, DNA profiling applications based on retrotransposons are limited by a paucity of knowledge about nucleotide sequences of LTR retrotransposons in species without a sequenced genome. In particular, phytopathogenic fungi have a small genome, so the development of genetic markers based on retrotransposons is difficult relative to species with a large genome (e.g., green plants and animals; Mandoulakani et al., 2015; Doungous et al., 2015; Ghonaim et al., 2020; Leigh et al., 2003; Li et al., 2020; Teo et al., 2005; Vukich et al., 2009; Vuorinen et al., 2018). However, the Inter-primer Binding Site (iPBS) amplification technique has proved to be a powerful DNA fingerprinting method that does not require information about retrotransposon sequences (Kalendar et al., 2010). Both retroviruses and LTR retrotransposons use cellular transfer RNAs (tRNAs) as primer molecular to guide the reverse transcription of retrotransposons during their replication cycles. Primer tRNA is selectively packaged into the virion, where it is placed onto the primer binding site (PBS) of the viral RNA genome and the reverse transcriptase (RT)-catalyzed synthesis of minus-strand complementary DNA (cDNA). These LTR retrotransposons and all retroviruses contain a tRNA-conservative PBS, usually for methionine initiator tRNA (tRNAiMet).
In the case of retrotransposons, the PBS is either complementary to the 3′ end or to an internal region of the primer tRNA. The iPBS amplification method is based on the virtually universal presence of a tRNA complement as a PBS in LTR retrotransposons that utilize conserved PBS sequences as PCR primers for detection of polymorphism between different individuals, as well as polymorphism within transcription profiles (Monden, Yamaguchi & Tahara, 2014). This method can also be applied for quick cloning of unknown LTR segments from genomic DNA, and for species identification based on information about LTR retrotransposons. The effective iPBS method has been applied to a wide range of studies on plants and animals. The fact that most retrotransposons are nested, inverted, and truncated allows them to be easily amplified from nearly every organism using inverted PBS primers. Moreover, this method can be used as a universal and high-efficiency tool for direct detection of DNA polymorphism (Doungous et al., 2020; Milovanov et al., 2019). Primers that were developed for amplification of the conserved PBS regions showed their effectiveness in the cloning of LTR retrotransposons (Kalendar et al., 2010), including non-autonomous elements that did not contain protein-coding regions such as TRIM (Terminal Repeat Retrotransposons In Miniature) (Kalendar et al., 2008) and LARD (Large Retrotransposon Derivatives) (Kalendar et al., 2004).
Thus far, the application of the iPBS method for investigating the genetic diversity of fungal pathogens has been very limited (Borna et al., 2016; Ozer & Bayraktar, 2018; Özer, Bayraktar & Baloch, 2016; Šķipars et al., 2018; Wu et al., 2019). To date, retrotransposon sequences have been used to study the genetic diversity of only a few Alternaria species isolated from wheat seeds. However, the black point disease complex from wheat grains has numerous Alternaria species. No genetic diversity studies have been conducted on the most common species, including A. alternata, A. tenuissima, A. arborescens, and A. infectoria, using the transposable element insertion site polymorphism amplification method. Here, we investigated the genetic relationships of the main Alternaria species related to black point disease of wheat in Kazakhstan using the iPBS DNA profiling technique.
Material and Methods
Fungal materials and culture conditions
In total, 25 single-spore isolates of Alternaria sp. were collected from wheat grains of various wheat cultivars from different geographic regions in Kazakhstan (Table 1; Fig. 1). Two hundred seeds were arbitrarily selected from each wheat cultivars. The grains were surface-sterilized by shaking in 10% commercial bleach “Domestos” for 10 min and rinsed three times in sterile water for 1 min each time. Grains were then plated on Petri dishes of potato carrot agar and incubated for 7 days at 25 °C in the light. All isolates were identified based on morphological observation and sequencing of the ITS region. Morphological identification of Alternaria species was carried out according to Lawrence et al. (2013) and Lawrence, Rotondo & Gannibal (2015).
| Species | Sources in Kazakhstan | ID of isolate |
|---|---|---|
| Alternaria tenuissima | Akmola region | 2018009 |
| 2018124 | ||
| Aktobe region | 2018069 | |
| Karaganda region | 2018075 | |
| Alternaria infectoria | Akmola region | 2018062 |
| 2018067 | ||
| Kostanay region | 2018083 | |
| 2018128 | ||
| Almaty region | 2018061 | |
| Pavlodar region | 2018041 | |
| North Kazakhstan region | 2018056 | |
| Alternaria alternata | Akmola region | 2018013 |
| 2018037 | ||
| 2018085 | ||
| 2018123 | ||
| 2018130 | ||
| 2018131 | ||
| 2018133 | ||
| 2018134 | ||
| Almaty region | 2018088 | |
| 2018122 | ||
| North Kazakhstan | 2018137 | |
| 2018139 | ||
| Aktobe region | 2018132 | |
| Pavlodar region | 2018136 |
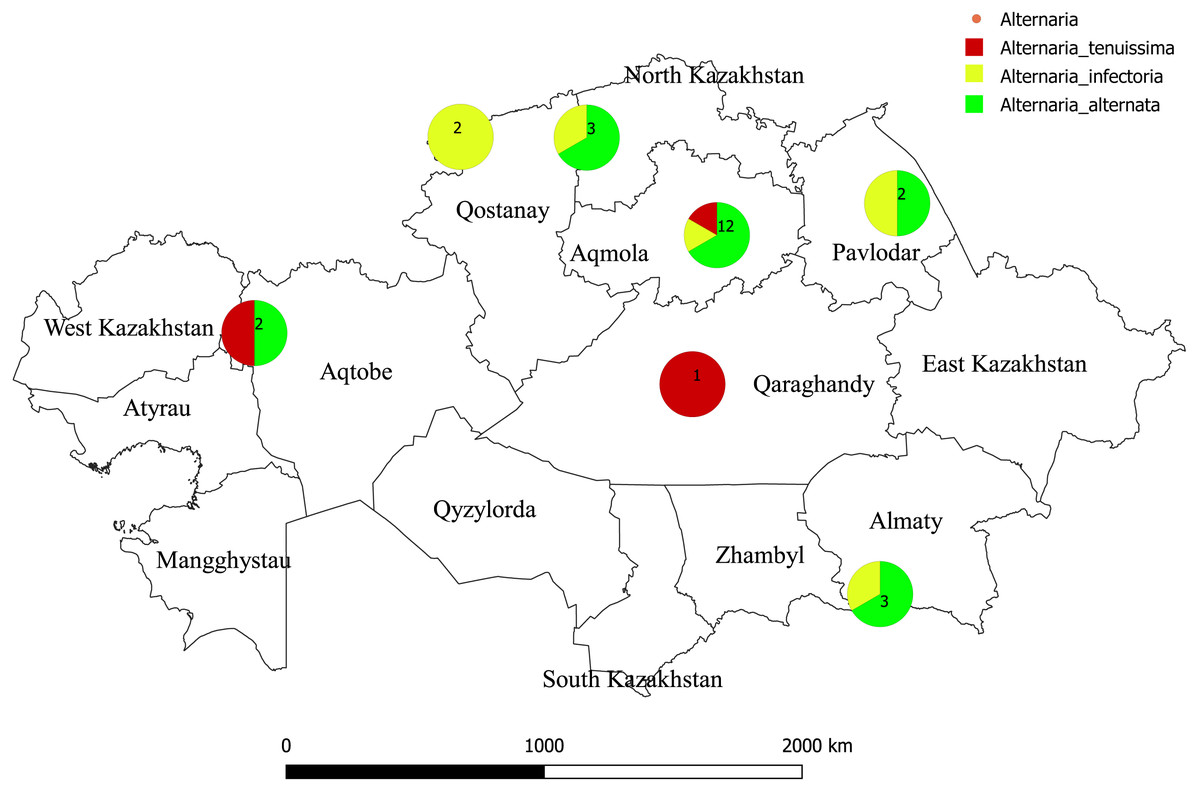
Figure 1: Map of Kazakhstan showing where isolates of Alternaria species were sampled.
The color reflects to species of Alternaria. Numbers refers to a total number of species isolated. The geographic location map was drawn using QGIS 3.10.0-GRASS (QGIS Geographic Information System. Open Source Geospatial Foundation) (https://www.qgis.org/en/site/).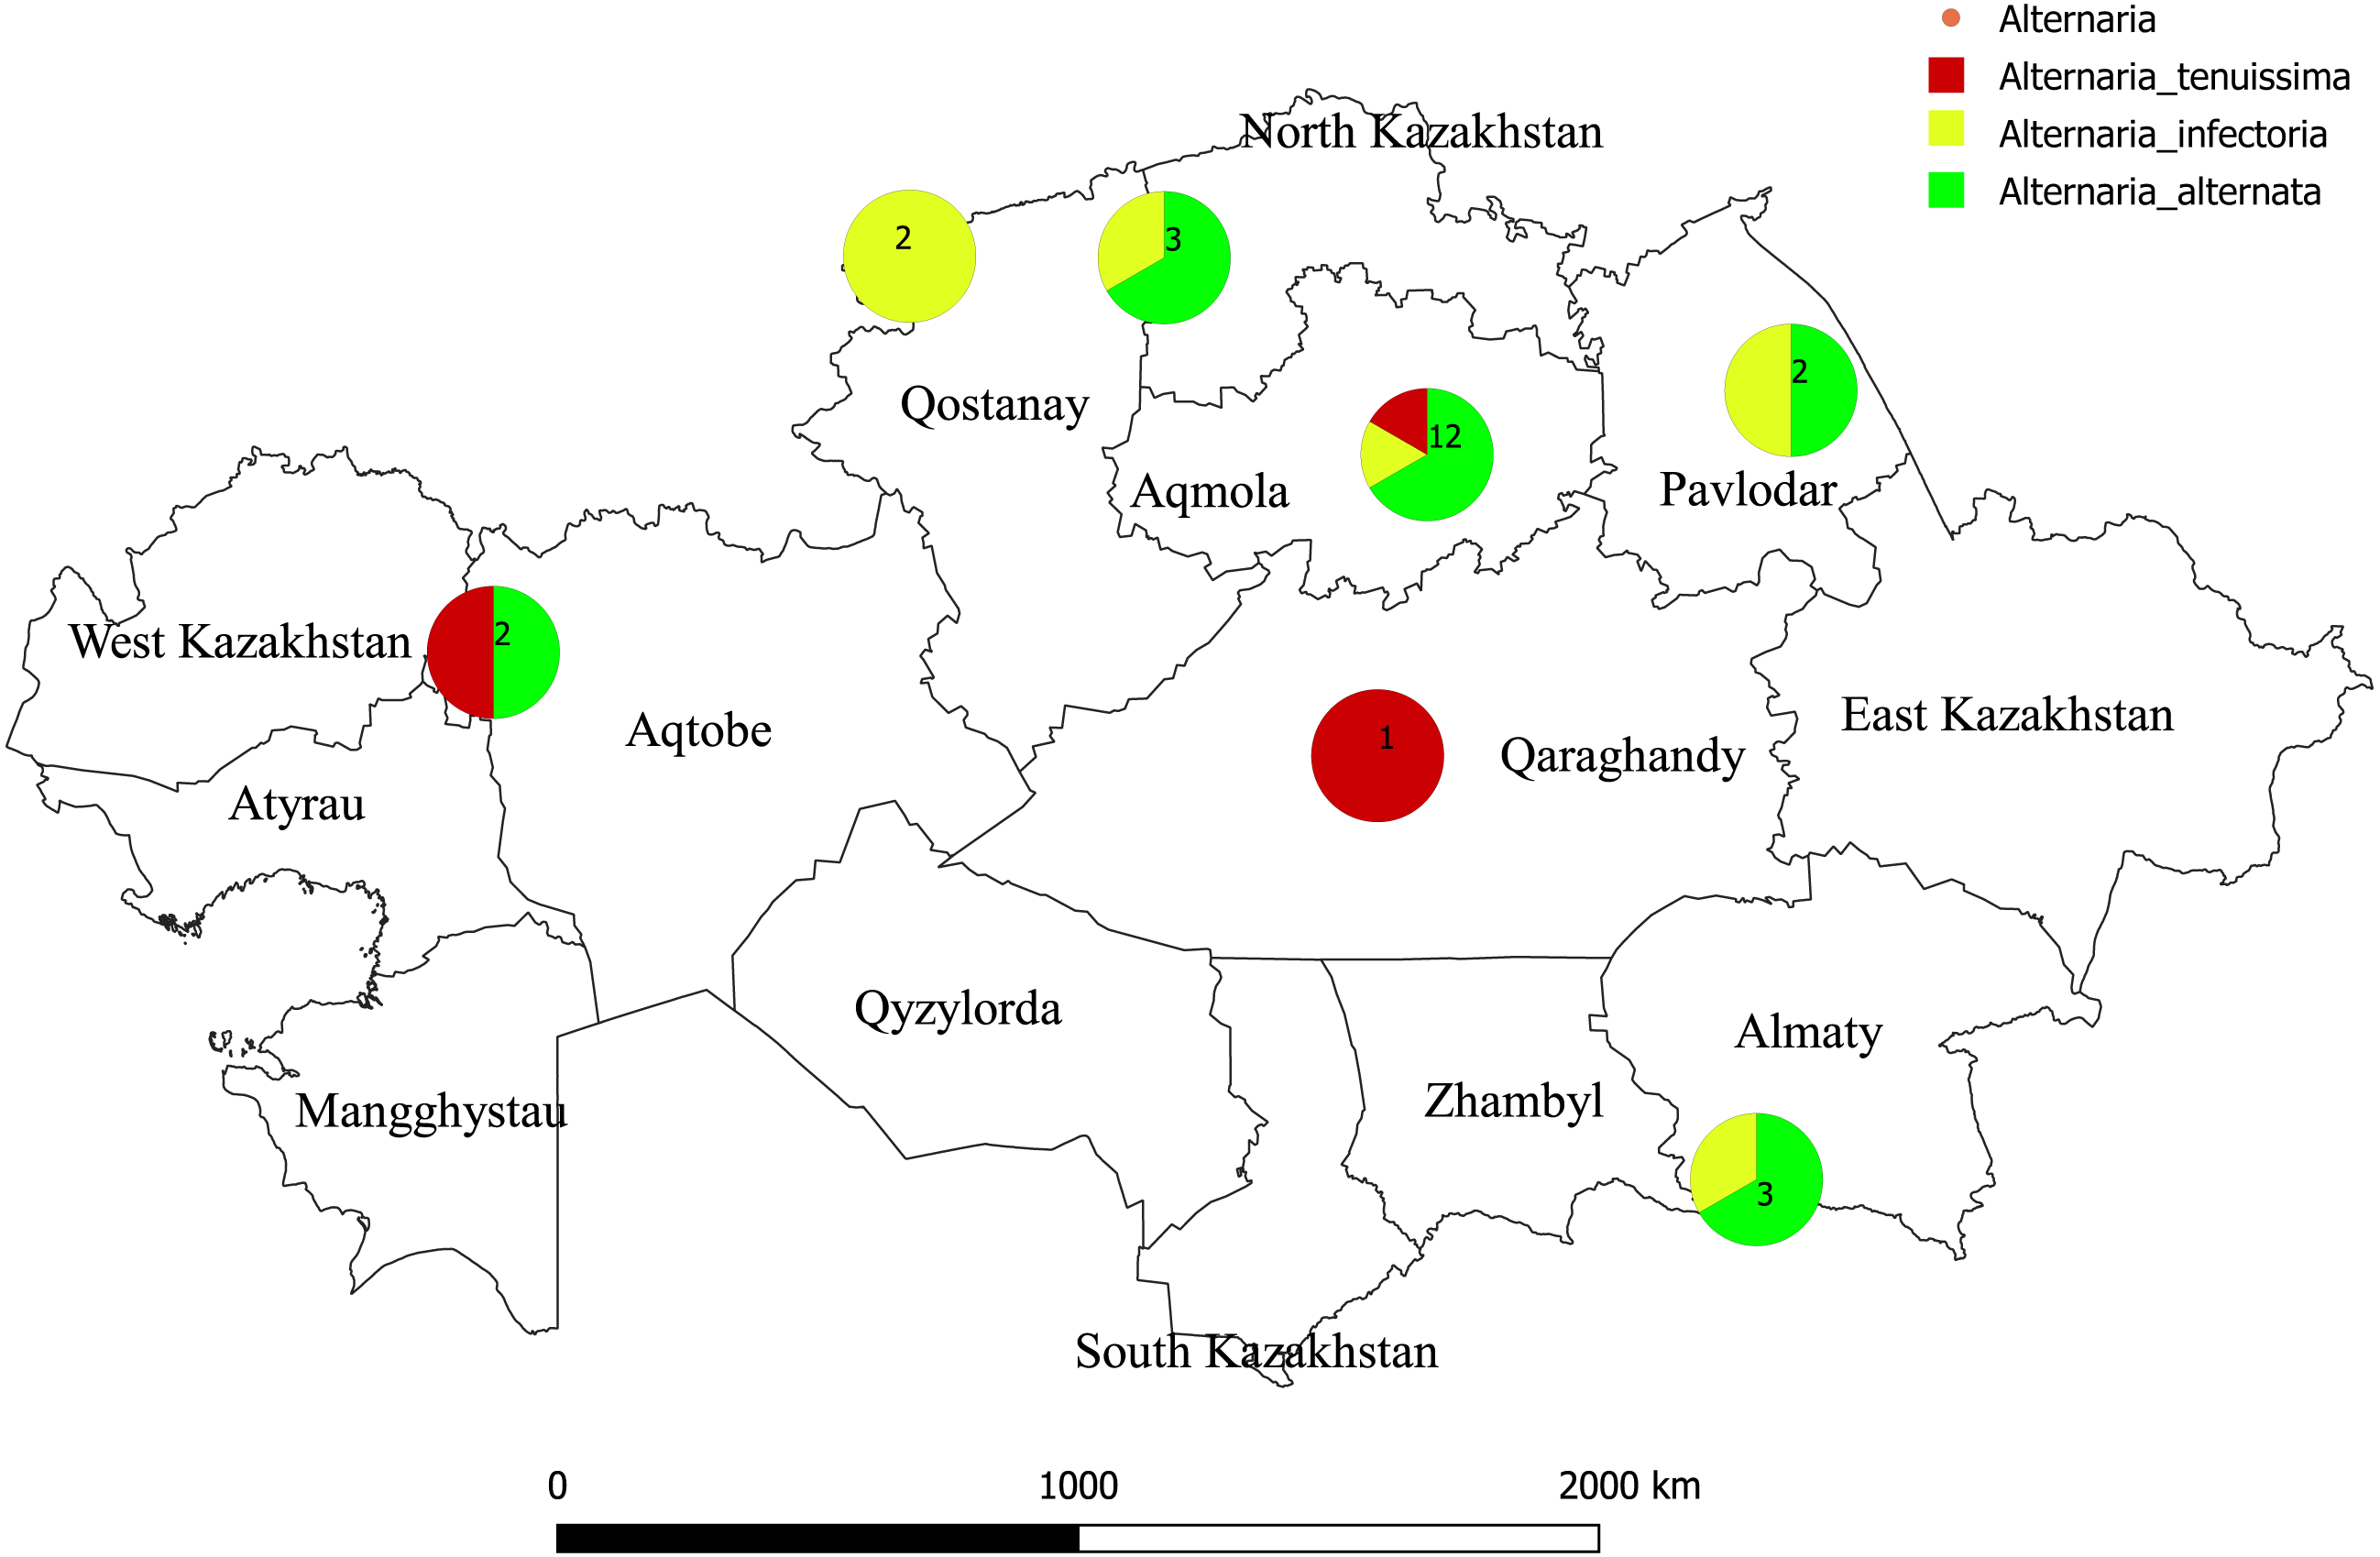
DNA extraction
Alternaria species isolates were grown in Petri dishes containing Chapek media without agar in darkness at 25 °C for one week. Mycelium was scraped with a sterile scalpel and collected into 2-ml tubes. Genomic DNA was extracted from fungal mycelia (50 mg) using modified CTAB extraction buffer (2%, 2M NaCl, 10 mM Na3EDTA, 100 mM HEPES, 5.3) with RNAse A treatment (http://primerdigital.com/dna.html). A detailed protocol for DNA isolation was followed as described in Kalendar et al. (2020). The DNA pellets were dissolved with 1 ×TE buffer (1 mM EDTA, 10 mM Tris-HCl, pH 8.0). The DNA quality was checked spectrophotometrically with a Nanodrop apparatus (Thermo Fisher Scientific Inc., Waltham, MA, USA) and also checked by 1% agarose gel, run at 90 V for 20 min.
PCR protocol for inter-primer binding sites
The genetic variability of Alternaria sp. isolates was analyzed by using 25 PBS primers designed by Kalendar et al. (2010). PCR reactions were performed in a 25 µl reaction mixture. Each reaction mixture contained 25 ng of template DNA, 1×Phire® Hot Start II PCR buffer with 1.5 mM MgCl2, 1 µM primer, 0.2 mM each dNTP, and 0.2 µl Phire® Hot Start II DNA polymerase (Thermo Fisher Scientific Inc.). PCR amplification was carried out in a Bio-Rad Thermal Cycler T100 under the following conditions: initial denaturation step at 98 °C for 1 min, followed by 30 amplifications at 98 °C for 5 s, at 50−60 °C (depending on primer sequence) for 20 s, and at 72 °C for 60 s, followed by a final extension of 72 °C for 3 min. All PCRs were repeated at least twice for each isolate. All PBS primers were tested to assess the genetic diversity of Alternaria isolates using iPBS amplification for DNA profiling. Primers that generated few PCR products were excluded. Primers with a weak profile or that produced mainly monomorphic amplification products were also excluded. PCR products were separated by electrophoresis at 70V for 8 h in 1.2% agarose gel with 1xTBE buffer. A Thermo Scientific (100–10,000 base pairs) GeneRuler DNA Ladder Mix (#SM0332) was used as a standard DNA ladder. The PCR products were visualized with a ChemiDoc-It2 Imaging System (UVP, LLC, Upland, CA, USA; Analytik Jena AG, Jena, Germany) and a PharosFX Plus Imaging System (Bio-Rad Laboratories Inc., Hercules, CA, USA) with a resolution of 50 µm, after staining with ethidium bromide. PBS primers generated in the PCR yielded clearly distinct amplification products, showing considerable variability among the isolates belonging to different Alternaria species.
Data scoring and analysis
Only clear scorable bands were used for studying genetic variability among the isolates of Alternaria sp. from wheat grains. Each band of a unique size was assumed to correspond to a unique locus. To construct a binary matrix, reproducible fragments were scored as present (1) or absent (0). GenAlex 6.5 (Peakall & Smouse, 2012) was used to calculate the total number of alleles, Shannon information index (I), genetic differentiation index (PhiPT) among populations, and the number of private alleles per population. Analysis of molecular variance (AMOVA) among and within populations was also calculated with GenAlex 6.5. A dendrogram was constructed using the UPGMA method in MEGA X software (Kumar et al., 2018).
Results
PCR amplicon polymorphisms
In the preliminary tests, all PBS primers were screened to evaluate their ability to produce clear banding profiles among the isolates. In total, 25 18-mer PBS primers were used (Kalendar et al., 2010). The amplification profile of the PBS primers presented a unique combination of reproducible and scorable bands ranging from 100 to 10,000 bp (Table 2). The iPBS fingerprinting pattern of the fungi genotypes from three primers (2221, 2237, 2242) are shown in Figs. 2–4. The number of amplified bands varied from 15 to 40. On average, each primer generated 20 bands in the profile, with an average of eight that were polymorphic. All PBS primers used for DNA amplification generated a total of 328 scorable reproducible bands (Table 2).
| Primer ID | Sequence (5′- 3′) | Tm∘ Ca | TL | PL | PPL (%) | PIC | Range of amplicons (bp) |
|---|---|---|---|---|---|---|---|
| 2242 | GCCCCATGGTGGGCGCCA | 69.2 | 19 | 19 | 100 | 0.951 | 200–3,000 |
| 2221 | ACCTAGCTCACGATGCCA | 58.0 | 18 | 18 | 100 | 0.941 | 100–3,000 |
| 2237 | CCCCTACCTGGCGTGCCA | 65.0 | 16 | 16 | 100 | 0.924 | 100–3,000 |
| 2217 | ACTTGGATGTCGATACCA | 52.5 | 5 | 2 | 60 | 0.251 | 100–2,500 |
| 2245 | GAGGTGGCTCTTATACCA | 53.1 | 5 | 2 | 40 | 0.258 | 200–3,000 |
| 2253 | TCGAGGCTCTAGATACCA | 53.4 | 9 | 3 | 33 | 0.190 | 200–3,000 |
| 2232 | AGAGAGGCTCGGATACCA | 56.6 | 6 | 2 | 33 | 0.124 | 100-2.000 |
| 2225 | AGCATAGCTTTGATACCA | 50.5 | 10 | 3 | 30 | 0.122 | 300–3,000 |
| 2228 | CATTGGCTCTTGATACCA | 51.9 | 7 | 2 | 28 | 0.132 | 100–3,000 |
| 2251 | GAACAGGCGATGATACCA | 54.3 | 7 | 2 | 28 | 0.175 | 100–4.000 |
| 2249 | AACCGACCTCTGATACCA | 54.7 | 11 | 3 | 27 | 0.168 | 300–10,000 |
| 2220 | ACCTGGCTCATGATGCCA | 59.0 | 8 | 2 | 25 | 0.135 | 300–2,500 |
| 2246 | ACTAGGCTCTGTATACCA | 50.9 | 9 | 2 | 22 | 0.154 | 200–3,000 |
| 2219 | GAACTTATGCCGATACCA | 51.5 | 9 | 2 | 22 | 0.120 | 100–2,500 |
| 2395 | TCCCCAGCGGAGTCGCCA | 66.0 | 5 | 1 | 20 | 0.161 | 100–3,000 |
| 2230 | TCTAGGCGTCTGATACCA | 54.0 | 15 | 3 | 20 | 0.119 | 100–10,000 |
| 2398 | GAACCCTTGCCGATACCA | 57.1 | 16 | 3 | 18 | 0.118 | 400–2,500 |
| 2218 | CTCCAGCTCCGATTACCA | 56.1 | 6 | 1 | 16 | 0.115 | 200–4,000 |
| 2222 | ACTTGGATGCCGATACCA | 55.7 | 12 | 2 | 16 | 0.118 | 300–10,000 |
| 2226 | CGGTGACCTTTGATACCA | 54.2 | 12 | 2 | 16 | 0.114 | 200–3,000 |
| 2255 | GCGTGTGCTCTCATACCA | 57.1 | 13 | 2 | 15 | 0.113 | 100–3,000 |
| 2244 | GGAAGGCTCTGATTACCA | 53.7 | 20 | 3 | 15 | 0.117 | 100–3,000 |
| 2224 | ATCCTGGCAATGGAACCA | 56.6 | 14 | 2 | 14 | 0.117 | 100–10,000 |
| 2243 | AGTCAGGCTCTGTTACCA | 54.9 | 7 | 1 | 14 | 0.115 | 100–3,000 |
| 2229 | CGACCTGTTCTGATACCA | 53.5 | 9 | 1 | 11 | 0.112 | 300-2,500 |
Notes:
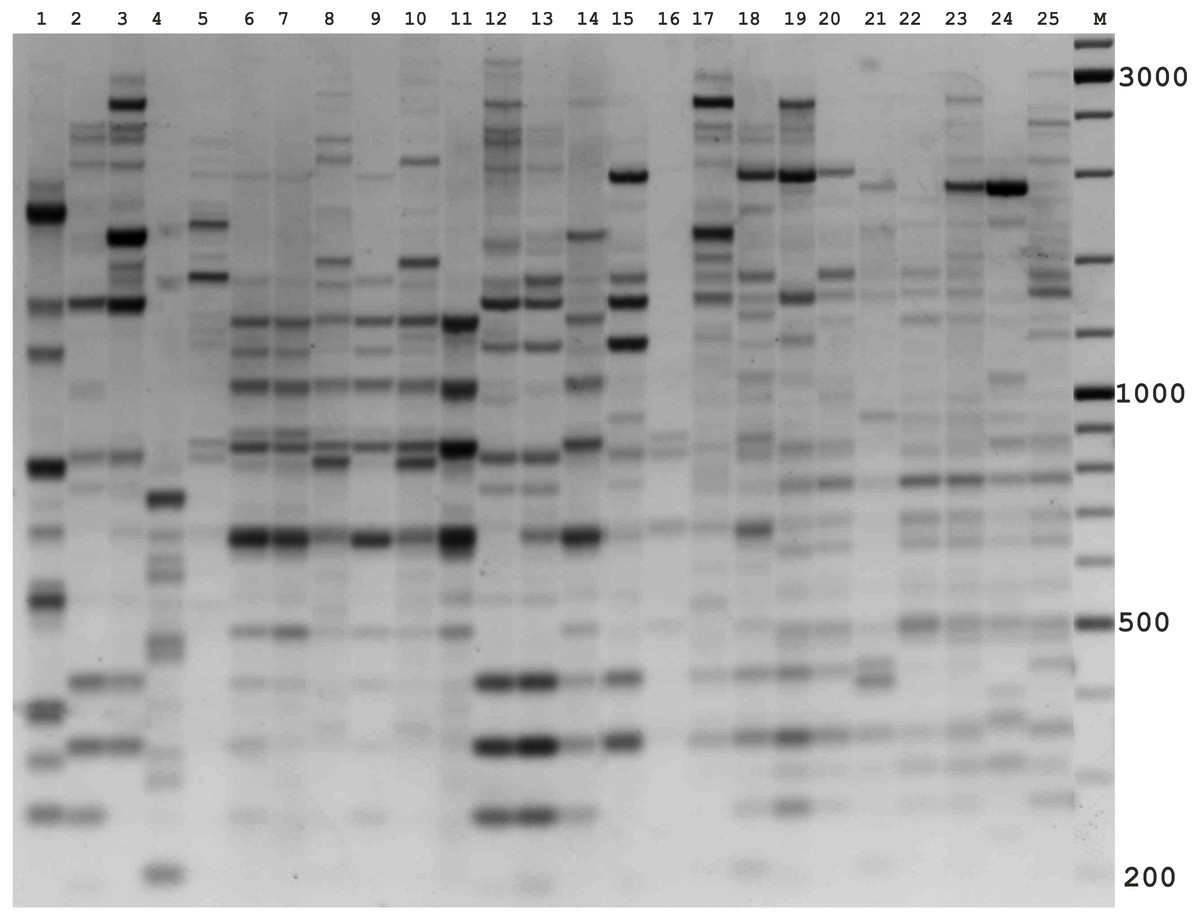
Figure 2: Electrophoretic analysis of PCR product from iPBS marker 2242.
Sample order (1–4 Alternaria tenuissima, 5-11 Alternaria infectoria, 12-25 Alternaria alternata) listed in Table 1. M-Thermo Scientific GeneRuler DNA Ladder Mix (100–10,000 bp).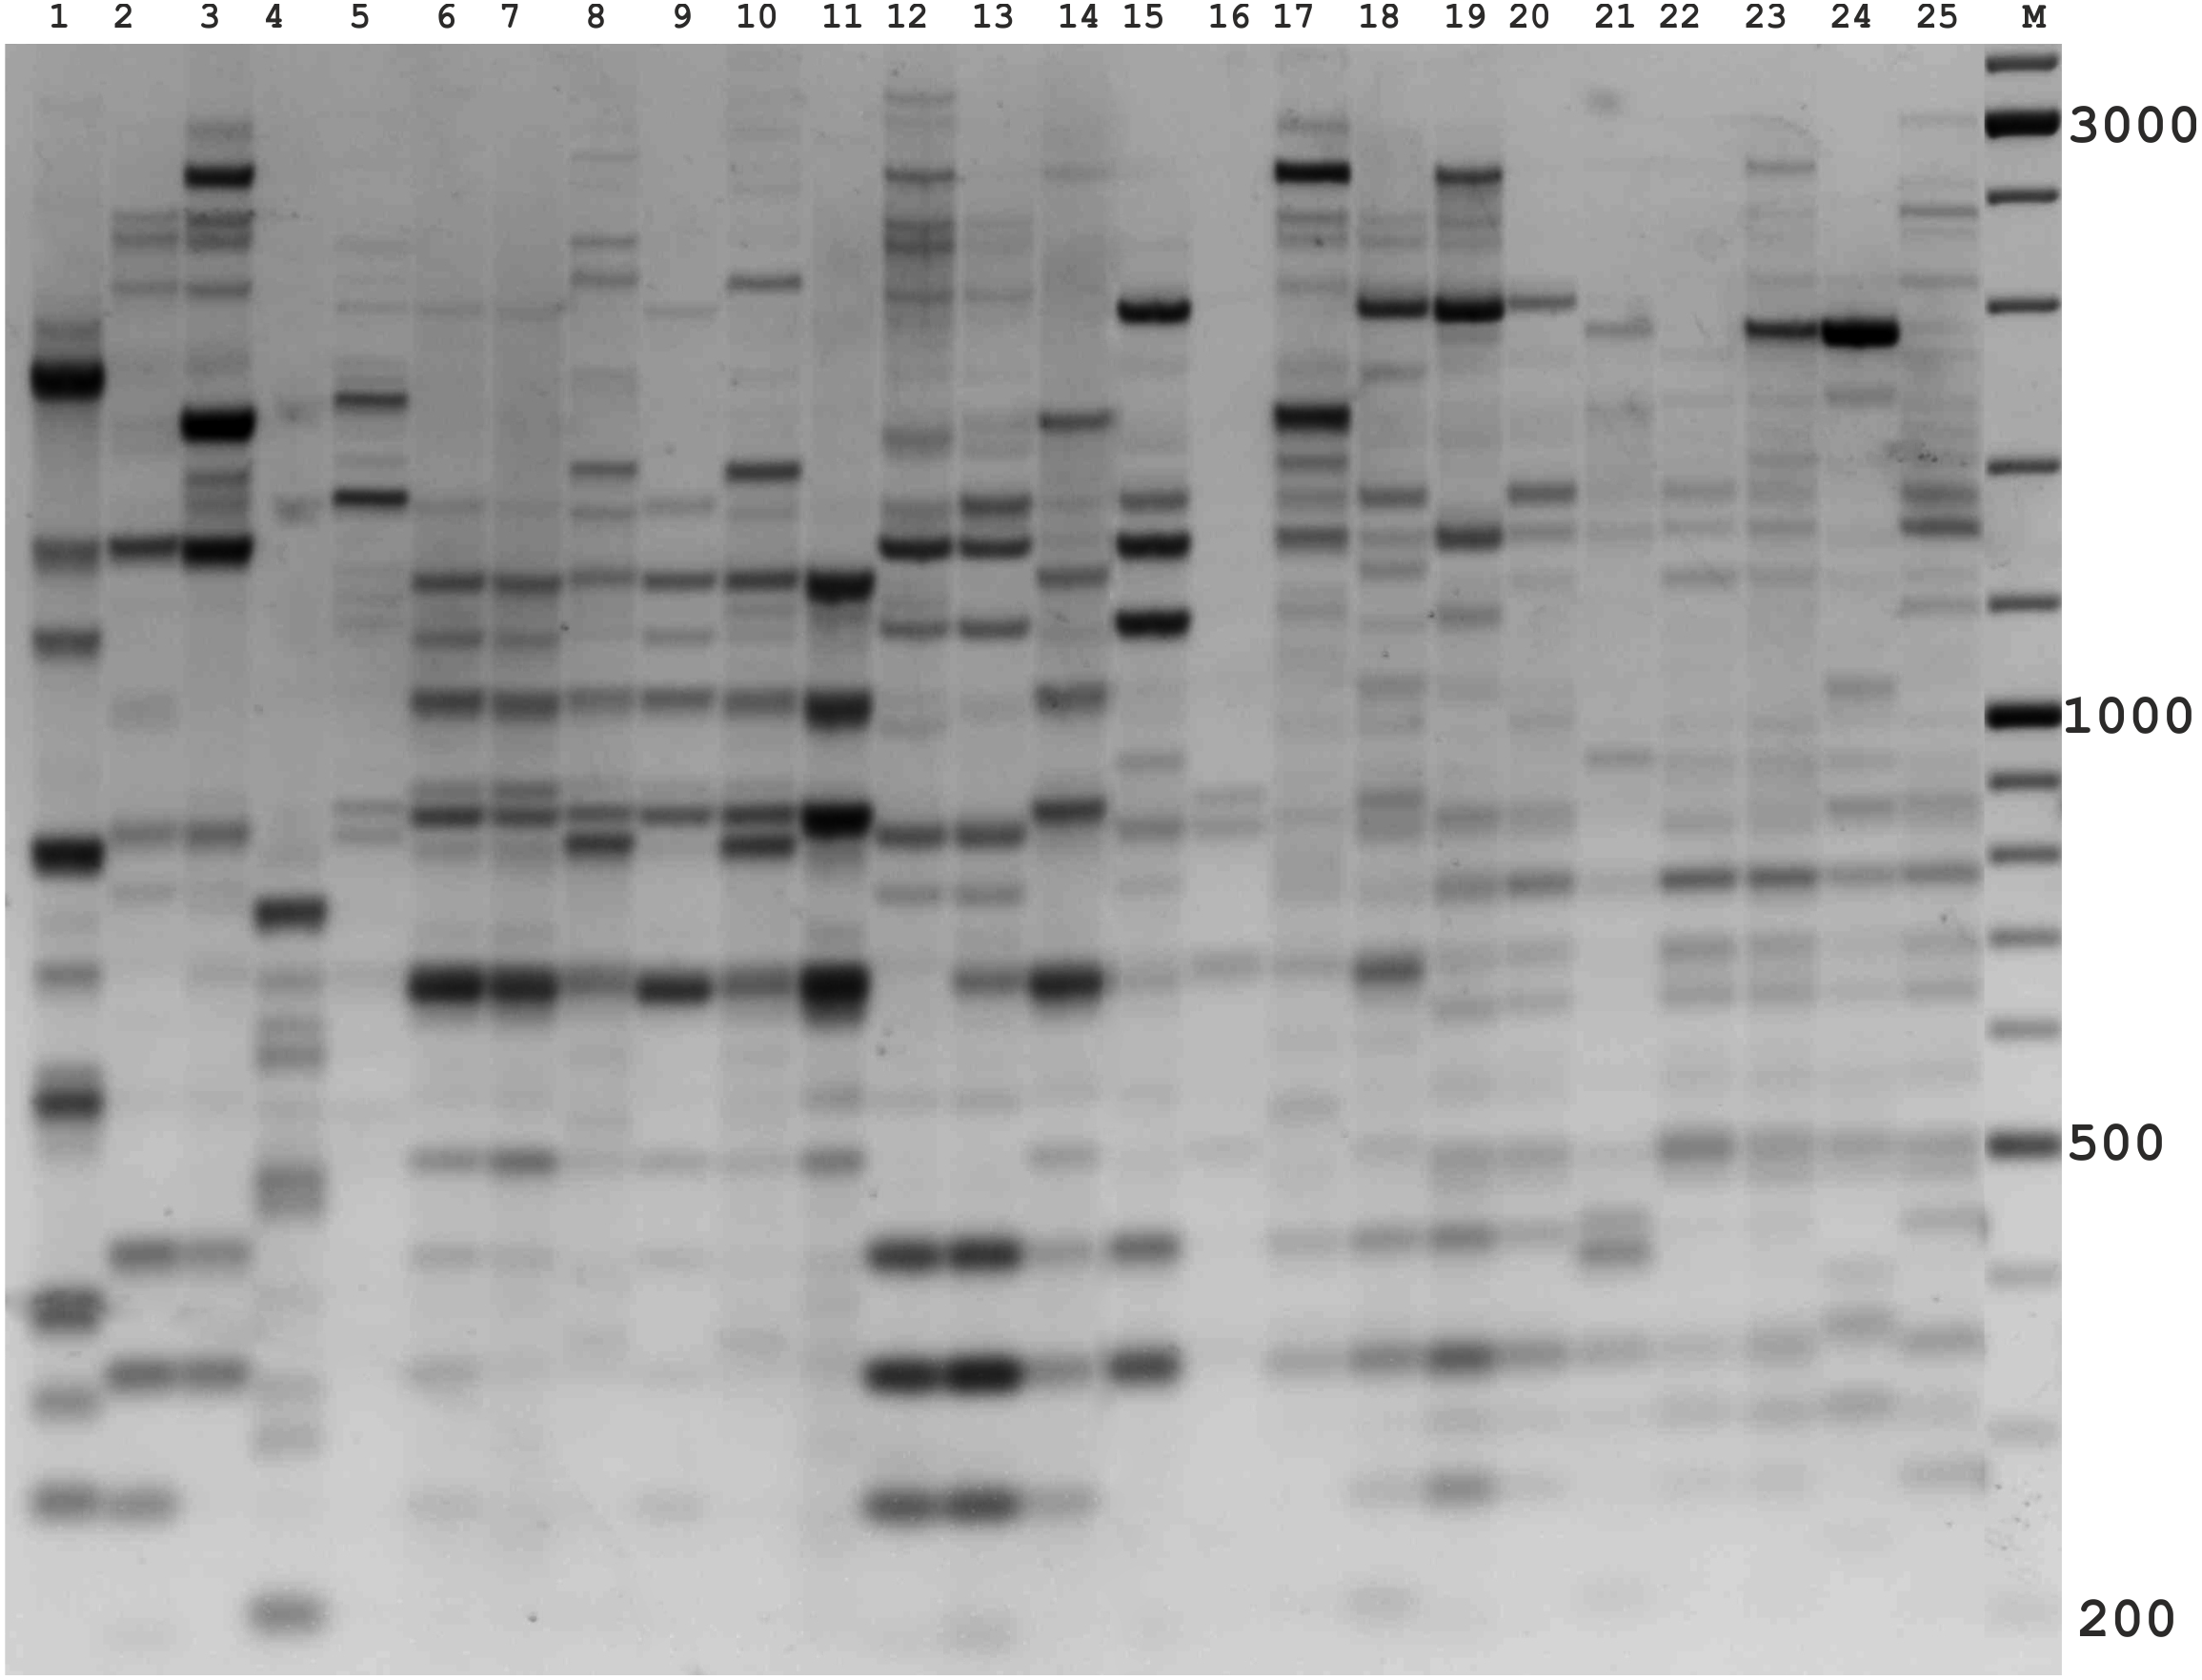

Figure 3: Electrophoretic analysis of PCR product from iPBS marker 2237.
Sample order (1-4 Alternaria tenuissima, 5-11 Alternaria infectoria, 12-25 Alternaria alternata) listed in Table 1. M-Thermo Scientific GeneRuler DNA Ladder Mix (100–10,000 bp).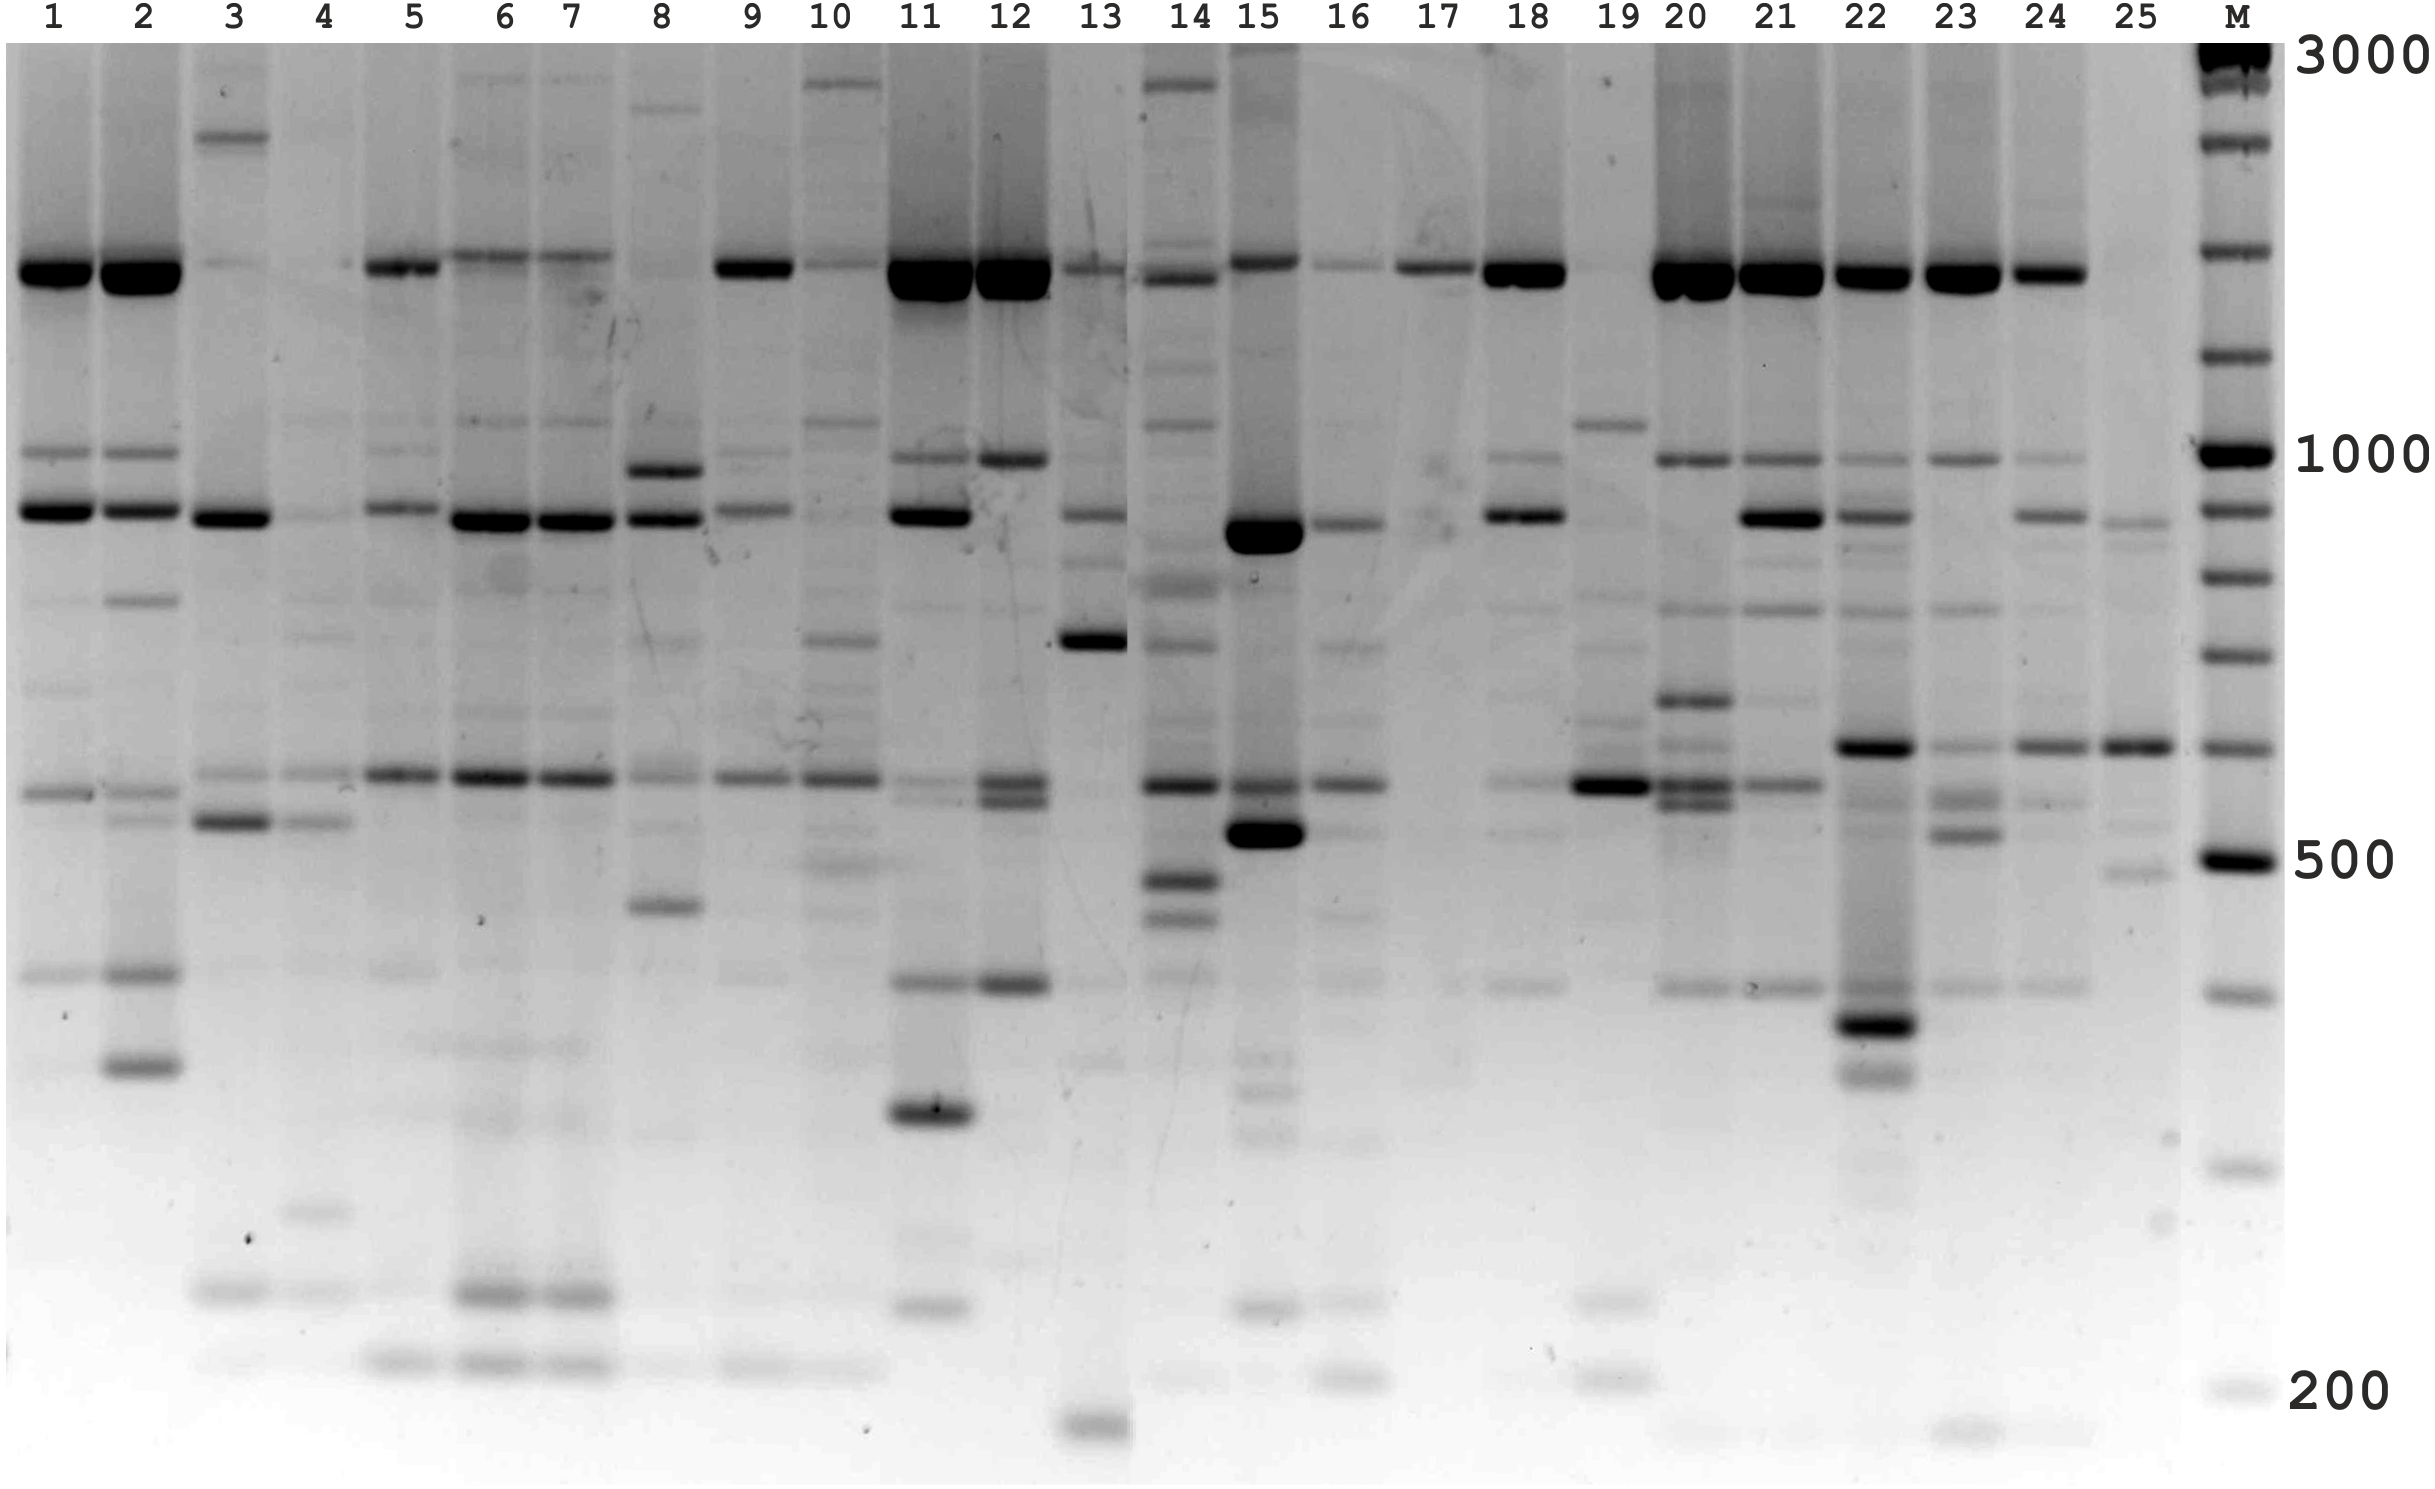
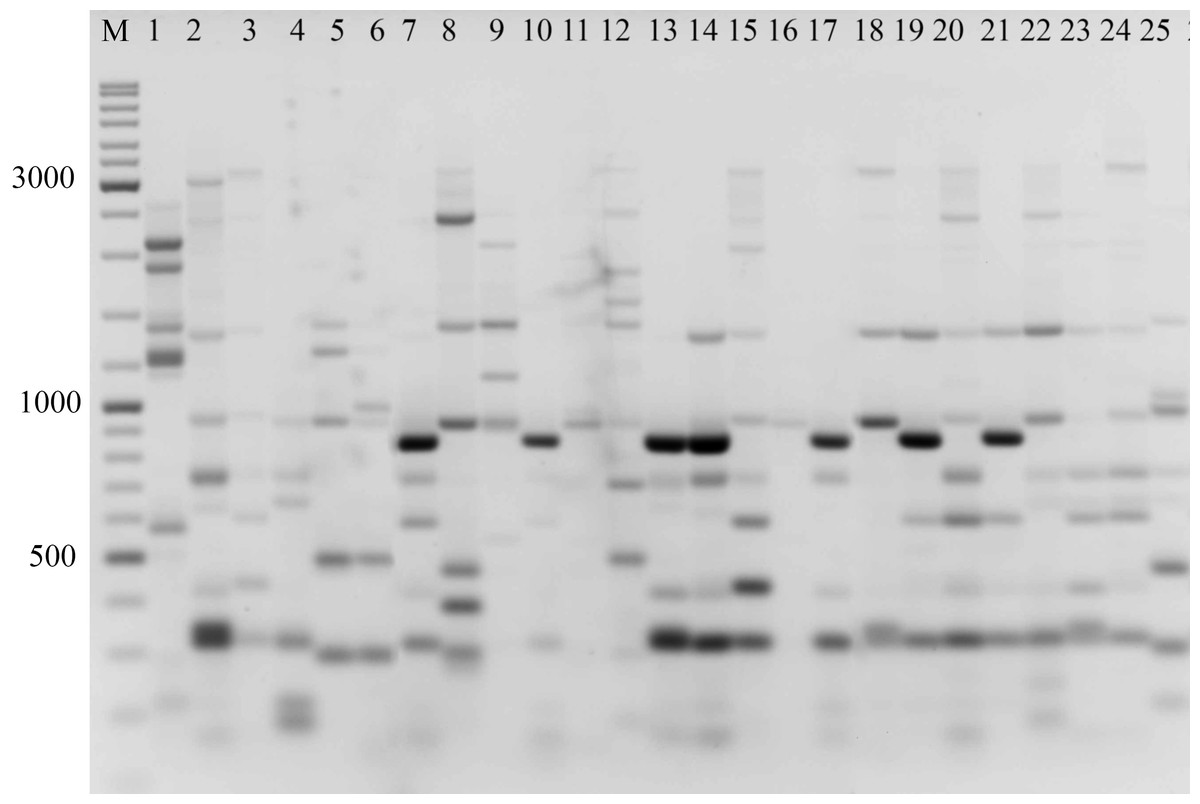
Figure 4: Electrophoretic analysis of PCR product from iPBS marker 2221 Sample order (1-4 Alternaria tenuissima, 5-11 Alternaria infectoria, 12-25 Alternaria alternata) listed in Table 1.
M-Thermo Scientific GeneRuler DNA Ladder Mix (100–10,000 bp).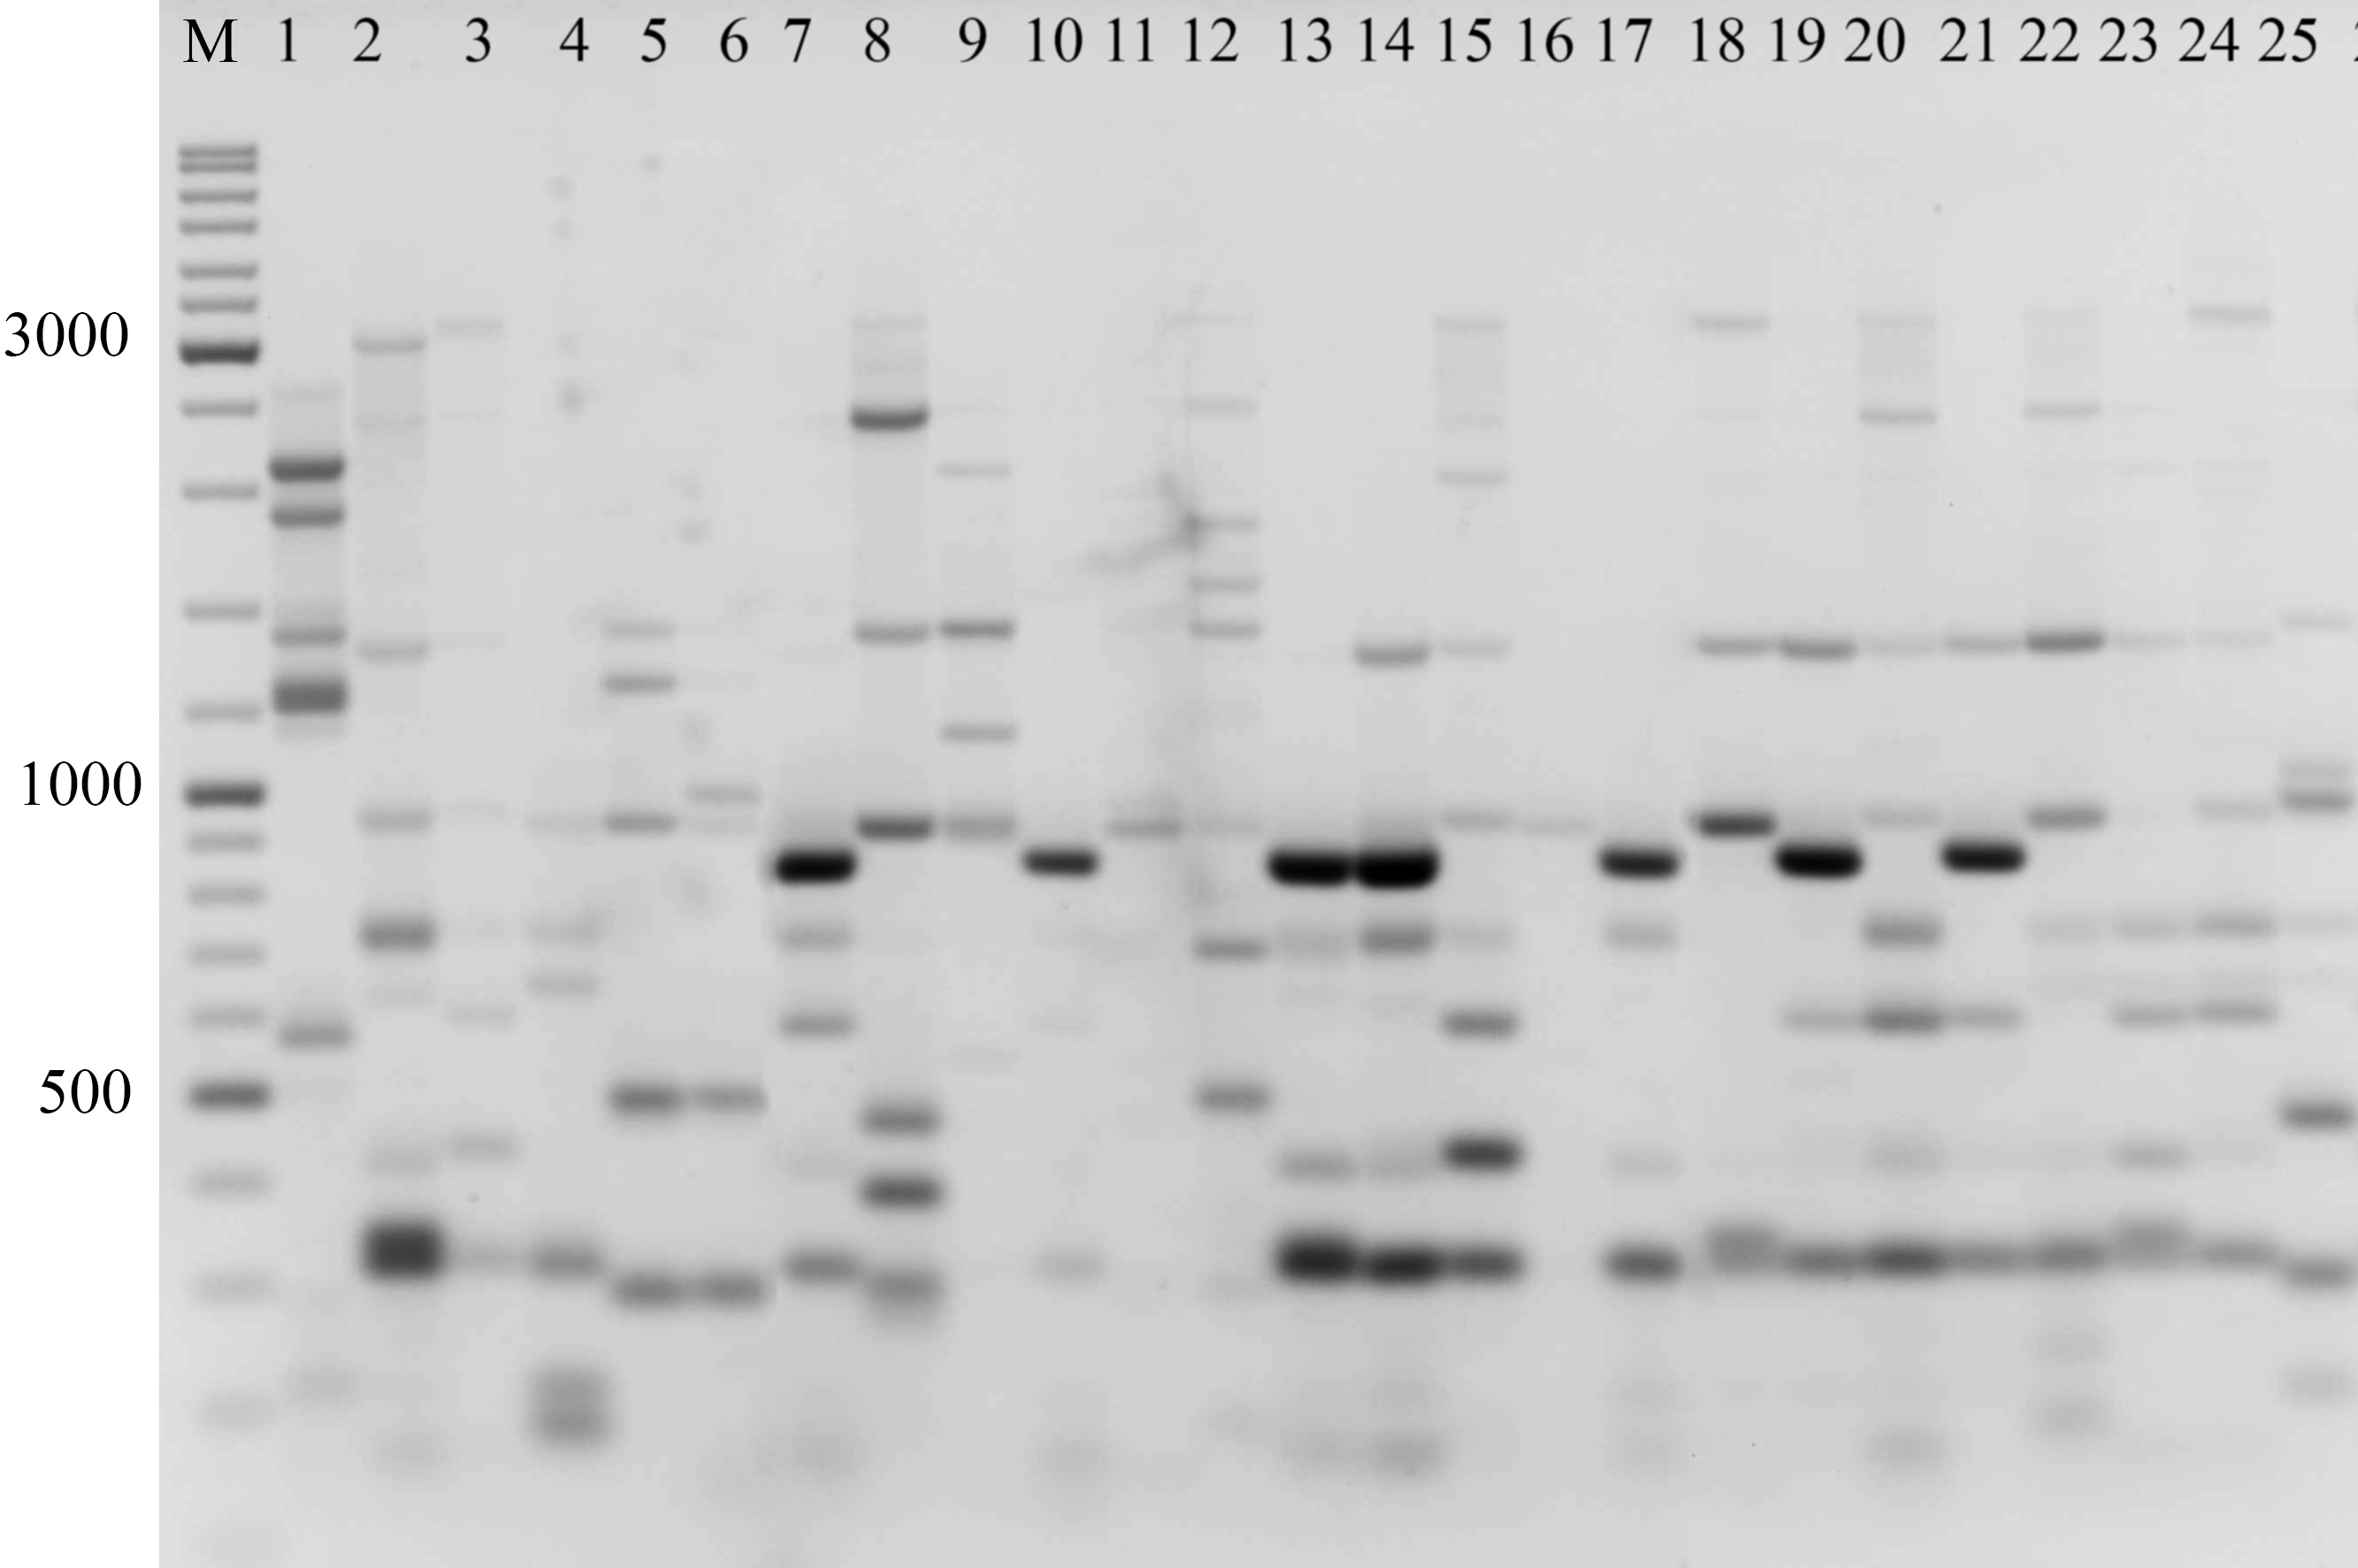
The amplification profiles for three PBS primers (2221, 2237, 2242) were extremely useful compared to the other PBS primers. Among these, primer 2242 showed the highest PIC index value. DNA profiling using PBS primers was highly efficient for isolates belonging to different types of Alternaria. The generated amplification products were significantly variable among isolates, both within and among species.
Genetic diversity among Alternaria sp.
In total, 25 PBS primers were used to analyze the polymorphism of 25 Alternaria isolates. Several PBS primers showed a high level of polymorphism and were used in further studies to investigate the genetic diversity of other fungal species. Primers with a weak profile or that produced mainly monomorphic amplification products were excluded.
Of the 328 amplified fragments, 228 (69%) were polymorphic (see Table 3 for genetic diversity statistics). The main diversity in the iPBS profile arose from Alternaria alternata isolates (160 polymorphic bands out of 198), which was the most abundant species among the isolates (15 out of 25). Notably, the level of detectable polymorphism detected in our study is lower than that reported in similar studies using the iPBS method on both plants (Doungous et al., 2015; Doungous et al., 2020) and other fungi species (Milovanov et al., 2019; Monden, Yamaguchi & Tahara, 2014; Teo et al., 2005; Vukich et al., 2009). The amplified PCR products ranged from 200 to 3000 bp and had on average 10-30 bands per isolate. The percent of polymorphic loci (PPL%) among Alternaria sp. were ranked in the following descending order: Alternaria alternata (80%), Alternaria tenuissima (59%), and Alternaria infectoria (47%).
| No | Species | NI | NTI | PPL (%) | PB | NPB |
|---|---|---|---|---|---|---|
| 1 | Alternaria alternate | 15 | 198 | 80.8% | 160 | 9 |
| 2 | Alternaria infectoria | 6 | 78 | 47.4% | 37 | 3 |
| 3 | Alternaria tenuissima | 4 | 52 | 59.6% | 31 | 4 |
| - | Total | 25 | 328 | 61.0% | 228 | 16 |
Notes:
- NI
-
number of isolates
- NTI
-
number of bands per genotype
- PPL%
-
percentage of polymorphic loci
- PB
-
number of polymorphic bands
- NPB
-
number of private bands
Analysis of molecular variance (AMOVA) was used to calculate the number of effective alleles per locus (Ne) based on three PBS primers (2221, 2237, 2242) (Table 4). Ne ranged from 1.189 (A. infection) to 1.310 (A. alternata). AMOVA revealed that 79% of the total variation was due to differences among isolates within populations, and the variation between populations reflected only 21% of the total variation. These results are also consistent with the low Shannon’s indices (0.198–0.315). The overall Shannon’s index (I = 0.266) suggests that more than 20% of the genetic diversity is explained by differences between isolates. Based on these results, we conclude that most of the genetic variation (79%) was distributed among isolates across the regions. It is worth mentioning that the fungal isolates are mostly similar at the genetic level despite long distances between different wheat growing zones in Kazakhstan.
| Source | df | SS | MS | Est. Var. | % | PhiPT | P |
|---|---|---|---|---|---|---|---|
| Among Pops | 2 | 38.333 | 19.167 | 1.771 | 21% | 0.206 | 0.001 |
| Within Pops | 22 | 150.467 | 6.839 | 6.839 | 79% | ||
| Total | 24 | 188.800 | 8.611 | 100% |
Notes:
- Df
-
degree of freedom
- SS
-
sum of squares
- MS
-
mean square
- Est. Var.
-
estimated variance
- PhiPT
-
genetic differentiation index among populations
The expected variation among groups was 1.771, while within groups it was 6.839, and 8.611 for the total. Hence, the genetic variance was mainly attributed to genetic diversity within groups. The genetic difference (PhiPT) between the three groups was high (0.206). GenAlex 6.5 software (Peakall & Smouse, 2012) was used to analyze iPBS profile data. The number of different alleles found within each population (Ne) and the number of effective alleles per locus were generally higher in the Alternaria alternata samples (Table 5). The PIC values ranged from 0.939 to 0.940, and all PBS loci were highly informative (0.5 < PIC < 0.25).
| Species | N | Na | Ne | I | He | uHe | PIC |
|---|---|---|---|---|---|---|---|
| Alternaria tenuissima | 4 | 1.113 | 1.304 | 0.284 | 0.187 | 0.214 | 0.940 |
| Alternaria infectoria | 6 | 1.038 | 1.189 | 0.198 | 0.123 | 0.135 | 0.940 |
| Alternaria alternata | 15 | 1.623 | 1.310 | 0.315 | 0.197 | 0.204 | 0.939 |
Notes:
- N
-
Number of isolates
- Na
-
number of alleles
- Ne
-
number of effective alleles per locus
- I
-
Shannon’s Information Index
- He
-
expected heterozygosity
- uHe
-
unexpected heterozygosity
Phylogenetic analysis showed that the iPBS markers were effective at grouping the 25 Alternaria isolates at the species level. The UPGMA dendrogram grouped all 25 isolates (which represented three populations) into two major clusters (Fig. 5). Among these, 18 and 7 isolates were grouped in clusters 1 and 2, respectively. Although half of the A. alternata isolates were collected from the Akmola region, their position in the dendrogram indicates similarity with isolates from other regions. Only two isolates from the Akmola region (137 and 139) were allocated to a separate sub-cluster and had some genetic similarities. Isolates of A. infectoria clearly formed a separate cluster. This species is also very different morphologically from A. alternata and A. tenuissima. Isolates of A. alternata and A. tenuissima were located in the same sub-cluster, although they are separated from each other.
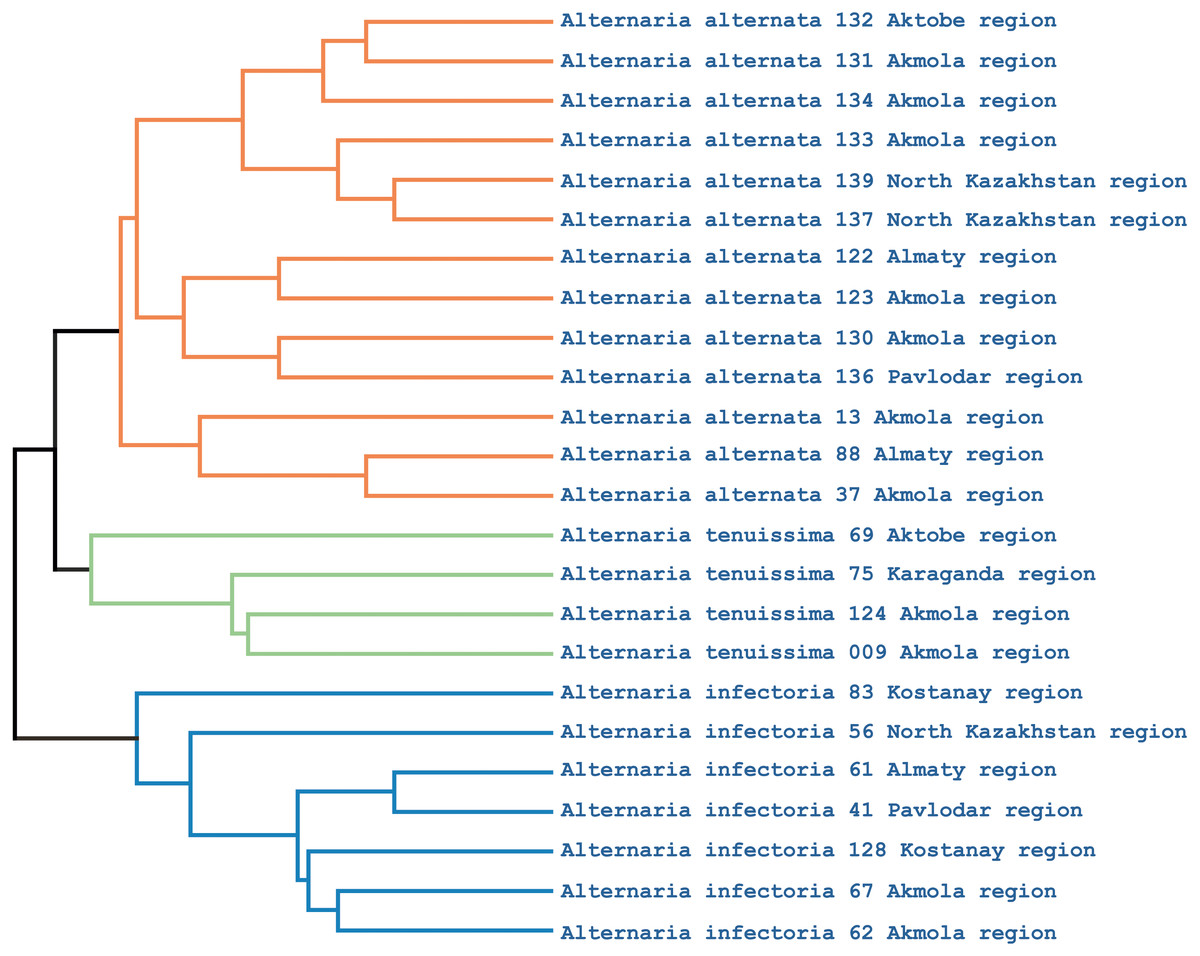
Figure 5: UPGMA dendrogram of 25 Alternaria isolates generated from three iPBS primers.
Isolates for each species are allocated in separate branches.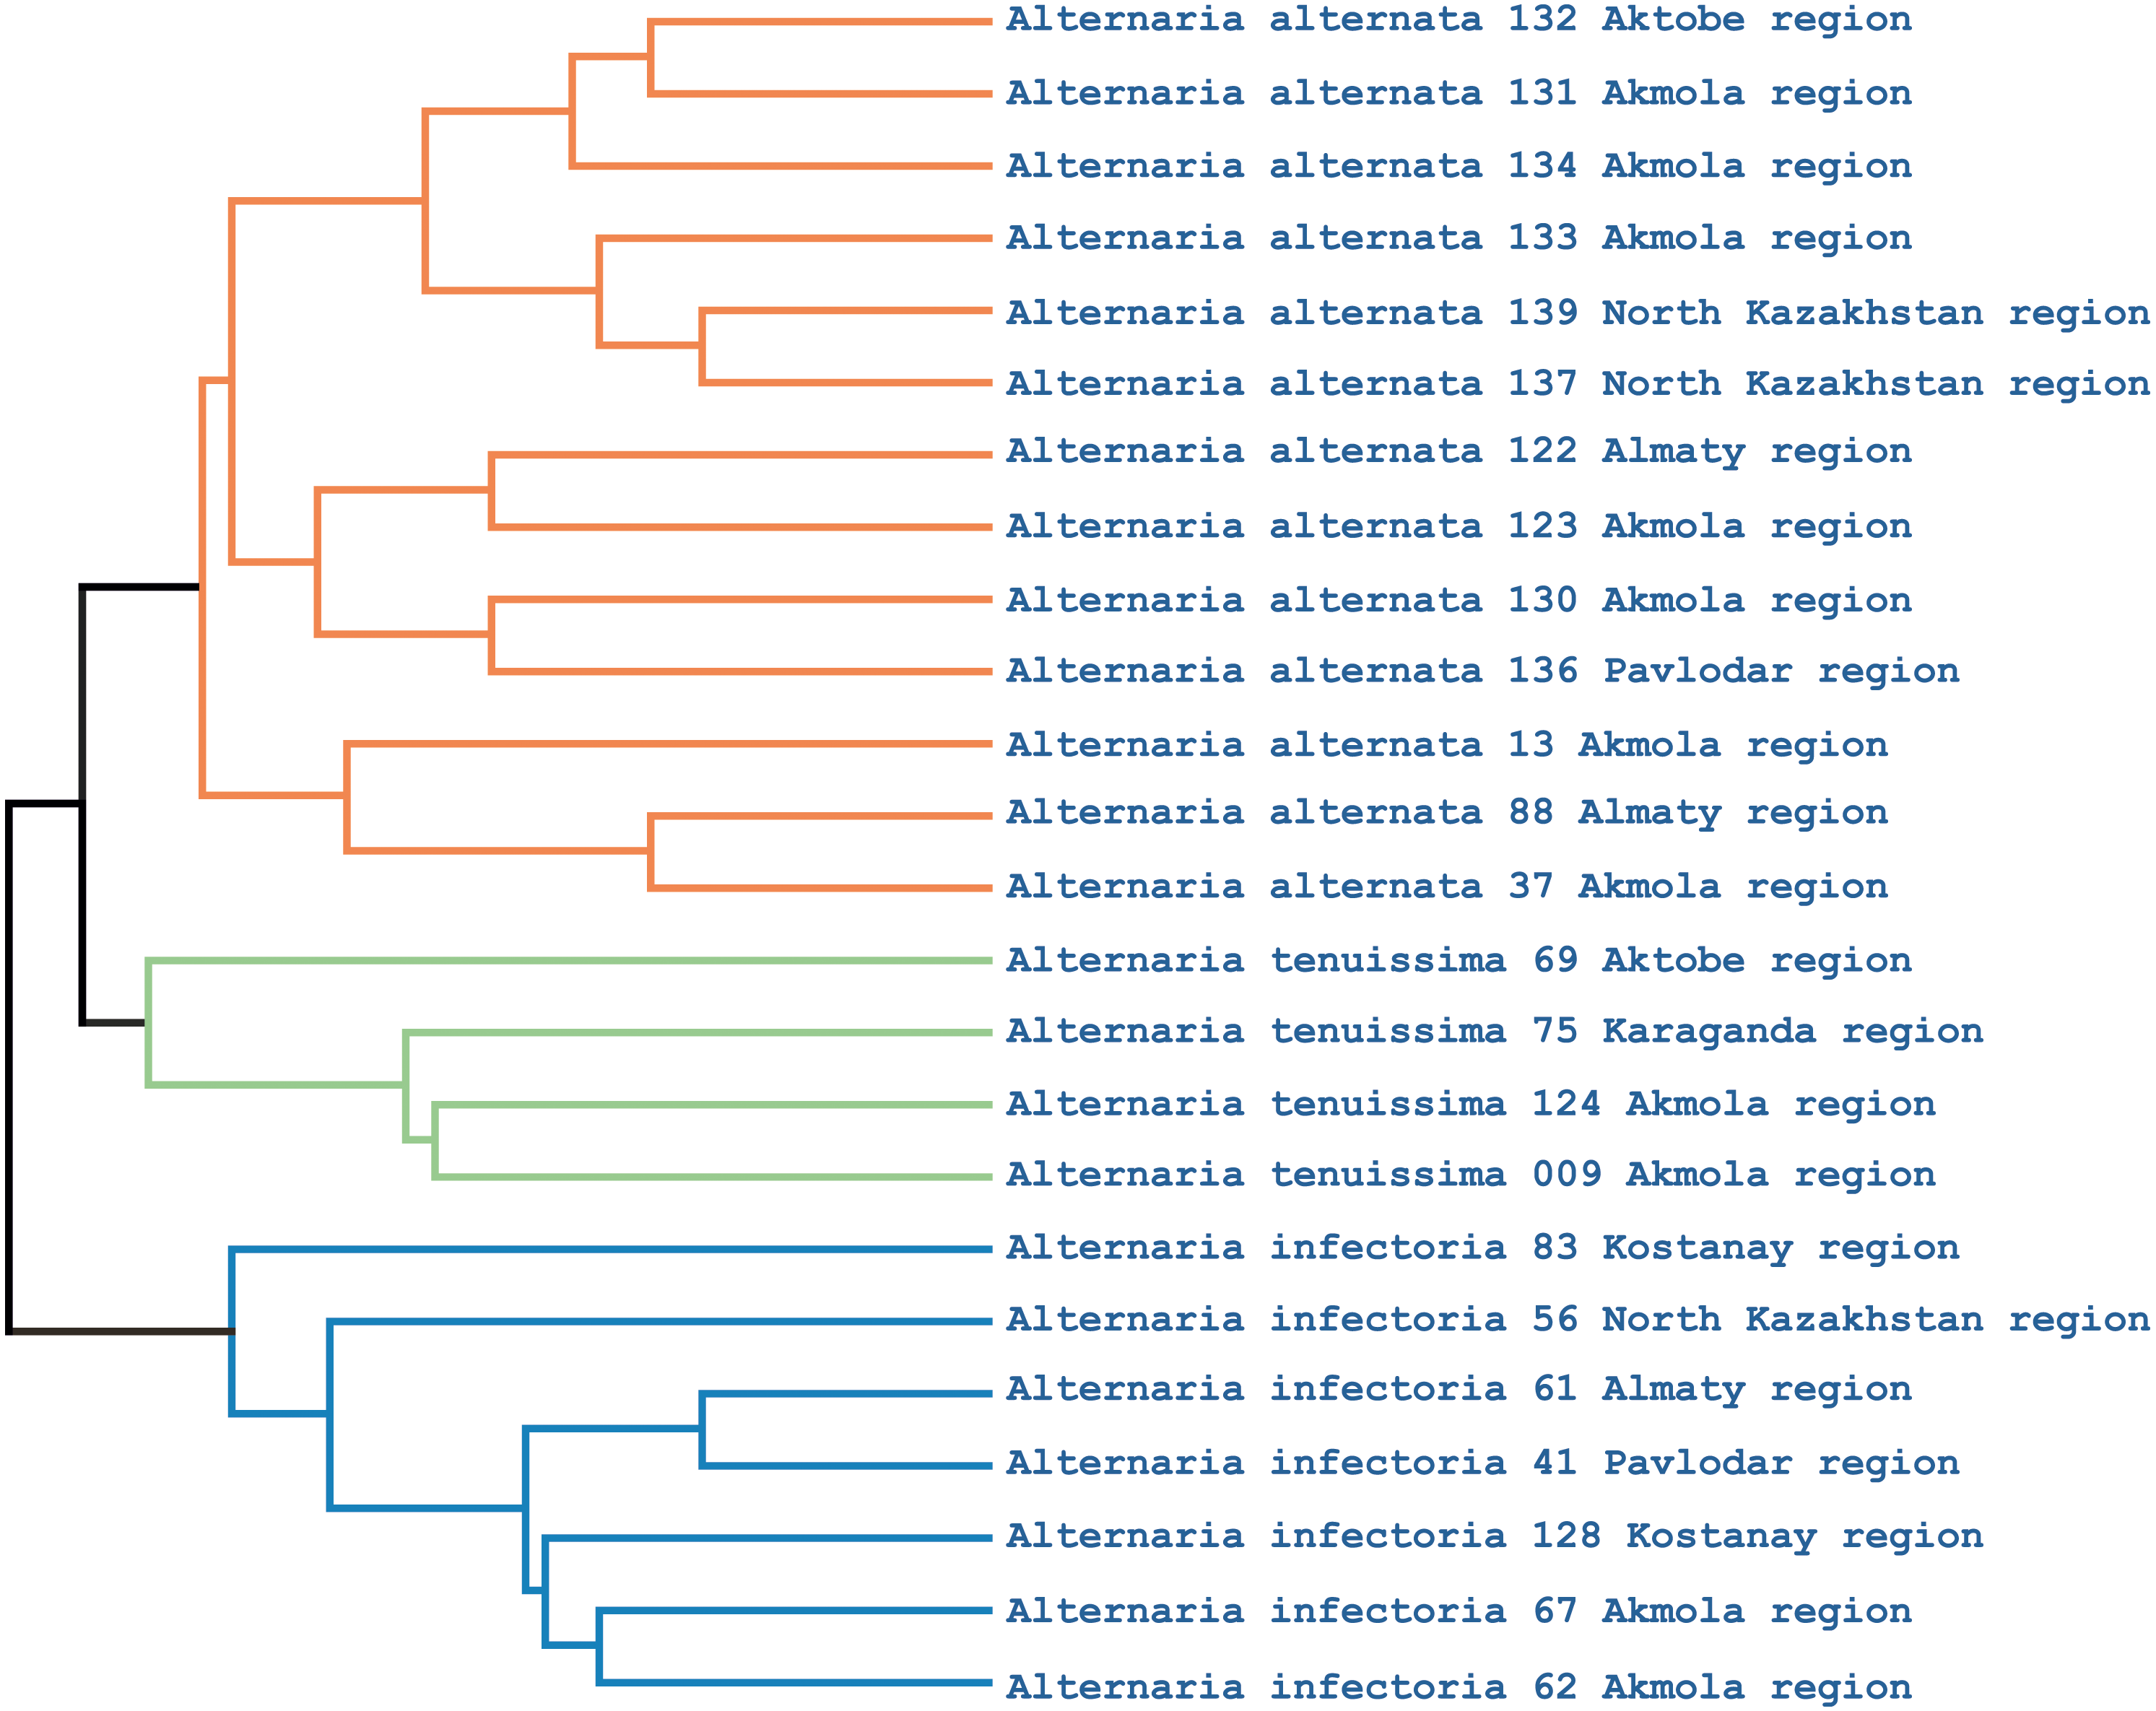
Discussion
Resolving the taxonomy of the genus Alternaria is a very challenging task because this genus is characterized by significant polymorphisms in morphological and cultural features, as well as biological properties. For example, A. alternata and A. tenuissima are the most morphologically similar; (Nilsson et al., 2014) also showed that the ITS profiles of these species are 100% identical. Differences between the two species were revealed only at the level of plasma membrane ATPase and calmodulin loci (Lawrence, Rotondo & Gannibal, 2015). Moreover, there is some controversy regarding the harmfulness of A. alternata and A. infectoria species on wheat plants. This is likely due to the complexity of identifying the species composition of these fungi. Although it is an endophyte, its status as a pathogen is undetermined because it does not synthesize known mycotoxins.
Pathogenic fungi species can infect small grain cereals (wheat, barley, and oat), causing losses by seedling blight, reduced seed germination, or seedling foot and stalk rot. Another potential risk is the presence of fungi toxins; not only do they contaminate cereals, but they could also result in harmful contamination of foods and feedstuffs. Microscopic fungi of the Alternaria genus are most often isolated from wheat seeds. These fungi are the dominant component of the grain microbiome in many regions of the world. Considering the significant danger of toxigenic species of Alternaria, these fungi have recently received much attention (Patriarca, 2016; Tralamazza et al., 2018).
Identifying the genetic variability in populations within a particular type of Alternaria species is important for the development of strategies to counter these fungi, i.e., for breeding programs. Various genetic markers and fingerprinting technologies (RAPD, ISSR, AFLP, and SSR) have been widely used to identify the genetic diversity of fungal populations. Much research has been carried out on other Alternaria species (A. solani, A. brassicicola) that cause vegetable diseases. However, for species that contaminate wheat, the information is very limited. Methods used to study genetic diversity are technically complicated and costly or have low efficiency. PCR-based DNA profiling technologies based on interspersed repeat sequences such as retrotransposons (Kalendar, Amenov & Daniyarov, 2019; Kalendar et al., 2011) have been intensively employed. In eukaryote genomes, LTR retrotransposons are the major repetitive sequence class and have a high density across the genome. Moreover, stress and adaptation are powerful forces shaping the distribution and accumulation of retrotransposons (Belyayev et al., 2010; Ramallo, Kalendar & Schulman, 2008; Schulman & Kalendar, 2005). Thus, the success and diversity of retrotransposons in a genome are shaped by both the properties intrinsic to the elements and the evolutionary forces acting at the host-species level. Clarification of how these forces act together is paramount to understanding the impact of retrotransposons on organismal biology.
The structure of retrotransposons contains conserved sites that belong to typical retroviruses for all eukaryotes. In this regard, the iPBS method developed by Kalendar et al. (2010) has advantages for applications in the evaluation of genetic diversity, because it allows direct detection of polymorphism regardless of the eukaryotic species. It is particularly beneficial when detecting genetic diversity among fungi isolates; since it can detect polymorphisms in many anonymous loci across the genome simultaneously, it is a highly effective method for studying clonal variability (Doungous et al., 2020; Kalendar et al., 2010; Milovanov et al., 2019). Moreover, since most of the retrotransposons are often mixed with each other, the PCR process amplifies many products because the primers are designed to target conserved regions of retrovirus and LTR retrotransposon primer binding sites. Retrotransposon activity or recombination events lead to novel genomic polymorphisms, which can be detected by this method and used to identify reproductively isolated lines (Mascagni et al., 2017; Sanchez et al., 2017; Underwood, Henderson & Martienssen, 2017).
Conclusion
In conclusion, this study demonstrated the effectiveness of iPBS amplification for DNA profiling and identification of the endophytic fungi Alternaria species in wheat grains. Interestingly, the genetic diversity found here using retrotransposon profiles was strongly correlated with geographic data. One explanation for this observation is that the scored retrotransposon polymorphisms in fungal genomes are related to ecological and environmental stresses. Moreover, retrotransposons in fungal genomes are usually clustered near genes, and thus most likely to be under selection. Finally, permanent changes in retrotransposon content dynamically change fungal genomes; even strains of a single fungal species can display a certain percentage of variability during cultivation in response to different environmental conditions. Abiotic and biotic stresses, including plant interaction, are well known to activate retrotransposons (Belyayev et al., 2019; Kalendar et al., 2000; Ramallo, Kalendar & Schulman, 2008). The iPBS marker analysis allowed us to determine the genetic diversity and population structure of Alternaria species isolates and identify various Alternaria species. This knowledge may be helpful in understanding host adaptation to this pathogen; knowledge of population genetic structure of a pathogen provides information about its potential to overcome host genetic resistance. iPBS markers could be a useful tool for studying population biology and genetics of this fungus at a global level. The results show rapid LTR retrotransposon evolution in endophytic fungal genomes through integration, losses, and transfers of retrotransposons in almost every species and strain (Giraud et al., 2008). The relationships between the plant host and the endophytic fungal genome can potentially influence the quantity and quality of LTR retrotransposons and the host ecological niche. Hence, the retrotransposon-based DNA profile is highly informative, enabling geographic resolution of Alternaria species and giving insight into local factors that may be driving genome adaptation. In addition, DNA profiling based on retrotransposons can be an inexpensive way to establish genetic diversity and to determine the species of fungi.