
Comparative transcriptomic analyses of powdery mildew resistant and susceptible cultivated cucumber (Cucumis sativus L.) varieties to identify the genes involved in the resistance to Sphaerotheca fuliginea infection
- Published
- Accepted
- Received
- Academic Editor
- Paolo Giordani
- Subject Areas
- Agricultural Science, Bioinformatics, Genetics, Mycology, Plant Science
- Keywords
- Powdery mildew, Cucumber, Differential expressed gene, Hormone, Pathogen resistance
- Copyright
- © 2020 Zhang et al.
- Licence
- This is an open access article distributed under the terms of the Creative Commons Attribution License, which permits using, remixing, and building upon the work non-commercially, as long as it is properly attributed. For attribution, the original author(s), title, publication source (PeerJ) and either DOI or URL of the article must be cited.
- Cite this article
- 2020. Comparative transcriptomic analyses of powdery mildew resistant and susceptible cultivated cucumber (Cucumis sativus L.) varieties to identify the genes involved in the resistance to Sphaerotheca fuliginea infection. PeerJ 8:e8250 https://doi.org/10.7717/peerj.8250
Abstract
Background
Cucumber (Cucumis sativus L.) is a widely cultivated vegetable crop, and its yield and quality are greatly affected by various pathogen infections. Sphaerotheca fuliginea is a pathogen that causes powdery mildew (PM) disease in cucumber. However, the genes involved in the resistance to PM in cucumber are largely unknown.
Methods
In our study, a cucumber PM resistant cultivated variety “BK2” and a susceptible cultivated variety “H136” were used to screen and identify differential expressed genes (DEGs) under the S. fuliginea infection.
Results
There were only 97 DEGs between BK2 and H136 under the control condition, suggesting a similarity in the basal gene expression between the resistant and susceptible cultivated varieties. A large number of hormone signaling-related DEGs (9.2% of all DEGs) between resistant and susceptible varieties were identified, suggesting an involvement of hormone signaling pathways in the resistance to PM. In our study, the defense-related DEGs belonging to Class I were only induced in susceptible cultivated variety and the defense-related DEGs belonging to Class II were only induced in resistant cultivated variety. The peroxidase, NBS, glucanase and chitinase genes that were grouped into Class I and II might contribute to production of the resistance to PM in resistant cultivated variety. Furthermore, several members of Pathogen Response-2 family, such as glucanases and chitinases, were identified as DEGs, suggesting that cucumber might enhance the resistance to PM by accelerating the degradation of the pathogen cell walls. Our data allowed us to identify and analyze more potential genes related to PM resistance.
Introduction
Cucumber (Cucumis sativus L.) is an economically important vegetable crop cultivated worldwide, and its production is affected by a variety of infective agents (Zhang et al., 2008). Powdery mildew (PM) caused by Sphaerotheca fuliginea is the most destructive disease in cucumber (Zhang et al., 2012). S. fuliginea is a pathogen with a narrow host range limited to the Cucurbitaceae (Savory et al., 2011). Recently, massive data on the epidemiology, host specificity, and genome of S. fuliginea have been studied and published (Arauz et al., 2010; Tian et al., 2011). P. fuliginea infects the host plants either by conidia or ascospores. Once the conidia have touched the host surface for a few hours, the germ tube and appressorium emerges from the conidium and penetrates the host cell wall (Huckelhoven, 2005). After the barrier is defeated, the infection structures are soon developed (Kavková & Čurn, 2005). The pathogen has a broad host range and can survive on a variety of cucurbit crops during the growing seasons (He et al., 2013). Powdery mildew infects foliage and causes a reduction in photosynthetic activity at the early stage of cucumber development (Oerke et al., 2006). The rapid infection process of S. fuliginea makes PM difficult to be controlled in nature (Olczak-Woltman, Marcinkowska & Niemirowicz-Szczytt, 2011).
Selective breeding for PM-resistant cucumber varieties is an environmentally friendly and effective way to control the disease (McGrath, 2001). Several PM-resistant cucumber varieties, including classic PI197088 line, European greenhouse type S06, inbred line WI 2757, BK2, have been screened in the past years (He et al., 2013; Liu et al., 2008; Sakata et al., 2006; Zhang et al., 2015). These PM-resistant varieties provided good materials for quantitative trait locus (QTL) mapping of PM resistance (Wang et al., 2018). During evolution, plants developed a two-level innate immune system against pathogen attacks (Jones & Dangl, 2006). The first level is preventing pathogens from entering the cell through pathogen-associated molecular pattern-triggered immunity (Zipfel & Robatzek, 2010). The second level consists of a number of resistance genes and proteins, which trigger the programed cell death of pathogens (Cheng et al., 2012). The involvement of genes in PM resistance is complex, and no undisputed mechanisms have been determined (Liu et al., 2017).
Powdery mildew-associated resistance genes have been screened and utilized. For example, in cucumber, a potential nucleotide-binding site (NBS)-containing, protein-encoding resistance gene analog, CsRGA23, is involved in the active defense response to pathogen infection (Wan et al., 2010). The CsERF004 expression pattern in resistant and susceptible cucumber cultivars indicated that CsERF004 plays a role in the resistance to pathogen infection (Liu et al., 2017). Additionally, 15 NBS-containing disease resistance genes have been isolated from the cucumber genome using degenerate PCR primers (Ding et al., 2005). Owing to its limited genetic diversity, there have been few advances in breeding for disease resistance in cucumber.
Several phytohormones, such as auxin, jasmonic acid (JA), salicylic acid (SA) and abscisic acid (ABA), are involved in plant responses to pathogen infection (Jiang et al., 2010; Riemann et al., 2013; Takatsuji, Jiang & Sugano, 2010). Variations in phytohormone accumulation profiles among Vitis cultivars contributed to PM resistance (Yin et al., 2017). Furthermore, species-specific transcriptional responses of hormone signaling genes to PM were discovered in various grapevine species (Polesani et al., 2010). Hormone-related genes may be involved in the resistance to PM in cucumber. Additionally, glucanases are abundant in plants and may be associated with resistance to phytopathogenic fungi (Johnson George et al., 2016). Glucanase genes are always co-expressed with other anti-pathogen genes, including chitinase and peroxidase, in various plant species (Balasubramanian et al., 2012).
Next-generation sequencing is a cost-efficient way to analyze transcriptomic variations under different treatment conditions (Shen et al., 2017; Yu et al., 2017). In 2012, expression profiling of P. cubensis-infected cucumber identified differential expressed genes (DEGs) during the infection process from 1 to 8 d post inoculation (Adhikari et al., 2012). Additionally, a P. cubensis transcriptome isolated during cucumber infection captured 2,383 P. cubensis DEGs in sporangia (Savory et al., 2012). The identification of the DEGs between resistant and susceptible cucumber varieties aids in the screening of candidate resistance genes and suggests a complex regulatory network in the plant–pathogen system (Burkhardt & Day, 2016). In our study, two cultivated cucumber varieties were used for RNA-seq, allowing us to identify and analyze more potential genes related to PM resistance.
Materials and Methods
Plant material and sampling
A cucumber PM-resistant cultivated cucumber variety “BK2” and a PM-susceptible cultivated variety “H136” were used in our study (Zhang et al., 2015). Cucumber seedlings were planted in a greenhouse with a photoperiod of 12 h light/12 h dark, relative humidity of 60%, and light intensity of 120 μmol m−2 s−1. The third leaves of the seedlings at the three-leaf stage were sprayed with S. fuliginea for inoculation. The infected morphological results are showed in Fig. S1. A solution containing S. fuliginea sporangia (2 × 10⁶ sporangia/mL), 5 mM glucose, and 2.5 mM KH2PO4 was prepared as the inoculant. The seedlings sprayed with sterile water were used as the controls. Both inoculated and control seedlings were kept in dark for 24 h and separately covered with plastic film. In total, 10 seedlings per replicate and three replicates per treatment group were tested. In our study, four independent cDNA library groups were constructed for Illumina RNA sequencing. Two library groups (three libraries for each group) were from a PM-resistant cultivated cucumber variety, including a water treated- and a S. fuliginea treated-materials. Two other library groups (three libraries for each group) were from a PM-susceptible cultivated cucumber variety, including a water treated- and a S. fuliginea treated-materials. Plant samples for each group were harvested at 48 h post inoculation and were immediately frozen in liquid N2 until use.
RNA extraction and cDNA library preparation
Total RNA was extracted using a TRIzol Kit according to its protocol (Promega, Beijing, China). There are three biological replications have been performed for each RNA groups. DNA contamination was removed by RNase-free DNase I (TaKaRa, Dalian, China). RNA concentrations were quantified using a NanoDrop ND-1000 spectrophotometer at 260 nm and 280 nm. Three independent cDNA libraries for each sample group were constructed. The library of sensitive cultivated variety sprayed with sterile water was named “SC,” the library of sensitive cultivated variety sprayed with S. fuliginea named “ST,” the library of resistant cultivated variety sprayed with sterile water was named “RC,” and the library of resistant cultivated variety sprayed with S. fuliginea named “RT.” The four libraries were used for the transcriptome sequencing, separately, using Illumina HiSeq™ 4000 platform by Gene Denovo Co. (Guangzhou, China). Raw reads were generated in a paired-end format with average length of 300 bp. The raw sequence data has been submitted to the NCBI Short Read Archive with accession numbers SRP212890.
Processing of RNA-seq data
Raw data (raw reads) of fastq format were firstly processed through in-house perl scripts with average length of 300 bp. In this step, clean data (clean reads) were obtained by removing reads with the length less than 100 bp, and low quality reads from raw data. For reads quality control, the reads with base quality <10 in more than 80% of reads, reads containing adapters, and reads with an N ratio > 5% were considered to be low quality reads. At the same time, Q20, Q30, GC-content and sequence duplication level of the clean data were calculated. All the downstream analyses were based on clean data with high quality.
Comparative analysis and gene functional annotation
The adaptor sequences and low-quality sequence reads were removed from the data sets. These clean reads were then mapped to the reference genome sequence (NCBI: ASM407v2). Only reads without mismatch or with one mismatch were further analyzed and annotated based on the reference genome. Tophat2 tools software were used to map with reference genome. Gene function was annotated based on the following databases: Nr (NCBI non-redundant protein sequences, https://www.ncbi.nlm.nih.gov); Nt (NCBI non-redundant nucleotide sequences); Pfam (Protein family, http://pfam.xfam.org/); KOG/COG (Clusters of Orthologous Groups of proteins, http://clovr.org/docs/clusters-of-orthologous-groups-cogs/); Swiss-Prot (A manually annotated and reviewed protein sequence database, https://web.expasy.org/docs/swiss-prot_guideline.html); KO (KEGG Ortholog database, https://www.kegg.jp/); and GO (Gene Ontology, https://www.ebi.ac.uk/ols/ontologies/go) (Hao et al., 2017). For functional annotation, the unigenes, though a BLASTall algorithm-based program with a threshold of E-value < 10−10, were searched against different databases.
Quantification of gene expression levels
The number of reads mapped to each unigene was counted using HTSeq software. Quantification of gene expression levels were estimated by fragments per kilobase of transcript per million fragments mapped method.
Differential expression analysis
Differential expression analysis of two groups was performed using the DESeq R package (1.10.1). DESeq provide statistical routines for determining differential expression in digital gene expression data using a model based on the negative binomial distribution. The resulting P values were adjusted using the Benjamini and Hochberg’s approach for controlling the false discovery rate. The DEGs were screened with criterions: |log2 fold change| > 1 and statistical significance of adjusted P value < 0.05 (Anders & Huber, 2010).
Enrichment analysis
Gene Ontology (GO) enrichment analysis of the differentially expressed genes (DEGs) was implemented by the GOseq R packages based Wallenius non-central hyper-geometric distribution, which can adjust for gene length bias in DEGs.
Kyoto Encyclopedia of Genes and Genomes (KEGG) is a database resource for understanding high-level functions and utilities of the biological system, such as the cell, the organism and the ecosystem, from molecular-level information, especially large-scale molecular datasets generated by genome sequencing and other high-throughput experimental technologies (http://www.genome.jp/kegg/). We used KOBAS software to test the statistical enrichment of differential expression genes in KEGG pathways (Xie et al., 2011). A two-tailed Fisher’s exact test was used to analyze the GO and KEGG functional enrichments. GO and KEGG categories with a corrected P value < 0.05 was considered significant.
K-means cluster
ClusGap R function-cluster package (v.2.0.5) was used to determine the optimal number of clusters. Subsequently, K-means clustering with default algorithm was used to get clusters using the scaled normalized relative gene expression data on a log2 scale for each expressed gene. The results of clustering were displayed using MeV program.
Real-time PCR validation
Total RNAs from different sample groups were isolated by a Plant RNeasy Mini kit (Qiagen, Hilden, Germany) according to its protocol. QRT-PCR was performed using the SYBR Premix Ex Taq Kit (TaKaRa, Dalian, China) and a DNA Sequence Detection System (ABI PRISM 7700; Applied Biosystems, Shanghai, China). Three independent samples from each group were used for the RT-PCR experiment. The EF1a gene (accession number EF446145) was used as the internal standard gene to calculate relative fold differences by the values of comparative cycle threshold (2−ΔΔCt). Sterile ddH2O was used as no-template control. In detail, one μL cDNA was added to five μL of 2 × SYBR® Green buffer, 0.1 μM of each primer and ddH2O to a working volume of 10 μL. The PCR program was 95 °C for 10 min, followed by 40 cycles of 95 °C for 10 s and 60 °C for 60 s, 72 °C for 15 s at last.
Statistical analysis
Statistical data were analyzed using Statistical Program for Social Sciences (SPSS) 19.0 software (SPSS, Chicago, IL, USA). All of the expression analyses were performed for three biological replicates. All reported values represent the averages of three replicates, and data are expressed as the mean plus or minus the standard deviation (mean ± SD).
Results
Sequencing and sequence annotation
In our study, a large number of raw reads were filtered to produce ~280 million clean reads (Table S1). Most of the clean reads could be mapped onto the reference genome (NCBI: ASM407v2), including 87.1% unique mapped reads and 1.8% multiple mapped reads (Table S2).
For gene annotation, the genes were queried against several databases, including Nr (21,343 genes), SwissProt (20,889 genes), KEGG (7,556 genes), COG (8,024 genes), Pfam (17,235 genes), eggNOG (20,239 genes) and KOG (11,386). In total, 21,408 genes could be annotated to at least one database (Table S3). Most of the genes (11,386 genes) could be assigned to 25 functional KOG classifications. The largest KOG term, “General function prediction only,” contained 2,367 genes. “Posttranslational modification, protein turnover, chaperones” (1,330 genes), “Signal transduction mechanisms” (1,101 genes), “translation” (771 genes), and “Carbohydrate transport and metabolism” (718 genes) contained large numbers of the identified genes. Only four unigenes were classified into “Cell motility” (Fig. 1). The detailed information of all identified unigenes, including gene id, functional description, ontology assignment, expression value, P-value, are shown in Table S4.
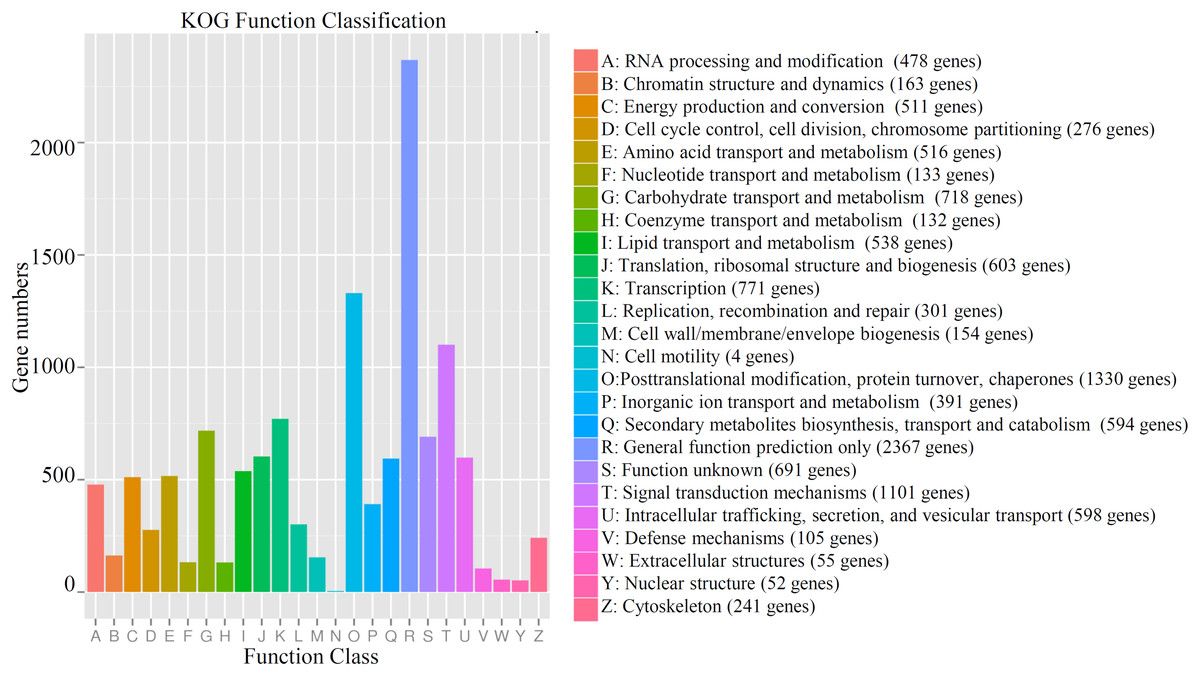
Figure 1: Functional KOG classification of all annotated genes in cucumber.
The number of gene belonging the each KOG term was shown. Different colors indicated different categories.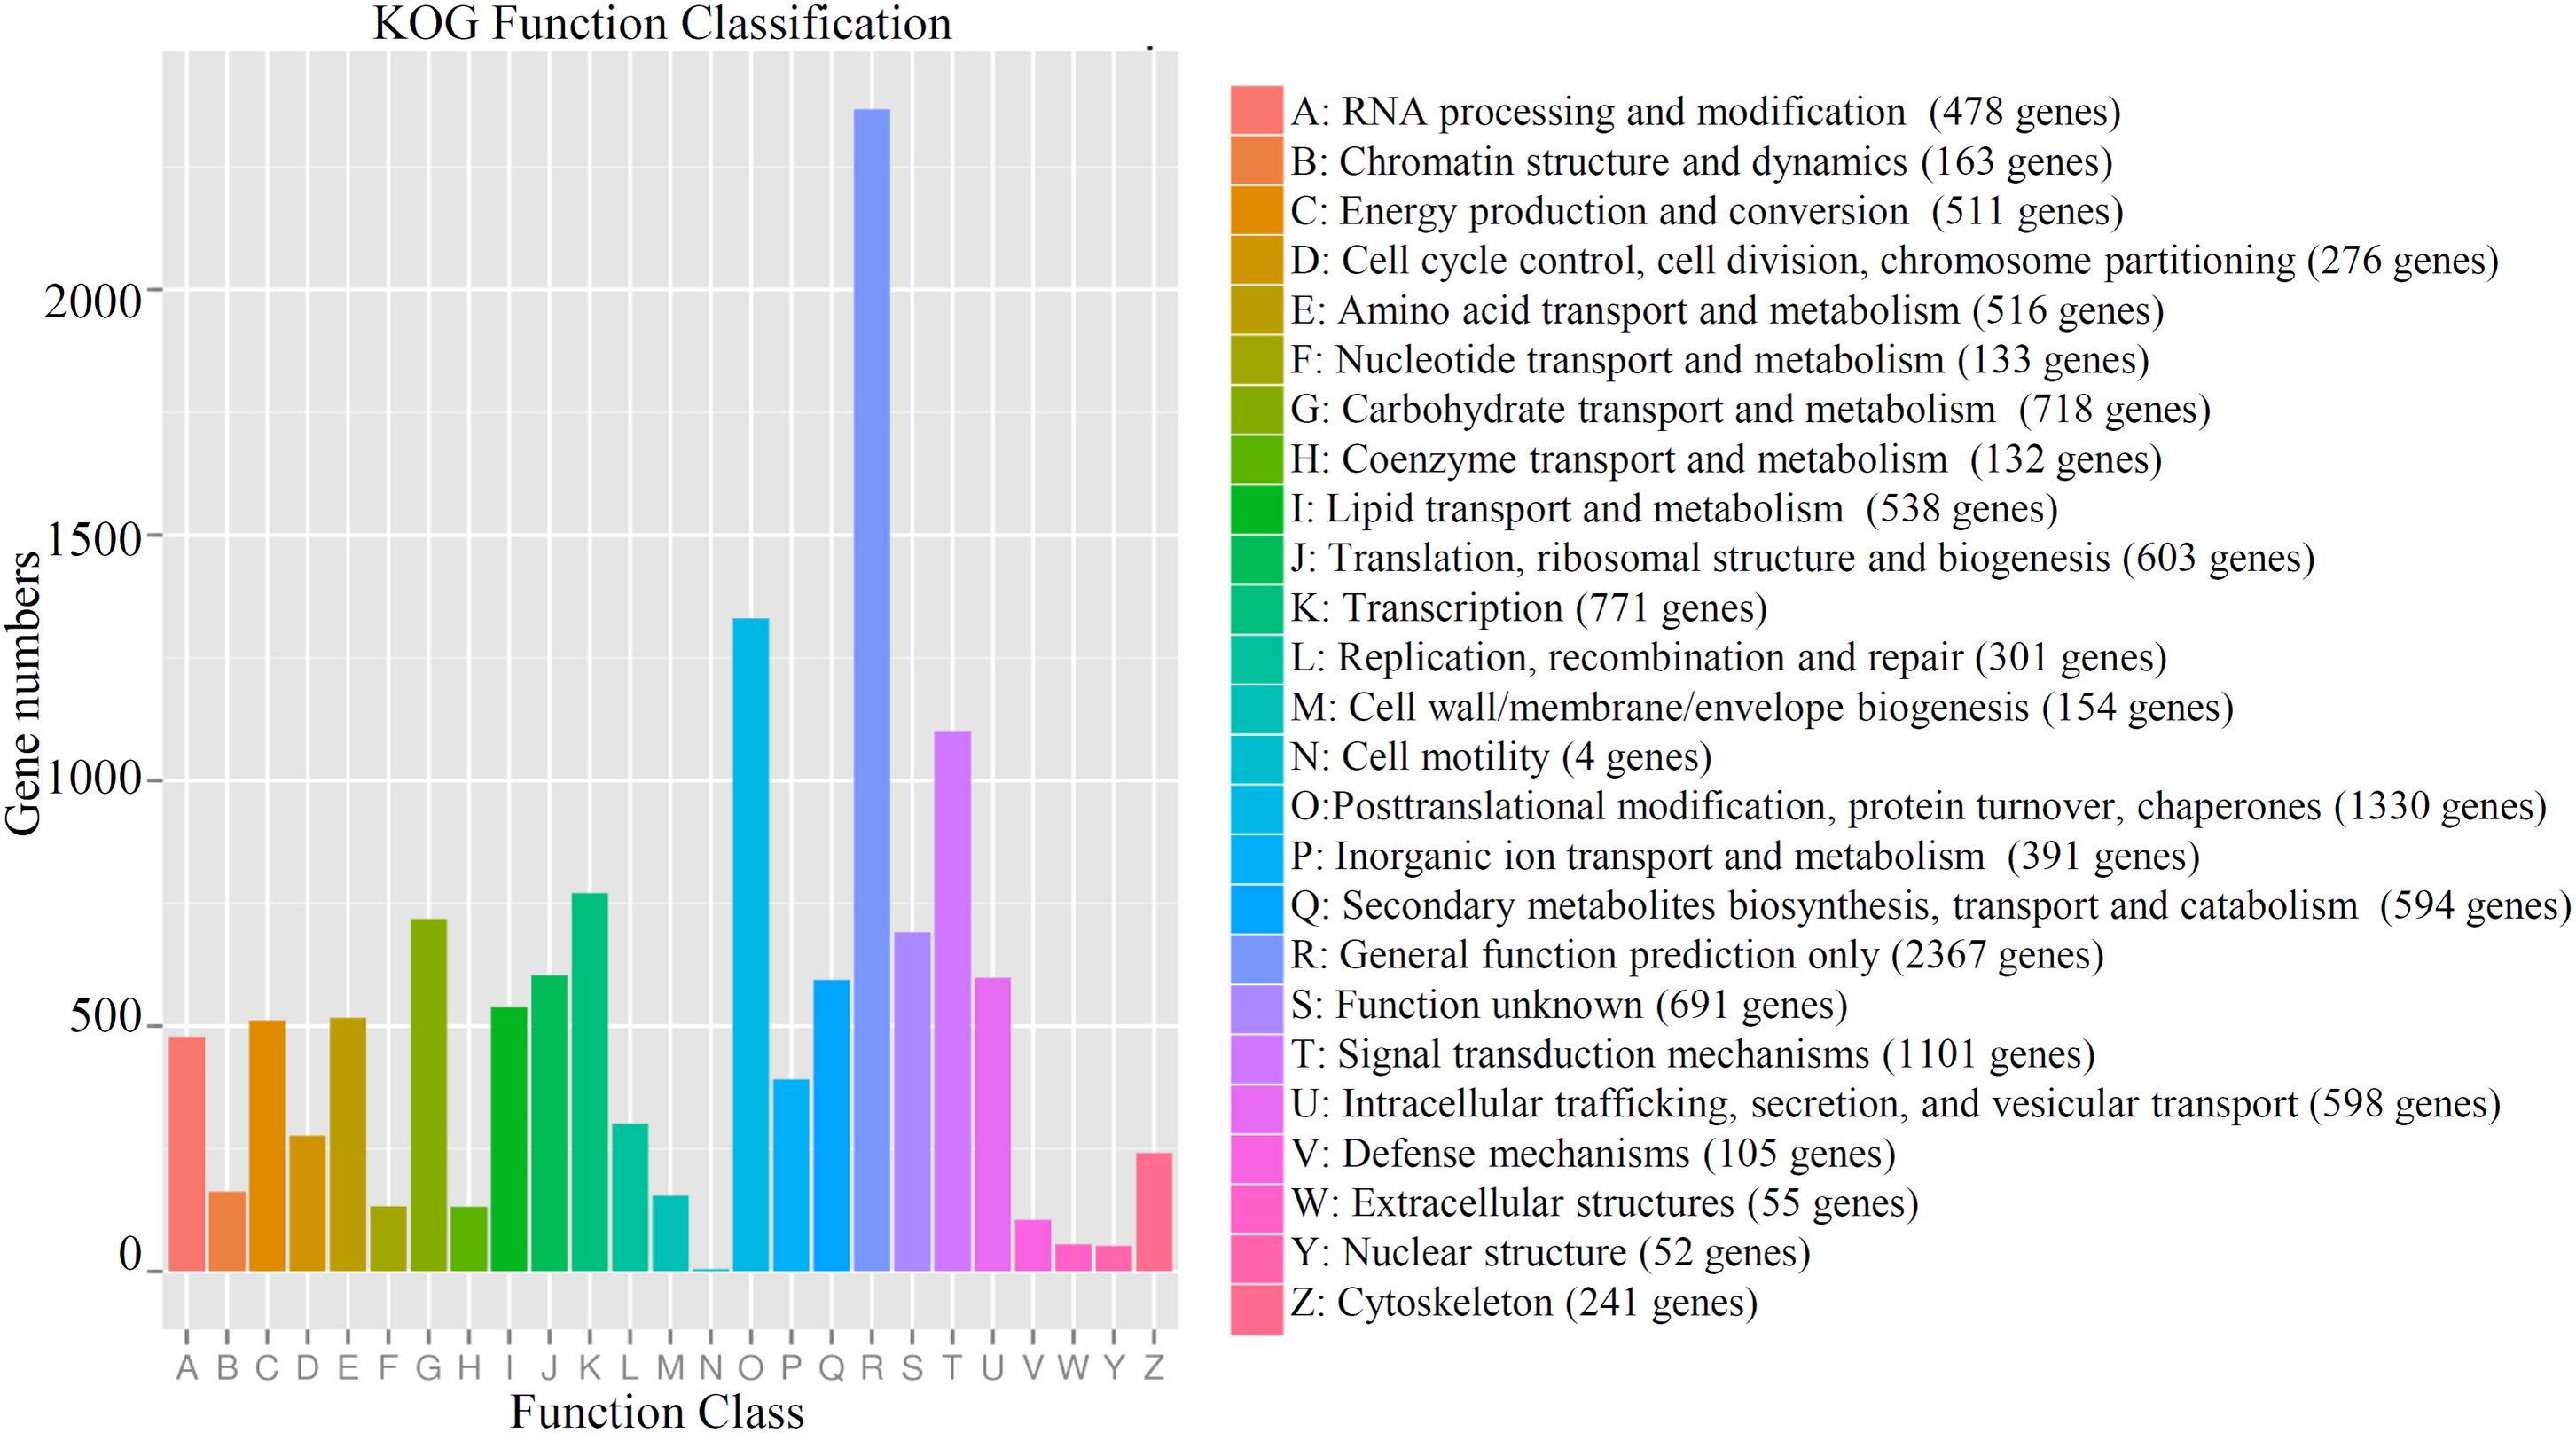
GO and KEGG classifications of all identified genes
In our study, most of the identified genes could be assigned to various functional terms belonging to the three major GO categories: biological process, cellular component, and molecular function. For biological process, “metabolic processes,” “single-organism process,” and “cellular processes” were the dominant GO terms. For cellular component, the dominant terms were “cell,” “cell part,” and “organelle,” and for molecular function, a large percentage of genes were associated with “catalytic activity” and “binding” (Fig. S2; Table S5).
Furthermore, all of the unigenes mapped to canonical pathways in the KEGG database. In total, 7,756 genes from cucumber were assigned to 126 KEGG pathways (Table S6). The largest KEGG term was “ribosome” with 293 genes (ko03010). Additionally, 278 genes were associated with the KEGG pathway “plant hormone signal transduction,” 215 with “biosynthesis of amino acids,” and 211 with “carbon metabolism.”
Analysis of DEGs during S. fuliginea infections
To compare the DEGs between different sample groups, expression profiles of the DEGs were displayed in a heatmap (Fig. 2A). A total of 3,410 DEGs were identified, including 2,312 DEGs in the ST vs RT comparison, 1,174 DEGs in the ST vs SC comparison, 1,044 DEGs in the RT vs RC comparison, and 97 DEGs in the SC vs RC comparison (Fig. 2B). To reflect the changing trends among sample groups, all of the DEGs were assigned into 12 clusters using MeV software by the K-means method. The genes belonging to the Clusters 1, 3 and 10 showed the highest expression levels in the RT sample group. The genes belonging to the Clusters 7 and 12 showed the highest expression levels in the ST sample group. The genes belonging to Clusters 4 and 8 showed the highest expression levels in the SC sample group, and the genes belonging to Clusters 9 and 11 showed the highest expression levels in the RC sample group (Fig. 2C).
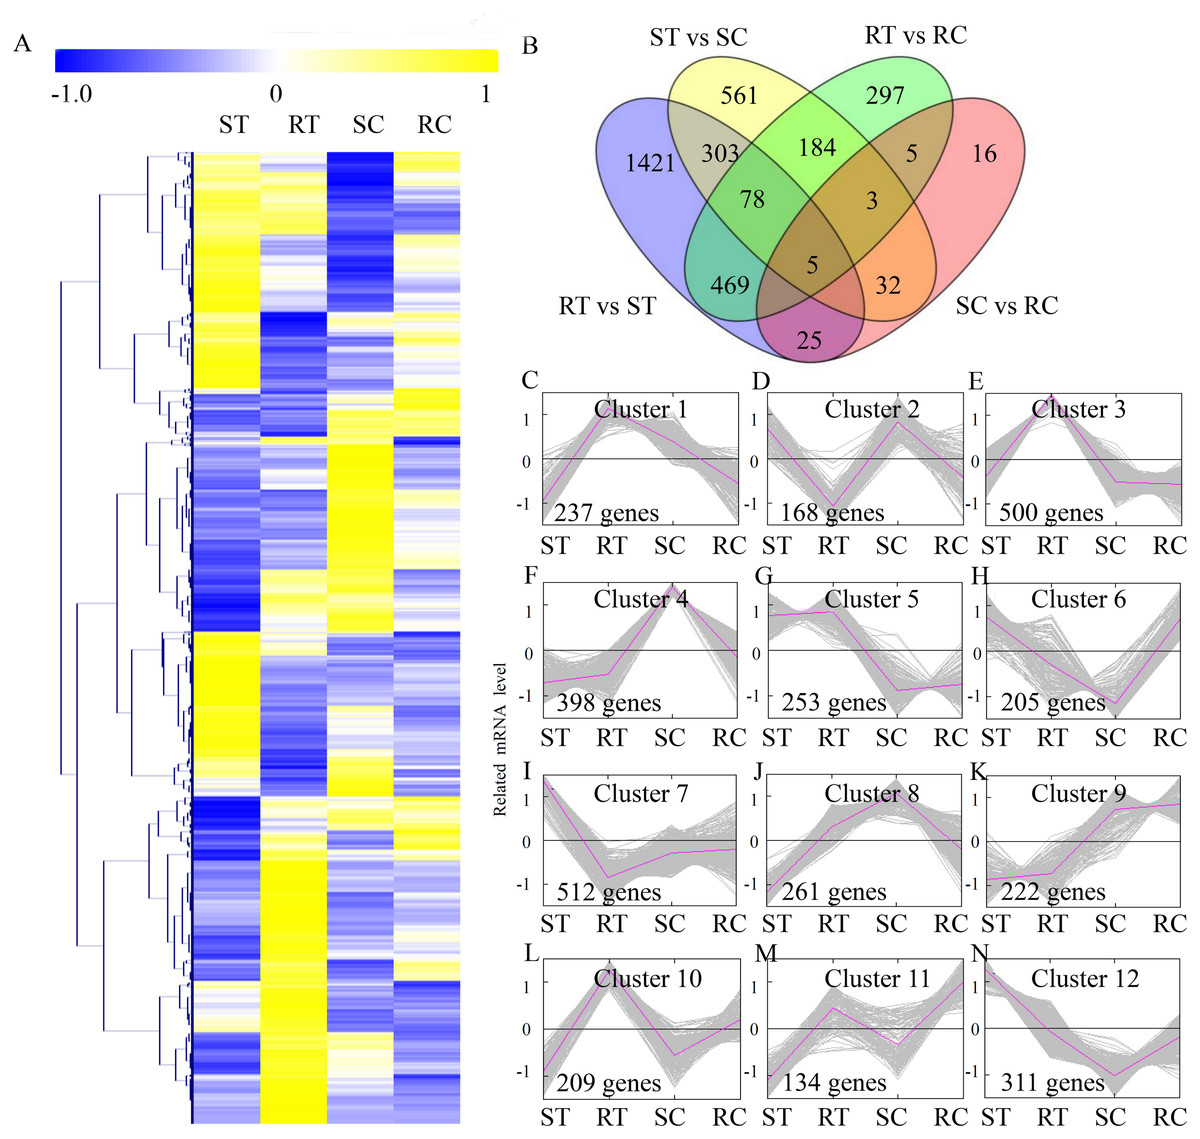
Figure 2: Expression profiles of the differentially expressed genes.
(A) Heat map for cluster analysis of the differentially expressed unigenes by K-means method. Yellow indicates up-regulated genes and blue indicates down-regulated genes. (B) VennDiagrams of the DEGs in different comparisons. (C–N) MeV cluster analysis of differentially expressed genes from the gene expression profiles.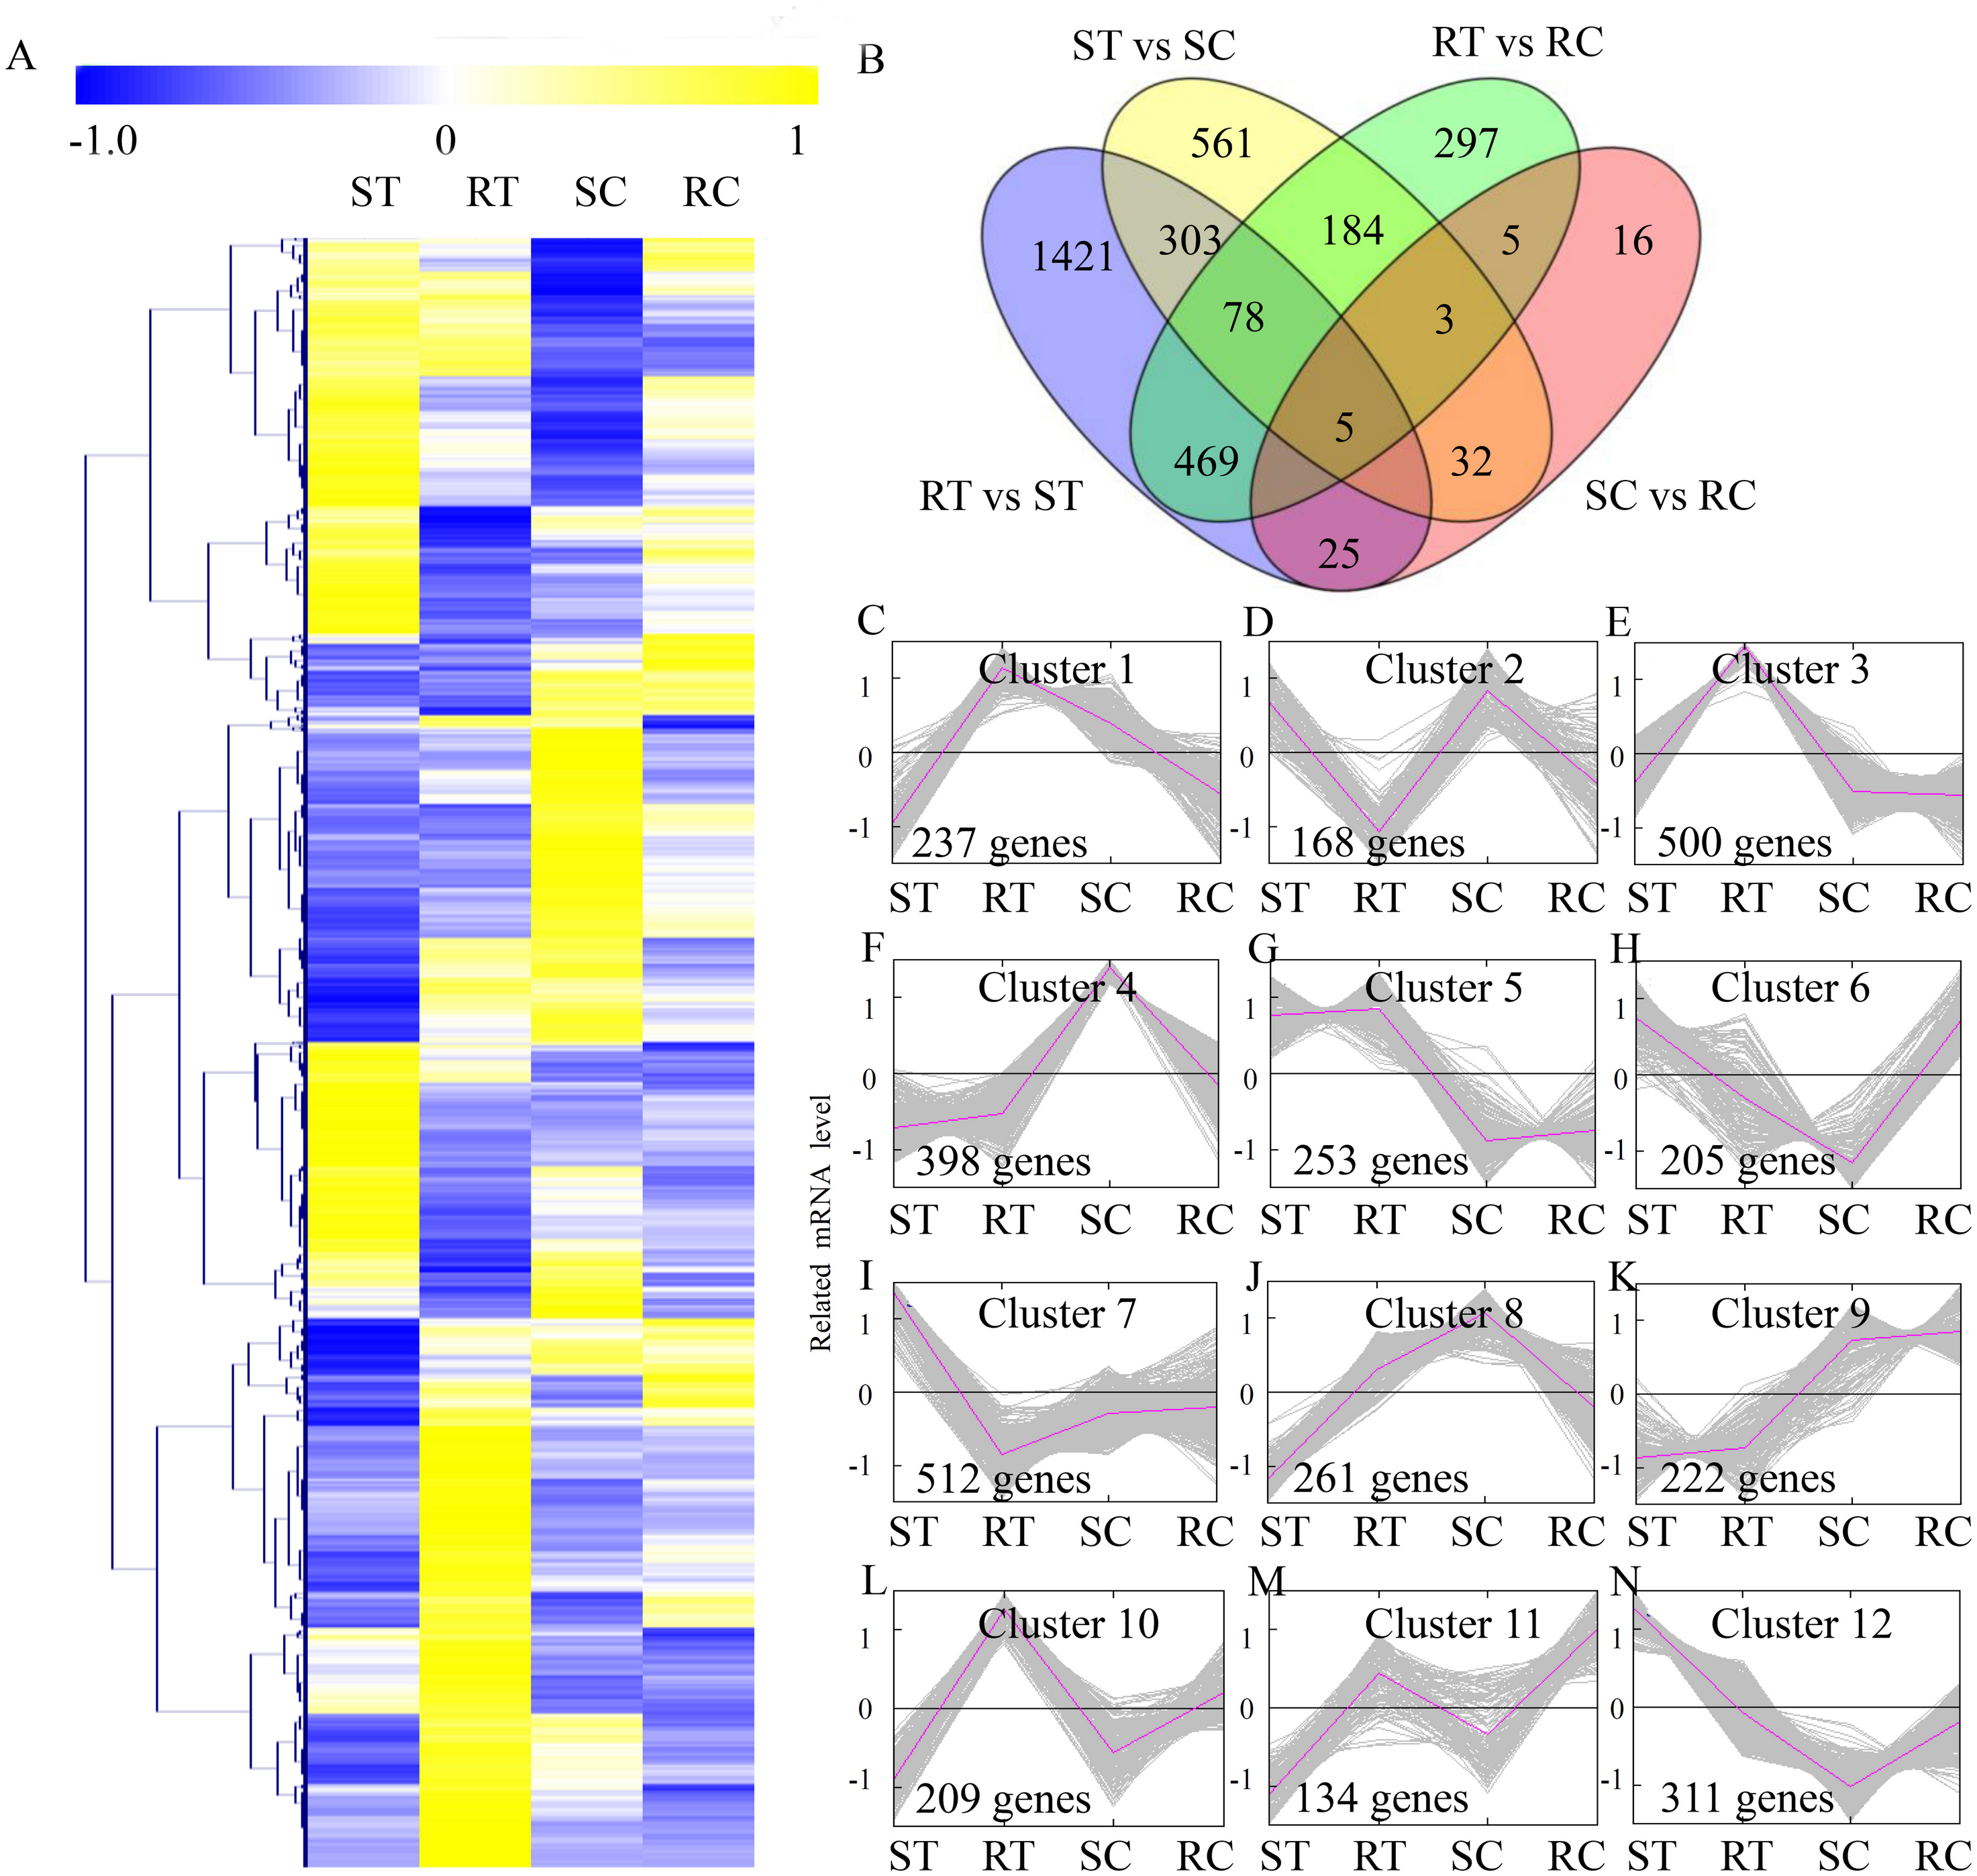
Analysis of the DEGs between resistant and susceptible cucumber varieties during S. fuliginea infection
A GO enrichment analysis showed that several stress response-related GO terms were enriched under the S. fuliginea infection in the resistant variety. In detail, seven stress response-related GO terms, including “response to high light intensity,” “response to ABA,” “response to reactive oxygen species,” “defense response to bacterium,” “response to JA,” “response to inorganic substance” and “response to nematode” terms, were significantly enriched in the RT vs RC comparison (Table S7). Only two stress response-related GO terms, including “response to auxin” and “response to ABA” terms, were significantly enriched in the ST vs SC comparison (Table S8).
A KEGG enrichment analysis showed that the expression levels of 21 “plant hormone signal transduction”-related genes were altered by the S. fuliginea infection in the resistant variety, while only 12 were altered in the susceptible variety. Moreover, the expression levels of 10 and 7 “plant–pathogen interaction”-related genes were altered by the S. fuliginea infection in the resistant and susceptible varieties, respectively. The number of metabolism-related genes that were altered by the S. fuliginea infection in the resistant variety was different from that in the susceptible variety. For example, the expression levels of seven “flavonoid biosynthesis”-related genes, such as F3M (Csa1G013190), CHS2 (Csa3G600020), CYP98A44 (Csa3G819790), CHI (Csa5G505170), F3H (Csa6G108510), CYP73A11 (Csa6G133710) and HST (Csa7G431440), were altered in the resistant variety but only three genes, such as CYP98A44 (Csa3G819790), FLS (Csa6G040540) and HST (Csa7G431440), were altered in the susceptible variety. In addition, the expression levels of 14 “starch and sucrose metabolism”-related genes were altered in the resistant variety, while 21 were altered in the susceptible variety (Fig. 3). The significance P values of each KEGG pathway in the ST vs SC and RT vs RC comparisons are shown in Tables S9 and S10.
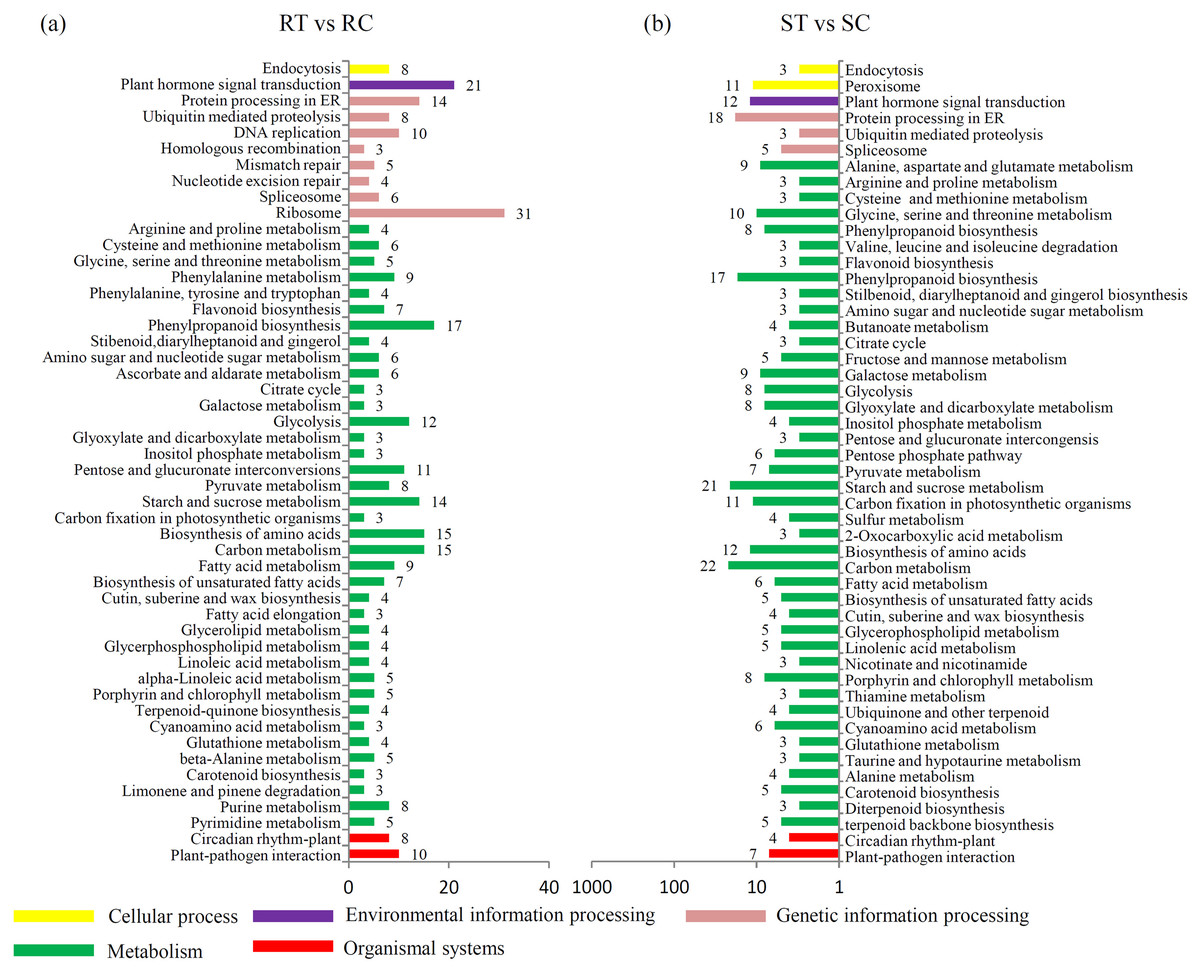
Figure 3: Identification of the DEGs in different comparisons.
(A) Classification of enriched KEGG terms in the DEGs in the RT vs. RC comparison. (B) Classification of enriched KEGG terms in the DEGs in the ST vs. SC comparison.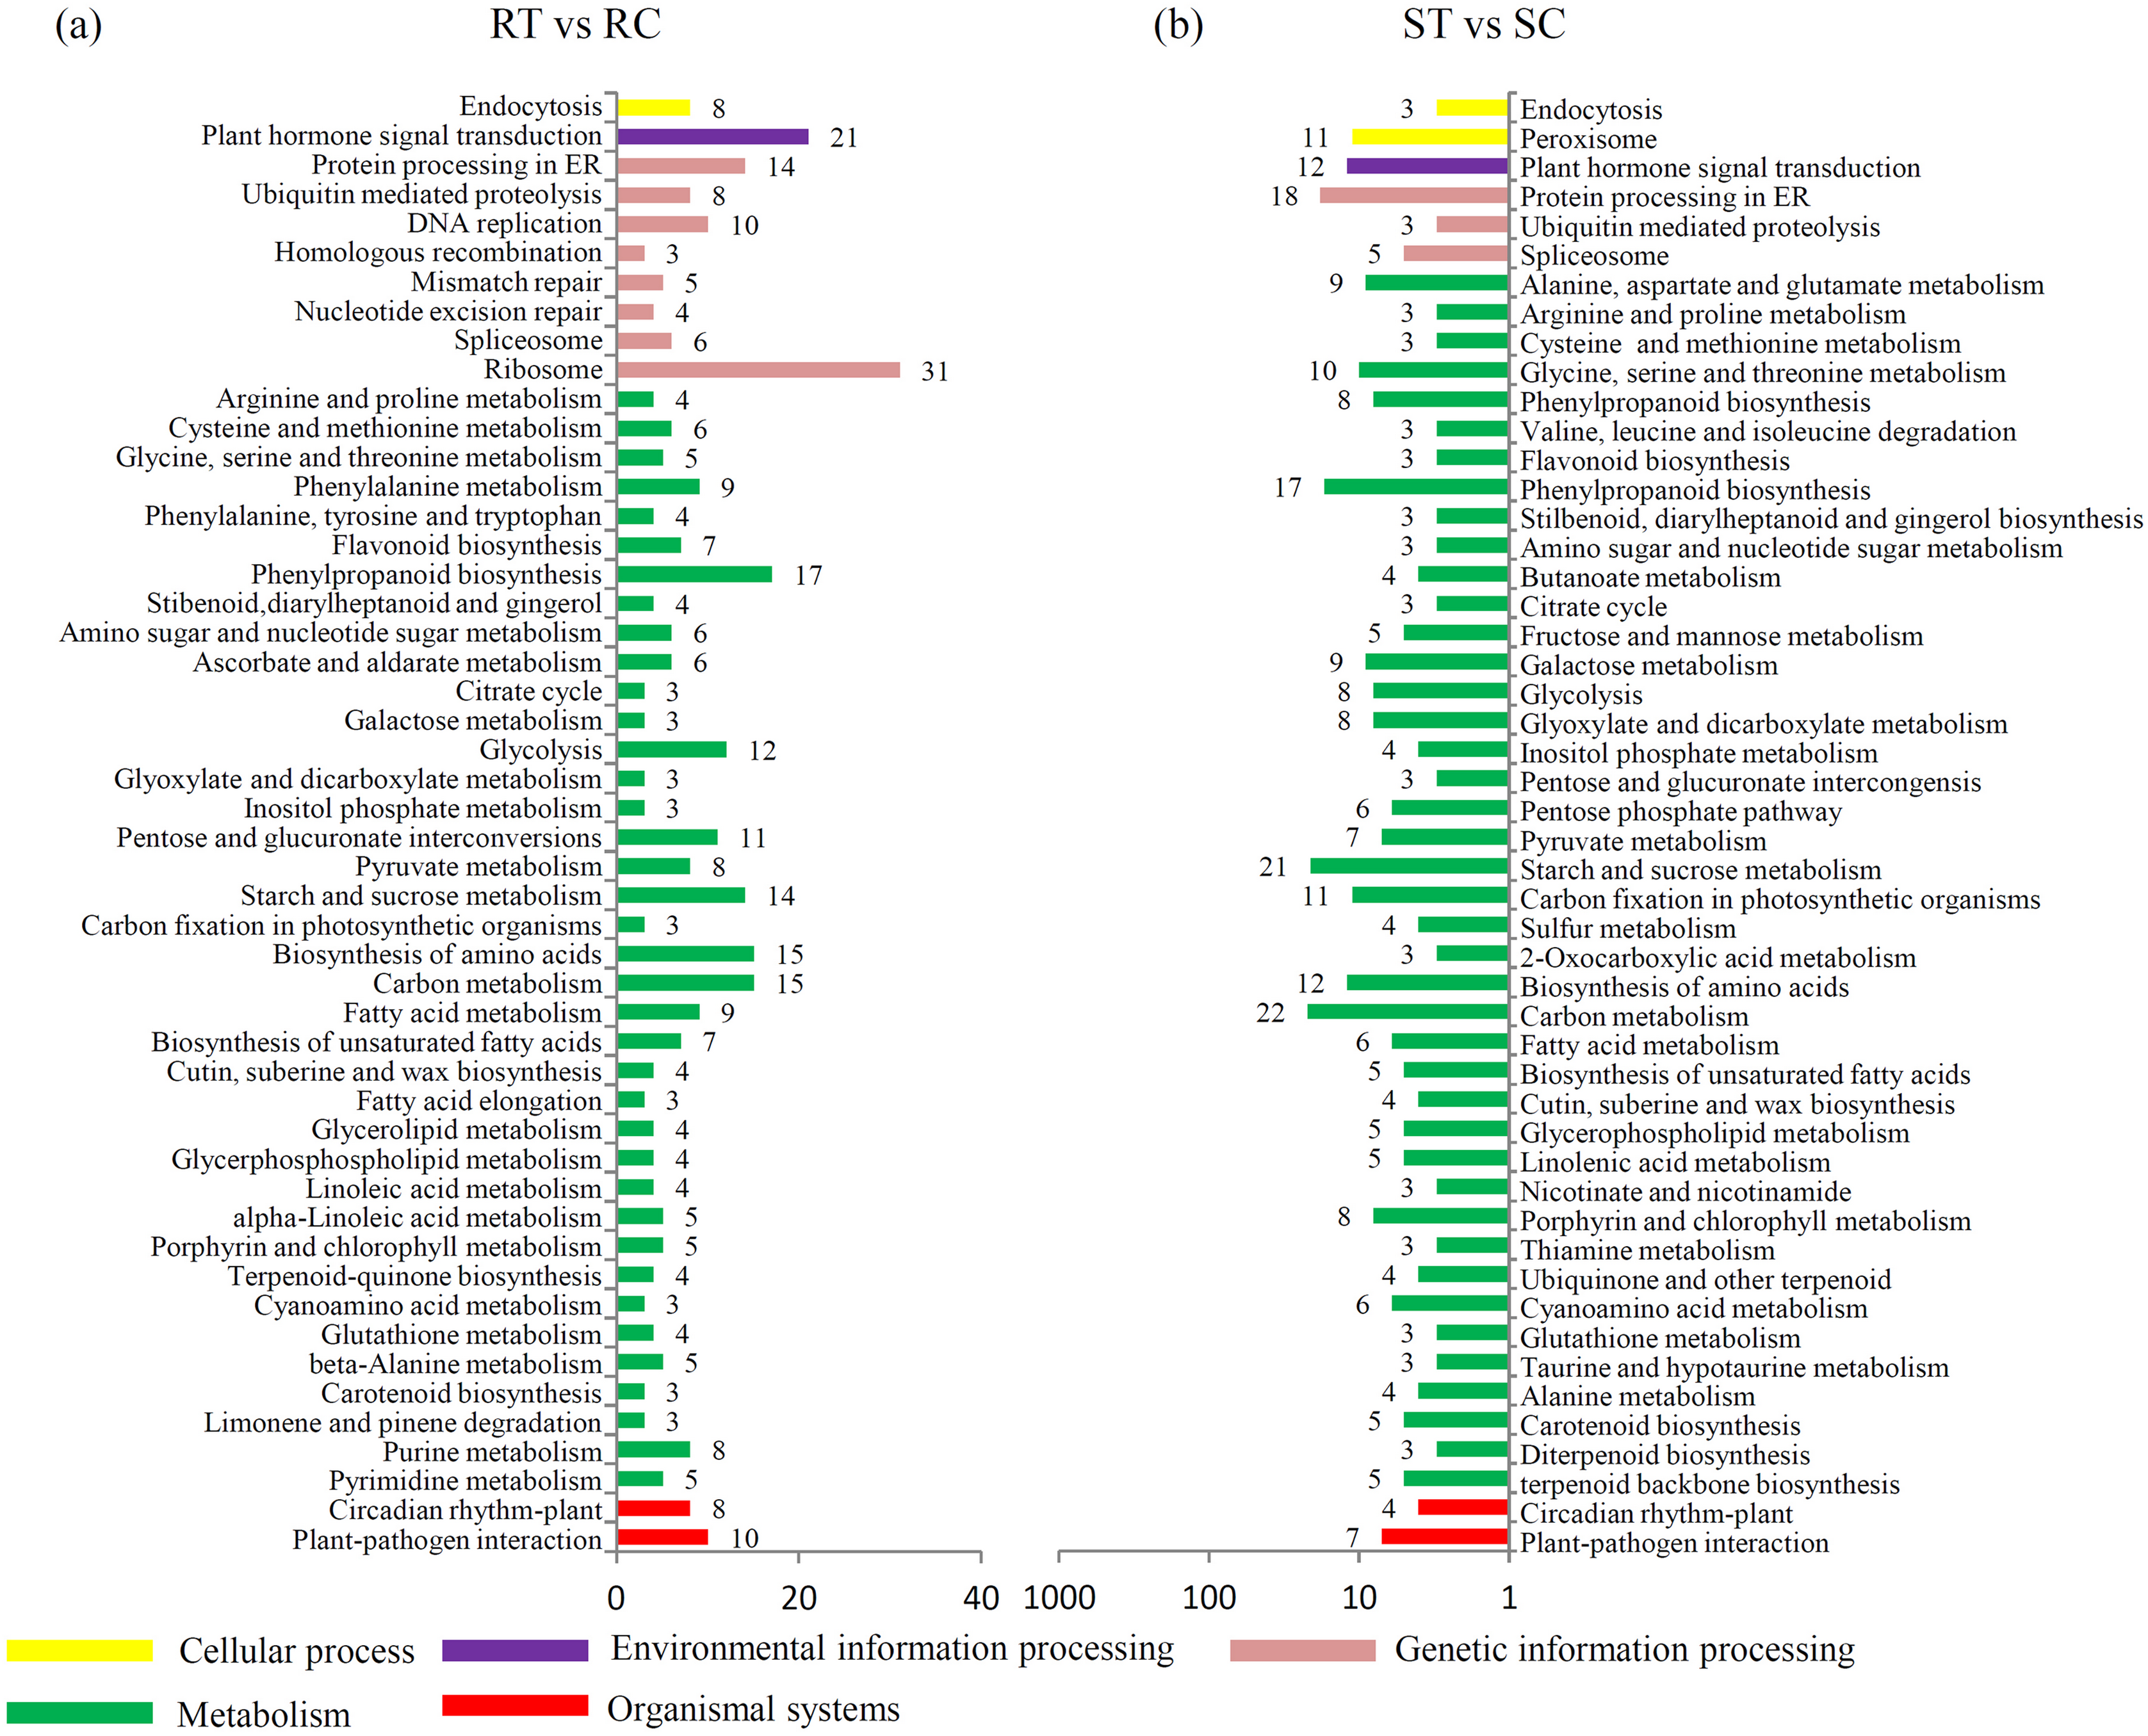
Furthermore, the DEGs in the RT vs ST comparison were analyzed, and the top 20 enriched KEGG terms are shown in Fig. 4A. In total, 154 DEGs were classified into the “ribosome” term, 49 DEGs to the “plant hormone signal transduction” term, 27 DEGs to the “starch and sucrose metabolism” term, 19 DEGs to the “biosynthesis of amino acids” term, and 19 DEGs to the “carbon metabolism” term.
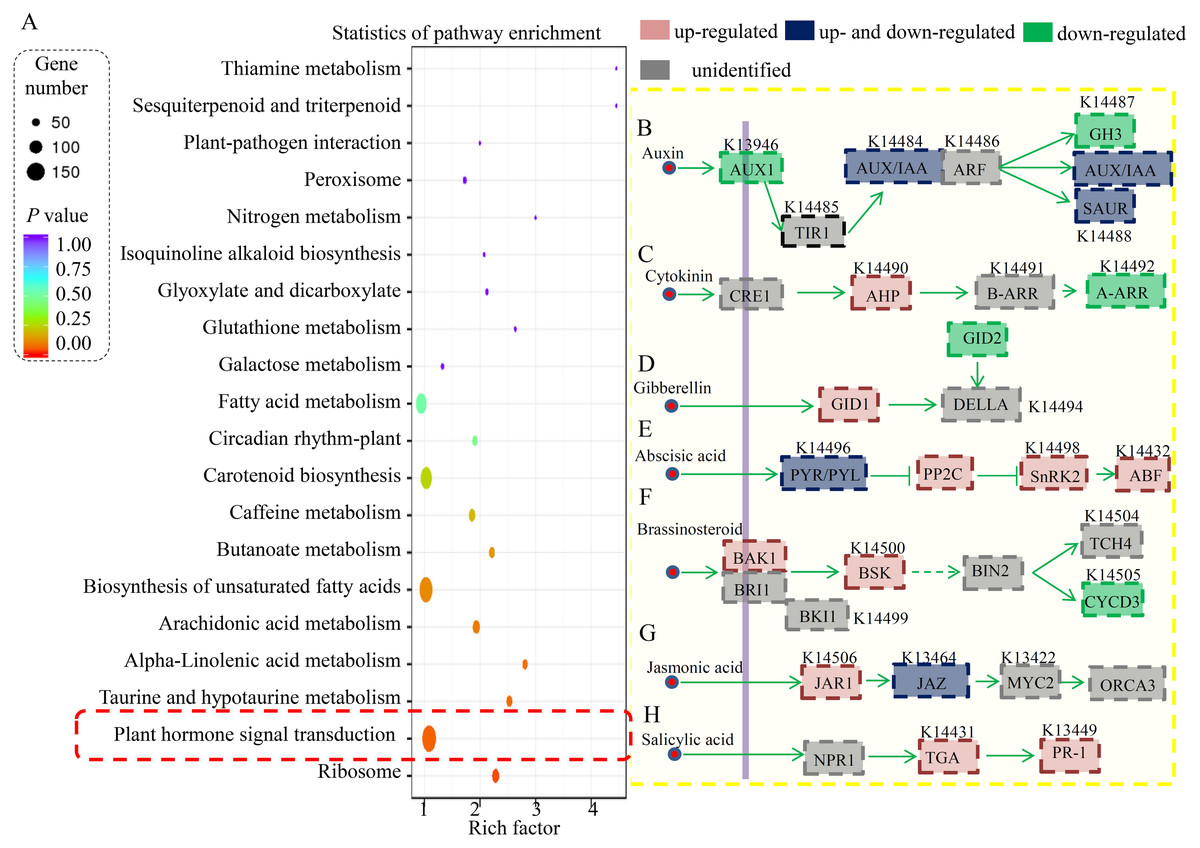
Figure 4: Identification and differential analysis of the hormonal network in cucumber.
(A) KEGG pathway enrichment analysis of the DEGs showed the top 20 enriched KEGG terms. Rich factor is the proportion of differentially expressed genes in all genes. (B–H) Overview of various hormonal signaling network in cucumber. Red indicated the ST predominantly expressed genes and green indicated the RT predominantly expressed genes.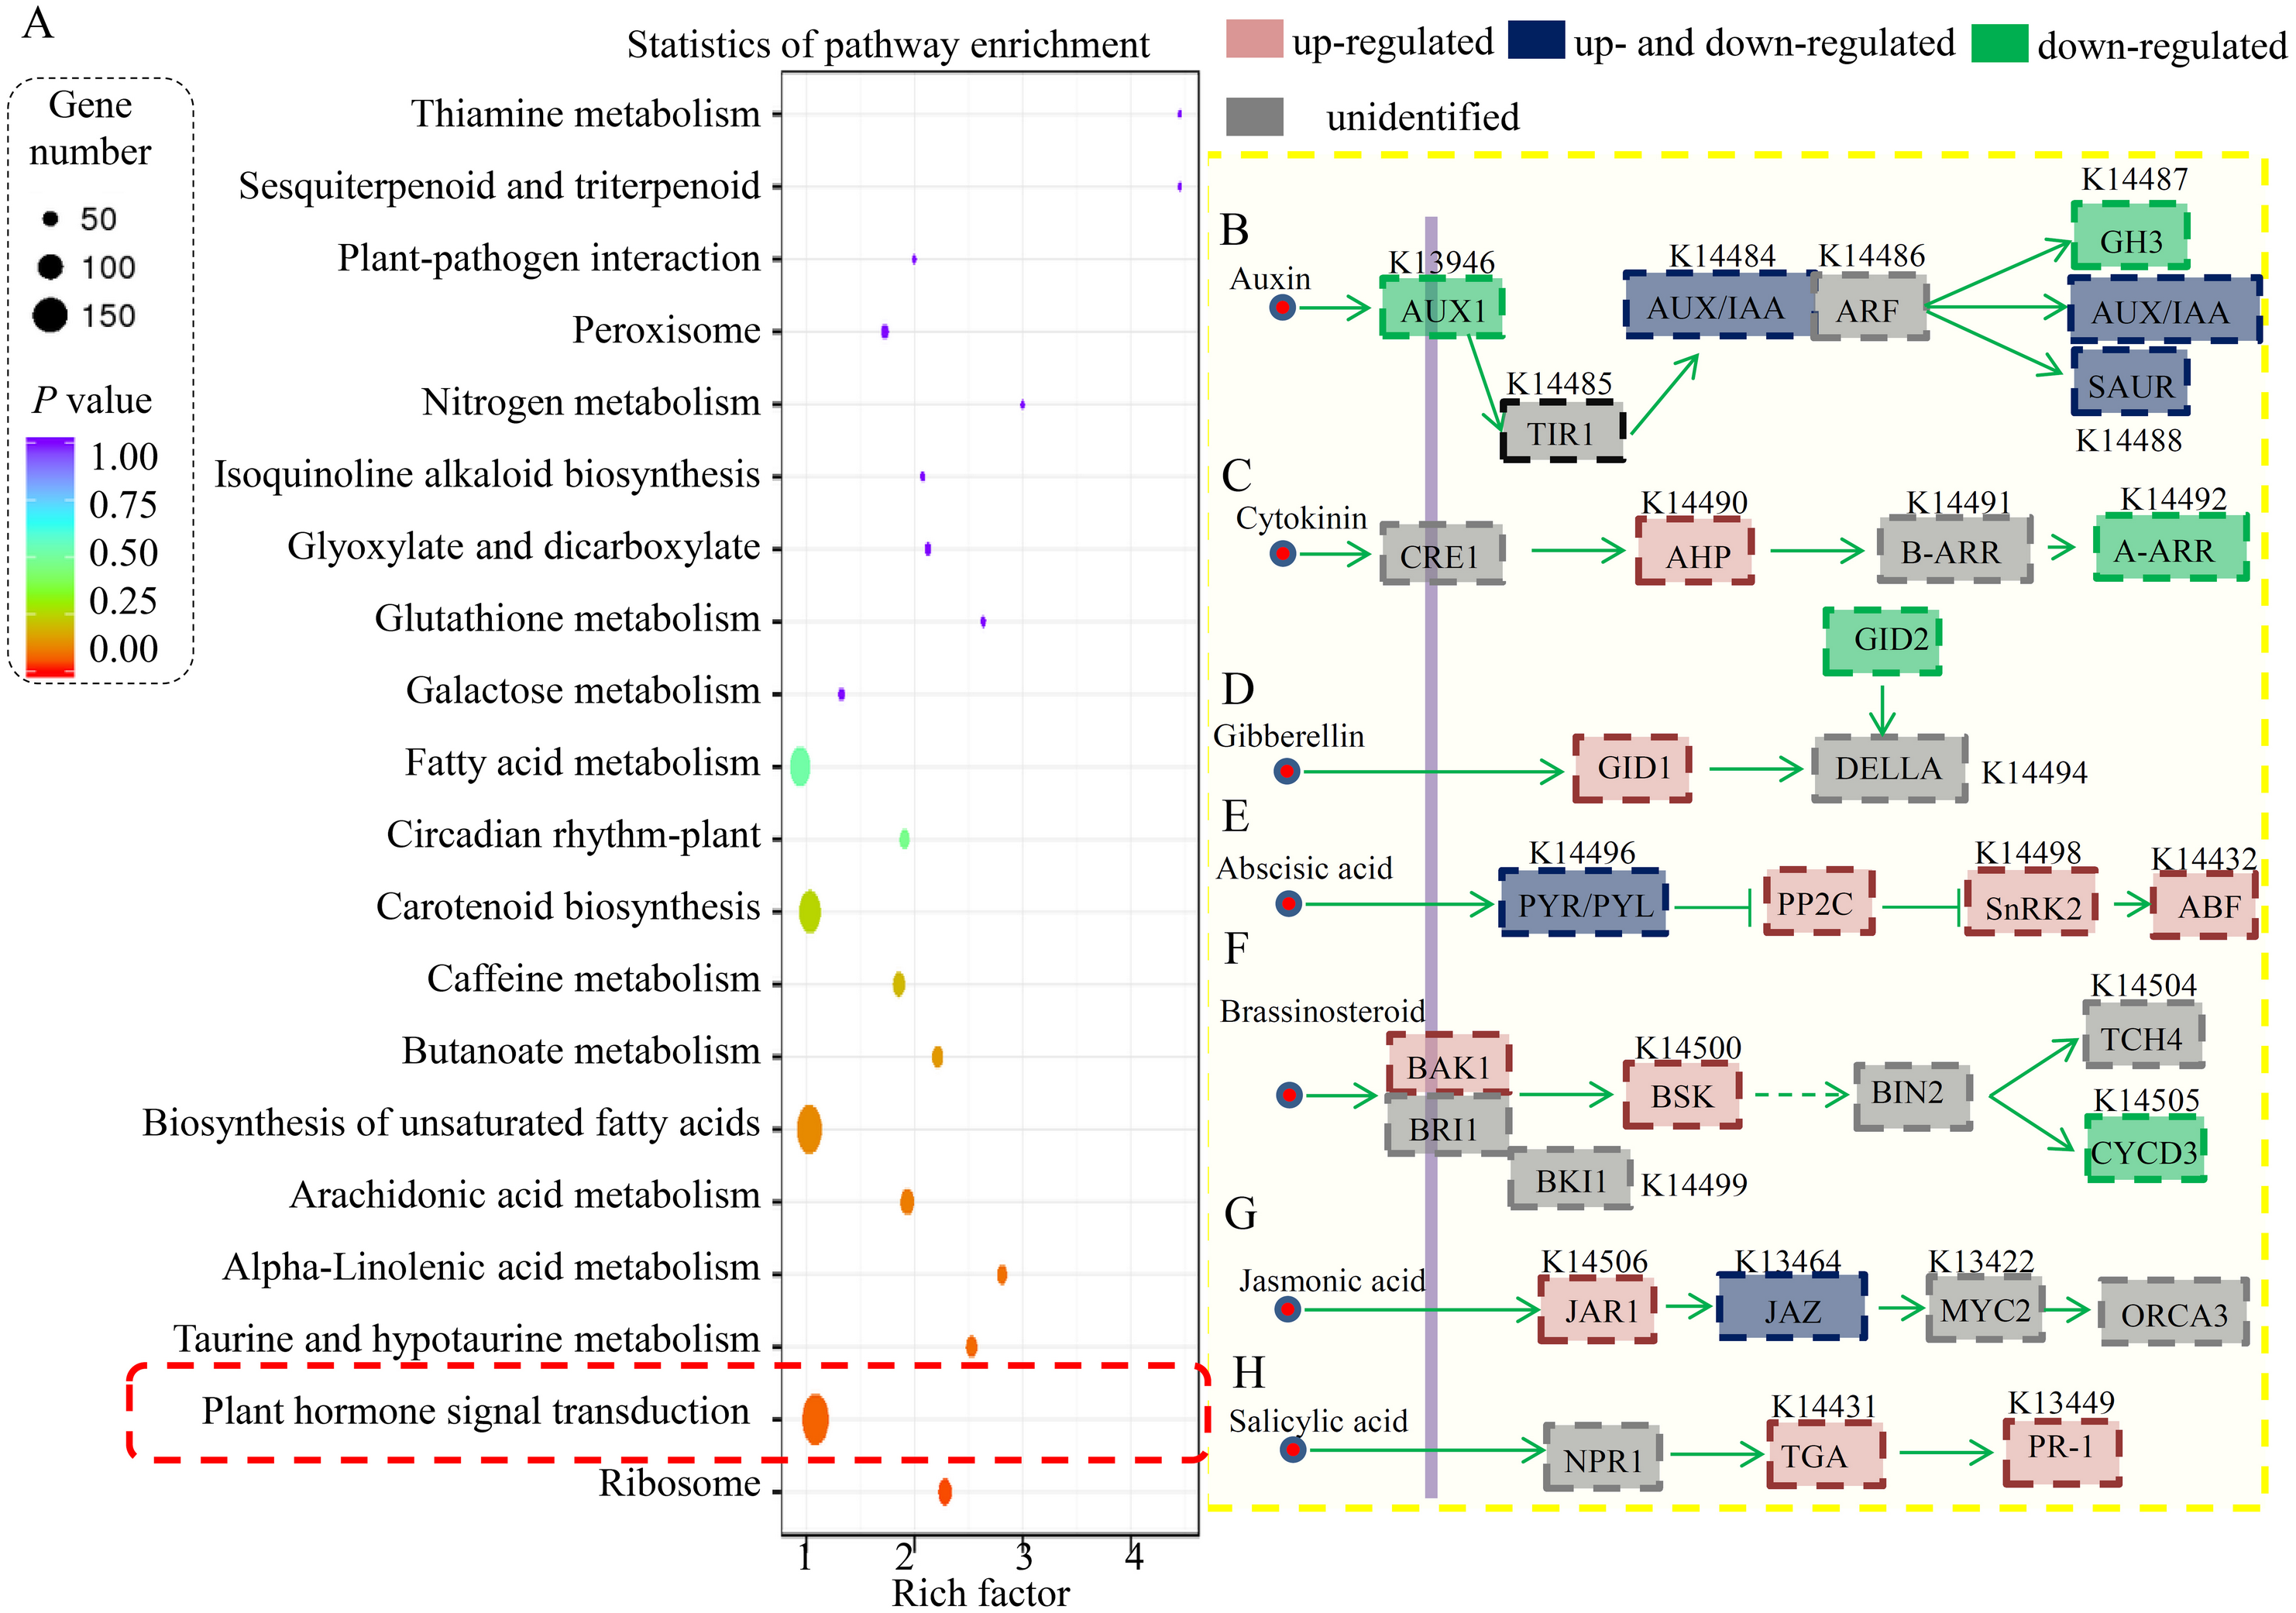
The involvement of hormone signaling in PM resistance
In our study, a large number of hormone-related DEGs (9.2% of all DEGs) were identified between the resistant and susceptible cucumber varieties during S. fuliginea infection. The KEGG analysis assigned most of the DEGs to key components involved in various hormonal signaling pathways, including those of auxin, cytokinin, gibberellin, ABA, brassinosteroid, JA and SA (Fig. 4B). For the auxin signaling pathway, one AUX1 (K13946) gene, one GH3 (K14487) gene, one AUX/IAA gene (K14484) and ten SAUR (K14488) genes were significantly down-regulated and two AUX/IAA genes and one SAUR gene were significantly up-regulated in ST compared with in RT. For the cytokinin signaling pathway, two AHP (K14490) genes were significantly up-regulated and three A-ARR (K14492) genes were down-regulated in ST compared with in RT. For the gibberellin signaling pathway, one GID1 (K14493) gene was significantly up-regulated and one GID2 (K14495) gene was significantly down-regulated in ST compared with in RT. For the ABA signaling pathway, two PYR/PYL (K14496) genes, five PP2C (K14497) genes, two SnRK2 (K14498) genes, and one ABF (K14432) gene were significantly up-regulated and four PYR/PYL (K14496) genes were significantly down-regulated in ST compared with in RT. For the brassinosteroid signaling pathway, one BAK1 (K14506) gene and one BSK (K14500) gene were significantly up-regulated and two CYCD3 (K14505) genes were significantly down-regulated in ST compared with in RT. For the JA signaling pathway, one JAR1 (K14506) gene and one JAZ (K13464) gene were significantly up-regulated and one JAZ gene was significantly down-regulated in ST compared with in RT. For the SA signaling pathway, two TGA (K14431) genes and one PR-1 (K13449) gene were significantly up-regulated in ST compared with in RT.
Identification of classical defense-related DEGs
In our study, a large number of defense-related genes were identified as DEGs during the S. fuliginea infection. In total, 49 NBS genes, 62 glucanase genes, 36 chitinase genes, and 152 peroxidase genes were identified in cucumber. Among the NBS-containing genes, five significantly up-regulated (Class I) and 14 significantly down-regulated (Class II) genes were identified. Among the glucanase genes, seven significantly up-regulated (Class I) and eight significantly down-regulated (Class II) genes were identified. Among the chitinase genes, six significantly up-regulated (Class I) and 15 significantly down-regulated (Class II) genes were identified, and among the peroxidase genes, 42 significantly up-regulated (Class I) and 19 significantly down-regulated (Class II) genes were identified (Fig. 5).
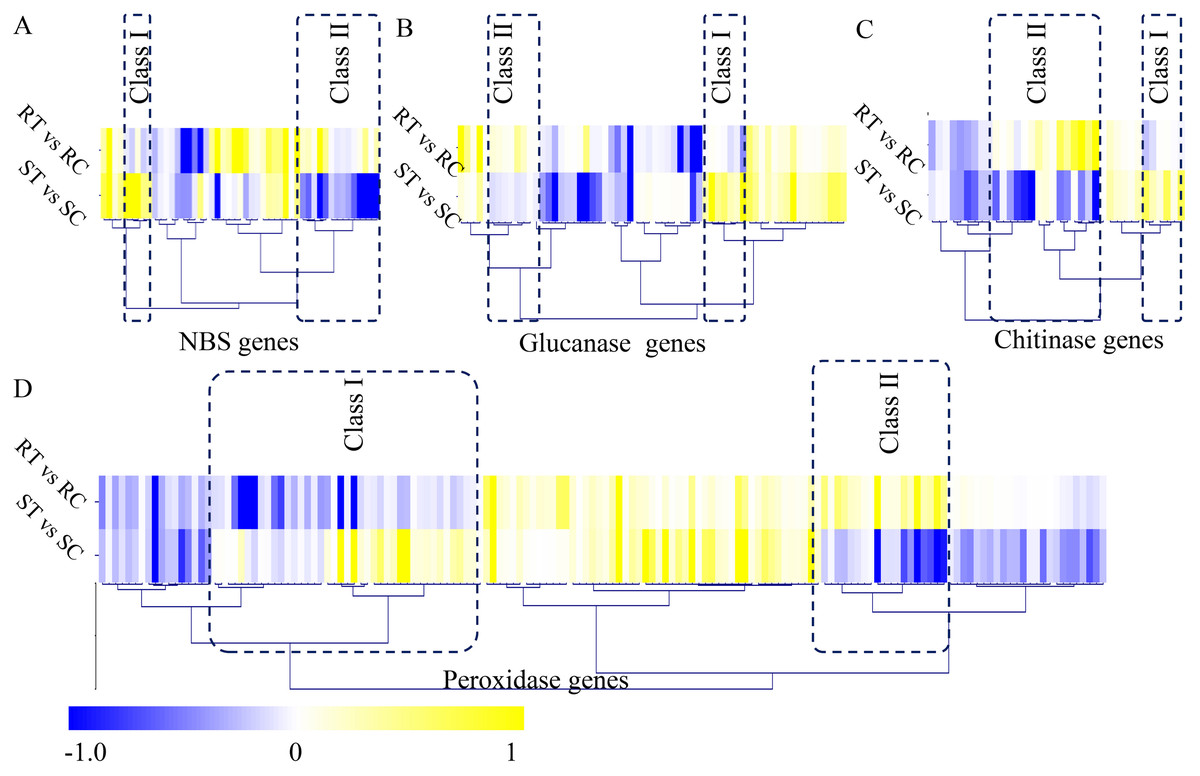
Figure 5: Identification of classical defense-related DEGs.
(A) Identification of differential expressed NBS genes between the resistant and susceptible cultivated varieties by S. fuliginea infection. (B) Identification of differential expressed glucanase genes between the resistant and susceptible cultivated varieties by S. fuliginea infection. (C) Identification of differential expressed chitinase genes between the resistant and susceptible cultivated varieties by S. fuliginea infection. (D) Identification of differential expressed peroxidase genes between the resistant and susceptible cultivated varieties by S. fuliginea infection. All the up-regulated genes were grouped into the Class I and all down-regulated genes were grouped into the Class II.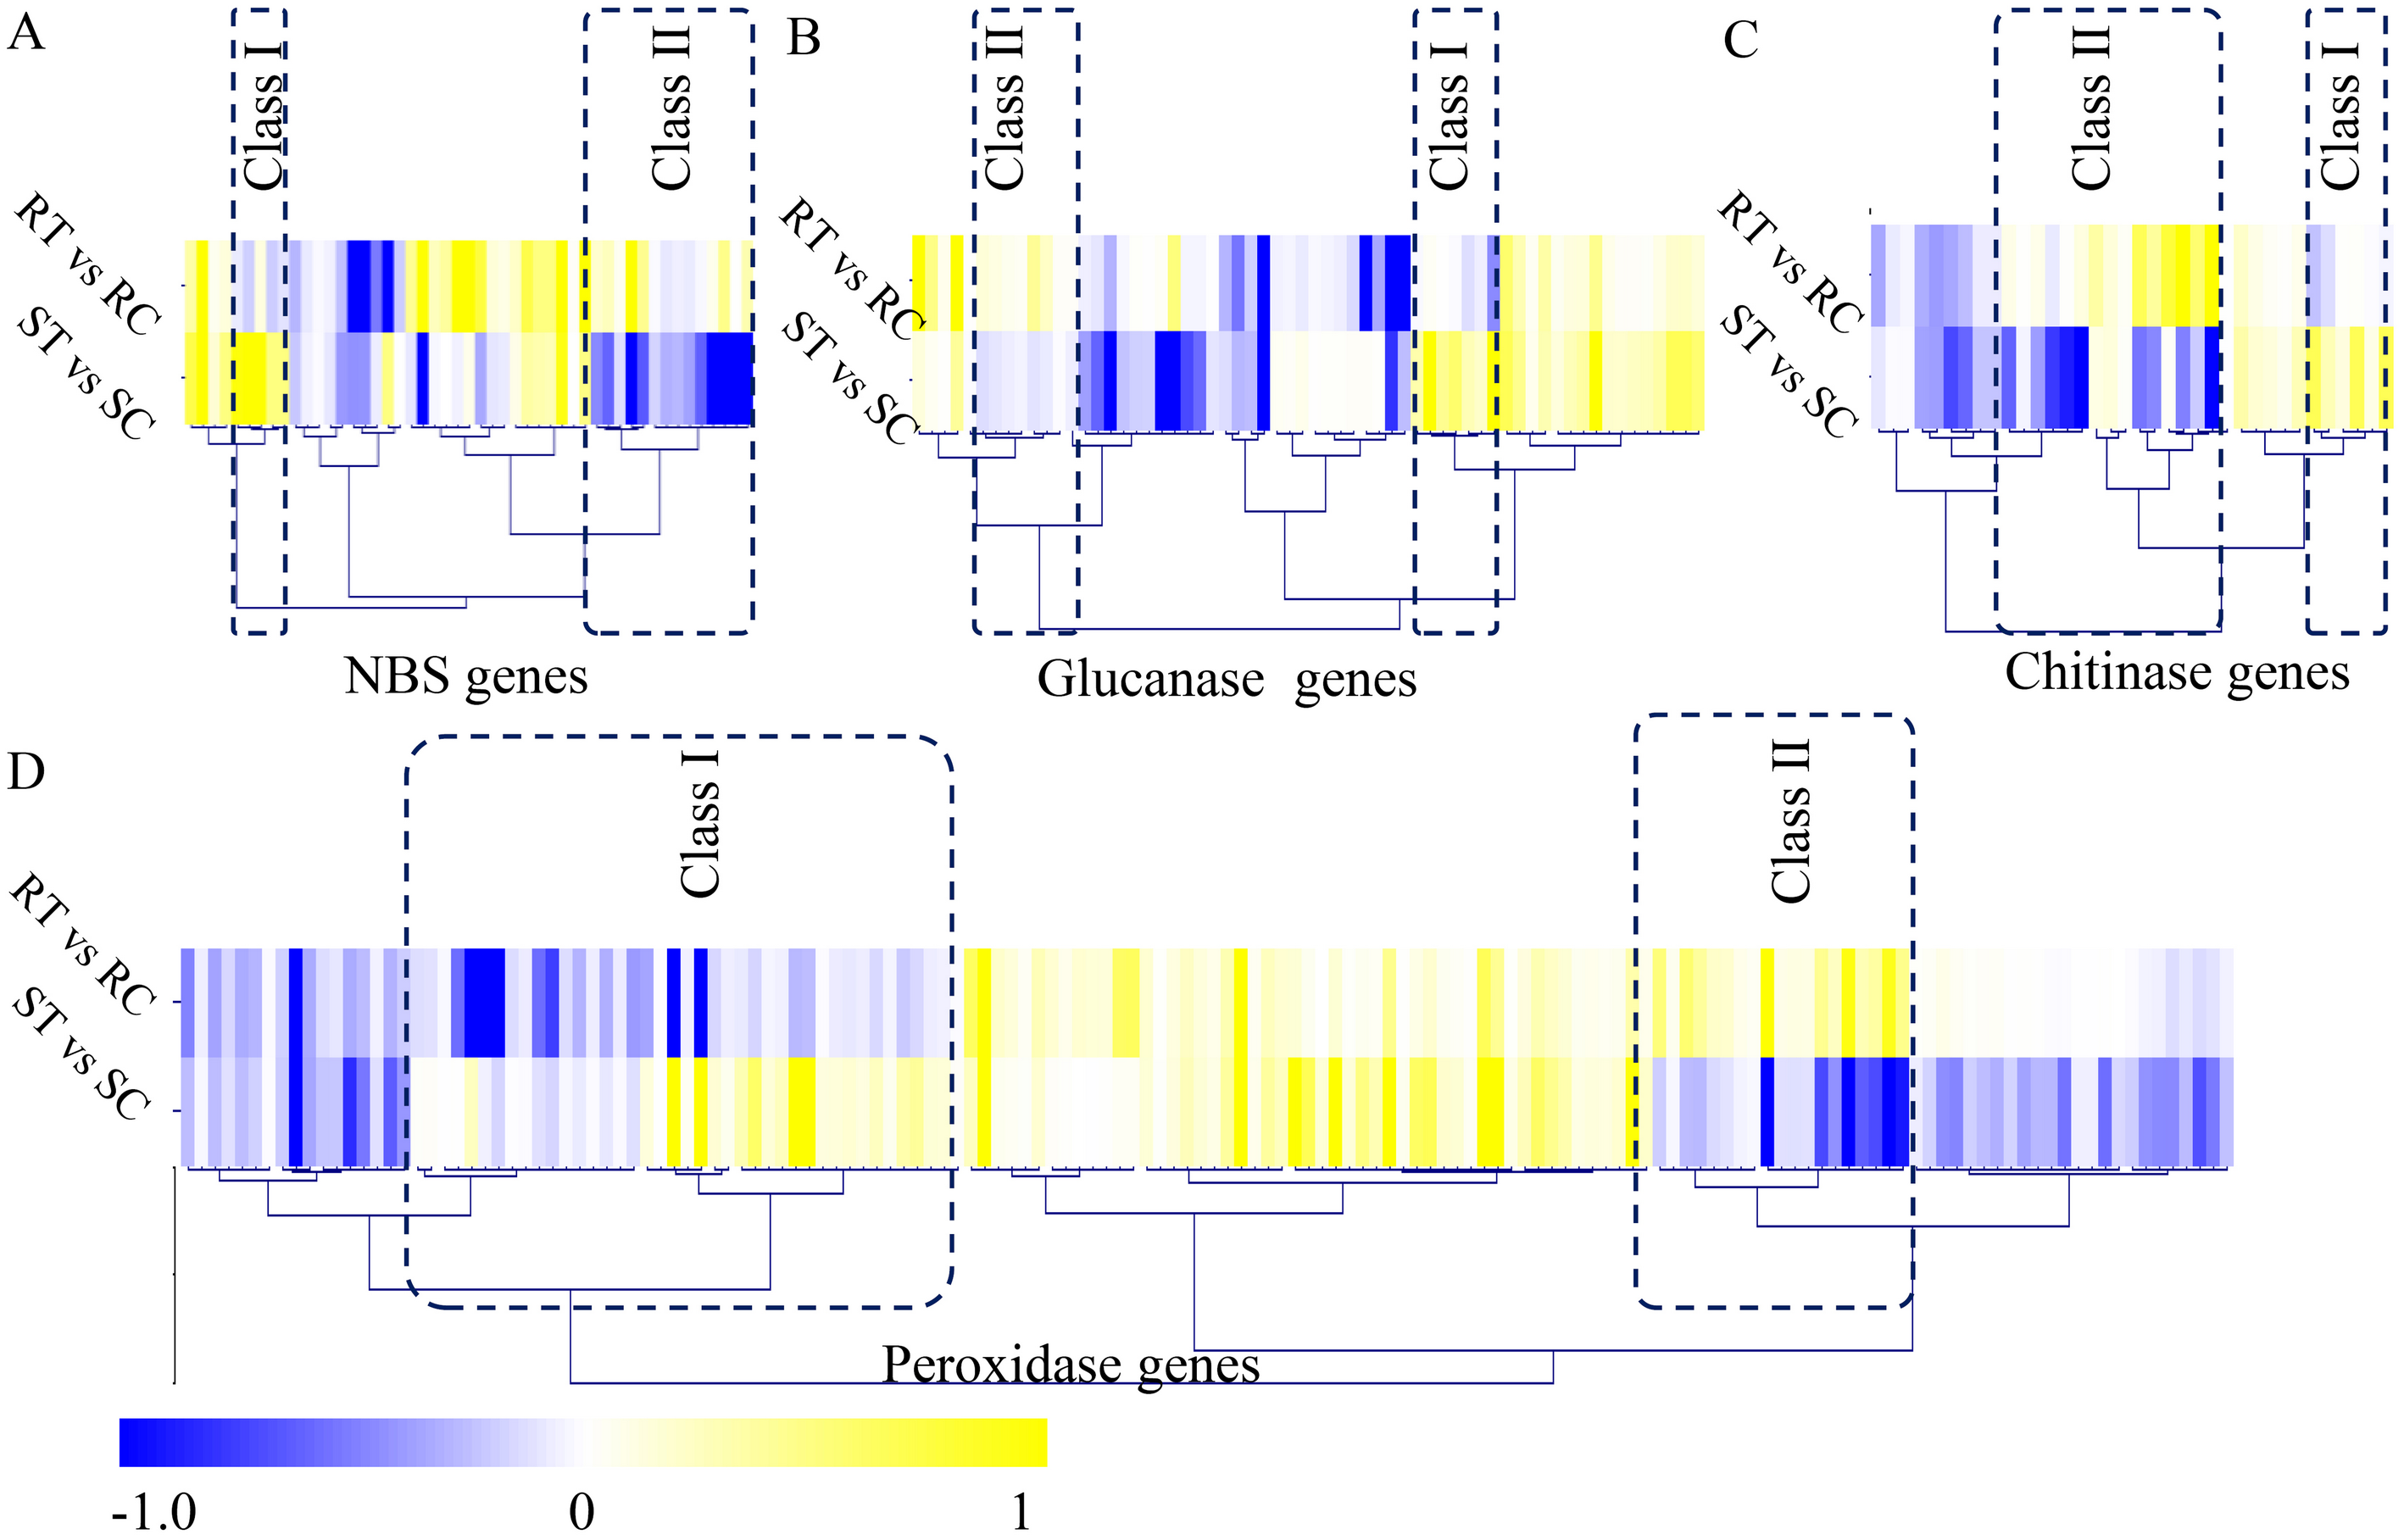
Validation of the expression levels of several key genes
To verify the changes in the expression levels of several important hormone- and defense-related genes, a qRT-PCR assay with independent samples was performed. In total, eight genes, including four hormone-related genes and four defense-related genes, were randomly selected to check the RNA-seq data (Fig. 6). Our qRT-PCR results basically confirmed the RNA-seq data. All the primer sequences are listed in Table S11.
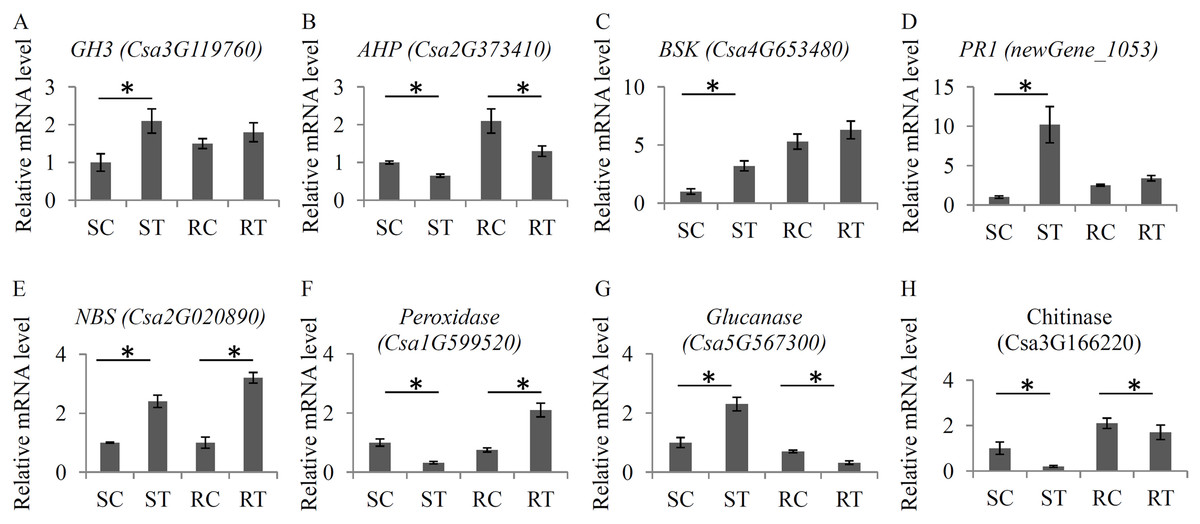
Figure 6: Validation of the expression levels of several key genes.
The relative expression levels of eight key genes under the S. fuliginea infection, including GH3 (A), AHP (B), BSK (C), PR1 (D), NBS (E), Peroxidase (F), Glucanase (G), and Chitinase (H). Each bar shows the mean ± SD (n = 3) of triplicates. The significantly changes (P < 0.05) in expression levels of these genes between the treatments and control were indicated by “_”.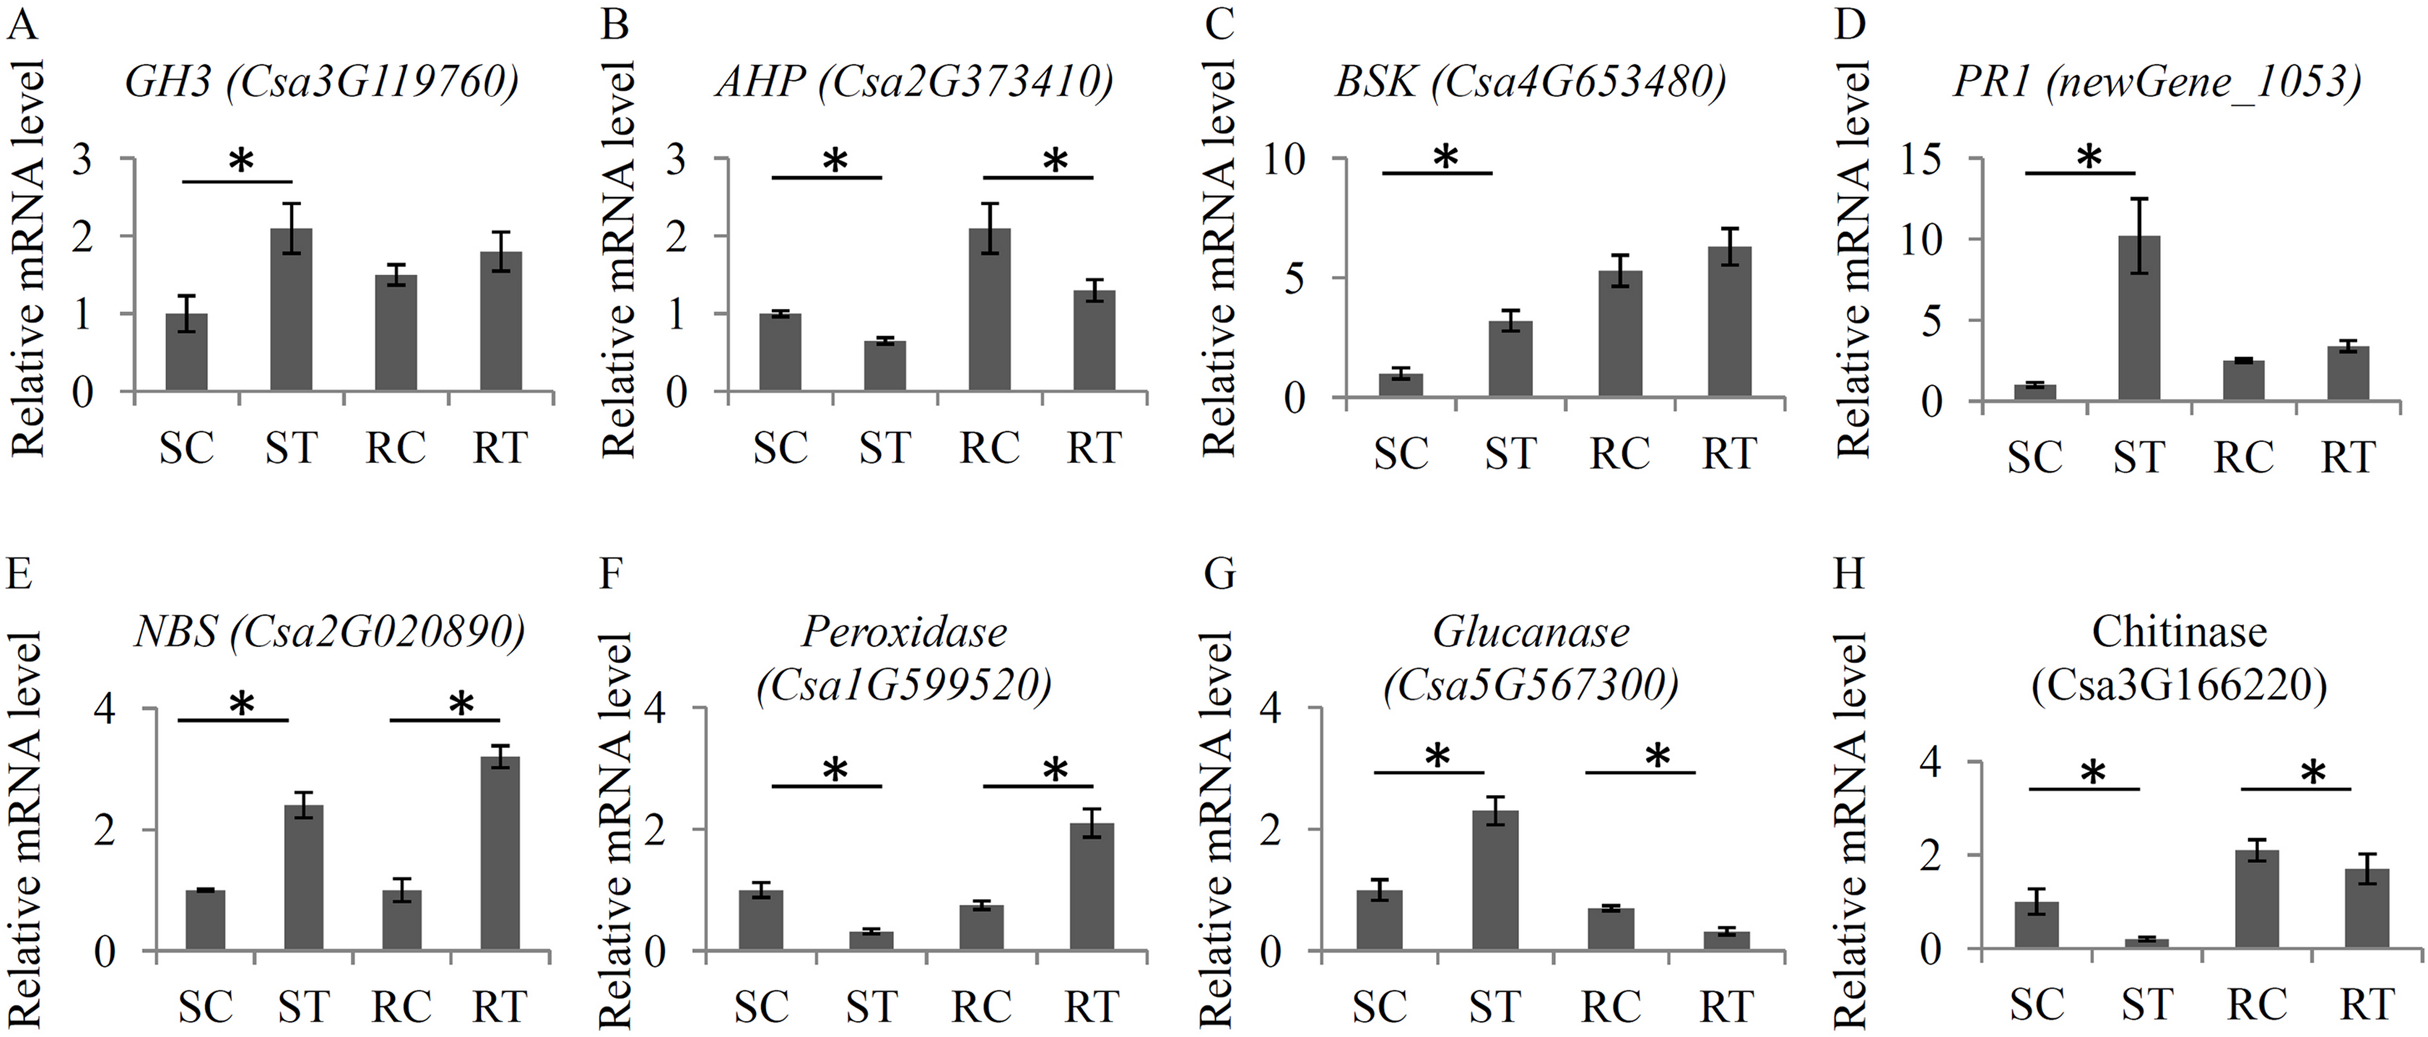
Discussion
The molecular and genetic mechanisms associated with host resistance to PM have been investigated to a limited extent in cucumber. Understanding the genes that are responsive to PM will help reveal the regulatory mechanism underlying PM resistance. In 2011, a transcriptomic study identified 87 DEGs associated with resistance to the PM pathogen in cucumber (Li et al., 2011). In 2012, up to 3,286 genes were differentially expressed in pair-wise comparisons between different post-inoculation time points (Adhikari et al., 2012). In our study, two cultivated cucumber varieties were used for RNA-seq, and they revealed variety-specific transcriptional responses to PM.
The comparison of basal gene expression levels in resistant and susceptible cultivated varieties under the control condition revealed only 86 DEGs, suggesting tiny variations for most of the identified genes (Fig. 2B). During S. fuliginea infection, substantial variations in the expression levels of thousands of genes were observed between resistant and susceptible cultivated cucumber varieties. A large number of plant hormone signal transduction-related genes were identified as DEGs in the ST vs RT comparison. Changes in phytohormone accumulation profiles differed between resistant and susceptible Vitis amurensis cultivars, suggesting the involvement of hormones in PM resistance (Yin et al., 2017). For example, grape PM resistance is affected by various hormones, including ethylene, JA, SA, and ABA (Denancé et al., 2013). In our study, the genes encoding PP2C, SnRK2 and ABF were significantly affected by the S. fuliginea infection, suggesting an involvement of ABA signaling pathway in PM resistance. JAR1-mediated JA signaling pathway plays important roles in activating plant defenses (Kang et al., 2006). In cucumber, expression of the genes encoding JAR1 was significantly changed during the S. fuliginea infection, indicating the presence of JA-isoleucine-mediated defenses against S. fuliginea. Our data provide comprehensive information on hormone signaling pathway genes under S. fuliginea infection in cucumber.
The roles of auxin during interactions between plant pathogens and their hosts have been studied (Hussain, Ullah & Hasnain, 2017). Many plant pathogen infections elevate free IAA levels or enhance auxin signaling (Kunkel & Harper, 2018). In cucumber, microRNA160b and its downstream target gene, AUXIN RESPOINSE FACTOR 16 (Csa6M445210.1), are responsive to pathogen infection (Jin & Wu, 2015). During S. fuliginea infection, most auxin signaling pathway-related genes, including one AUX1 gene, one AUX/IAA gene, one GH3 gene, and ten SAUR genes, were significantly expressed in the cultivated resistant variety, suggesting an enhancement in auxin signaling during PM resistance. SA is another important hormone involved in innate immunity (Huang et al., 2018). In soybean (Glycine max), GmMPK4-silenced plants showed more resistance to PM and accumulated higher SA levels, suggesting a close relationship between the SA level and the resistance to PM (Liu et al., 2011). In our study, two TGA (Csa2G403160 and Csa6G031950) genes and one PR-1 (Cucumber_newGene_1053) gene were significantly expressed in ST compared with in RT, indicating essential roles in PM resistance in cucumber. In Arabidopsis, the JA signaling pathway is an intrinsic component within the host’s defense system (Zhang et al., 2017). The expression levels of several MAPK, MAPKK and MAPKKK genes were significantly affected by pathogen infections and JA treatments (Wang et al., 2015). In our study, three key JA-related genes, one JAR1 and two JAZ genes, were identified as DEGs between resistant and susceptible cultivated varieties, suggesting a role for JA signaling in PM resistance. JAZ1 is essential for pathogen defense and wound response (Suza & Staswick, 2008). In the resistant cucumber variety, the expression level of JAZ1 (Csa3G119760) was higher than in the susceptible variety, which suggested that inhibiting JA signaling might contribute to PM resistance.
Resistance mechanisms involve numerous variations in biochemical and physiological functions during plant responses to pathogens (Taheri & Kakooee, 2017). A large number of defense-related genes have been revealed in model plants. For example, several cucumber NBS-containing genes are involved in the reorganization of cognate pathogen effector proteins and their perturbations (Bent & Mackey, 2007). Other defense-related genes, such as peroxidases, chitinases, and glucanases, may be associated with the initiation of resistance signaling after pathogen infection (Xue, Charest & Jabaji-Hare, 1998). In our study, the expression levels of a number of defense-related genes were affected in both the resistant and susceptible cultivated cucumber varieties by S. fuliginea infection.
Furthermore, the generation and removal of reactive oxygen species (ROS) are affected by pathogen infection, and uncontrolled ROS accumulation enhances the susceptibility of plants to pathogens (Vellosillo et al., 2010). Peroxidases are involved in scavenging ROS, such as H2O2, in infected plant cells (Barna et al., 2012). In our study, 42 peroxidase genes (Class I) were only induced in the susceptible cultivated variety, while 19 peroxidase genes (Class II) were only induced in the resistant cultivated variety (Fig. 5D). The differential expression of peroxidase genes might contribute to PM resistance. Glucanase genes, members of the PR-2 family, are significantly up-regulated by pathogen inoculation and are involved in plant pathogen defense (Su et al., 2016). Glucanases produced by plant hosts enhance the degradation of the oomycete cell wall (York, Qin & Rose, 2004). Chitinases, members of the PR family, are responsible for the hydrolysis of chitin, a major component of the cell walls of many fungal pathogens (Patel & Goyal, 2017). In our study, the S. fuliginea infection induced more glucanase and chitinase genes in the resistant cultivated variety than in the susceptible cultivated variety, suggesting that the enhanced resistance to pathogens in cucumber might involve the accelerated degradation of the pathogen’s cell walls.
PR genes are also up-regulated by the application of plant hormones, such as ethylene, JA, and SA (Sels et al., 2008). During pathogen infections, activated hormone signaling promotes the expression levels of PR genes, which might play a role in pathogen resistance (Tang et al., 2017). In our study, the PR genes, such as PR2 (Csa3G099760), PR17 (Csa7G072790), PR1 (Csa1G420360) and PR4 (Csa2G010370), were identified as DEGs. Expression analysis showed that SA-mediated stress- and pathogenesis-related defenses play an essential role in the responses to S. fuliginea infection. Our data suggested that PM resistance was controlled by a complex network consisting of various hormone signaling pathways.
Conclusions
Under S. fuliginea infection, there were great differences in the expression of genes related to hormone signaling, peroxidase and cell wall degradation between the resistant and susceptible cultivated varieties. Our data allowed us to identify and analyze more potential genes related to PM resistance, accelerating the breeding for disease resistance in cucumber.