
Evaluation of variation within the barcode region of Cytochrome c Oxidase I (COI) for the detection of commercial Callinectes sapidus Rathbun, 1896 (blue crab) products of non-US origin
- Published
- Accepted
- Received
- Academic Editor
- Rogerio Sotelo-Mundo
- Subject Areas
- Aquaculture, Fisheries and Fish Science, Biogeography, Food Science and Technology, Marine Biology, Molecular Biology
- Keywords
- Barcoding, Crustacea, Decapoda, Portunidae, Seafood, Species substitution, Swimming crab
- Licence
- This is an open access article distributed under the terms of the Open Government License.
- Cite this article
- 2019. Evaluation of variation within the barcode region of Cytochrome c Oxidase I (COI) for the detection of commercial Callinectes sapidus Rathbun, 1896 (blue crab) products of non-US origin. PeerJ 7:e7827 https://doi.org/10.7717/peerj.7827
Abstract
Callinectes sapidus Rathbun, 1896 is a western Atlantic species with a disjointed natural geographic range from Massachusetts, USA to Venezuela (distribution area 1) and from Alagoas, Brazil to northern Argentina (distribution area 2). It is the only species of portunid crab commercially harvested in the continental United States but is also imported into the US from several Latin American countries, Venezuela and Mexico in particular. In the United States, crab products labeled as “blue crab” and “Product of the USA” may not legally contain other species of crab or C. sapidus not harvested in the United States. The present study documents nucleotide variation within the barcode region of cytochrome c oxidase I (COI) in 417 reference specimens of C. sapidus collected from throughout its natural range. The goal of this study is to determine if this variation can be utilized to detect mislabeled C. sapidus products sold in interstate commerce by comparing genetic signatures in reference specimens to those observed in commercial crabmeat labeled as “Product of the USA” and “Product of Venezuela.” In reference specimens, we observed high levels of genetic variation in the barcode region. However, three lineages were consistently observed with significant pairwise Fst values between the lineages. Lineage 1 was observed throughout the natural geographic range but predominated in the continental US and was the only lineage observed in the major crabmeat-producing states (MD, LA, VA, NC). Lineage 2 primarily occurred in the Caribbean region of distribution area 1 but was also infrequently encountered in the South Atlantic Bight region of the US coast. Finally, Lineage 3 was only observed in Brazilian waters and had the lowest haplotype and nucleotide diversity values. Lineages 1 and 2 were separated by a mean pairwise distance (p-distance) of 3.15%, whereas Lineage 3 had a mean p-distance of 2.55% and 1.35% to Lineages 1 and 2, respectively. Within lineage mean p-distances were 0.45%, 0.19%, and 0.07% for Lineages 1, 2, and 3, respectively. Among all vouchered reference specimens collected from the continental United States, Mexico, Puerto Rico, and Venezuela, we identified 22 phylogenetically informative sites that drive observed lineage divergences. Haplotypes identified from barcode COI sequences from commercial C. sapidus products labeled as originating from the US all aligned with haplotypes from Lineage 1 reference specimens and haplotypes from commercial products labeled as originating from Venezuela all aligned with Lineage 2, suggesting that these lineages may be useful for indicating whether products originate from the continental US or are imported when package labeling is in question.
Introduction
Callinectes sapidus: geographic range, taxonomic history, and commercial importance
The natural range of Callinectes sapidus Rathbun, 1896 is the broadest of any species in the genus. This range is disjointed, with one distribution (distribution area 1) extending from Massachusetts, USA south to Venezuela, and a second distribution (distribution area 2) beginning in Alagoas, Brazil and extending south to the northern coast of Argentina (Dos Santos & D’Inaco, 2004; Rodrigues et al., 2017) (Fig. 1). In the Mid-Atlantic region of the US, Maryland and Virginia in particular, C. sapidus has reached iconic status for both its economic and cultural value. Recent northward expansion of the North American range into the Gulf of Maine has been observed and attributed to warmer than usual ocean temperatures in higher latitudes (Johnson, 2015). In addition to its broad natural range, C. sapidus has been introduced to the eastern Atlantic Ocean, Mediterranean, Adriatic, North, and Baltic Seas as well as waters of Hawai’i and Japan via human-mediated transport (Benabdi, Belmahi & Grimes, 2019; Castejón & Guerao, 2013; Dulčić et al., 2011; Eldredge, 1995; Galil, 2008; Keskin & Atar, 2013; Nehring, 2011; Perdikaris et al., 2015; Piras, Esposito & Meloni, 2019; Snovsky & Galil, 1990; Vasconcelos et al., 2019).
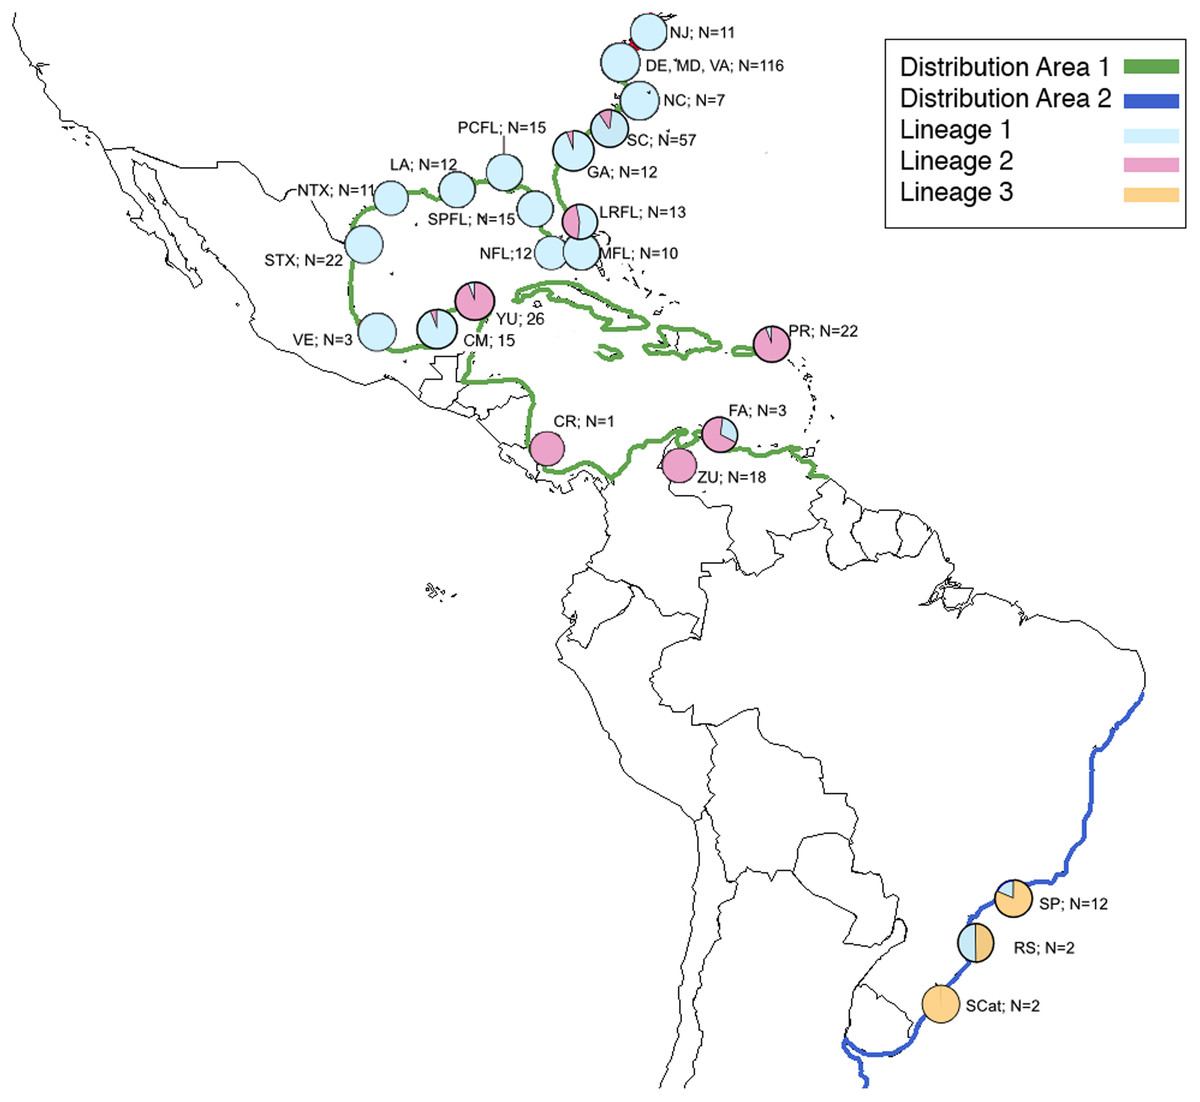
Figure 1: Map of natural distribution of C. sapidus along with collection locations and number of specimens successfully sequenced for this study showing proportion of each lineage in each location.
Map of natural distribution of C. sapidus along with collection locations and number of specimens successfully sequenced for this study showing proportion of each lineage in each location. Green, Distribution 1; dark blue, Distribution 2; light blue, Lineage 1; pink, Lineage 2; orange, lineage 3; NJ, New Jersey; DE, Delaware; MD, Maryland; VA, Virginia; NC, North Carolina; SC, South Carolina; GA, Georgia; LRFL, Loxahatchee River, Florida; MFL, Miami, Florida; NFL, Naples, Florida; SPFL, St. Petersburg, Florida; PCFL, Panama City, Florida; LA, Louisiana; NTX; northern Texas; STX, southern Texas; VE, Veracruz, México, CM, Campeche, México; YU, Yucatán, Mexico; CR, Costa Rica; ZU, Zulia, Venezuela; FA, Falcón, Venezuela; PR, Puerto Rico; SP, São Paulo, Brazil; RGS, Rio Grande do Sul, Brazil; SCat; Santa Catarina, Brazil.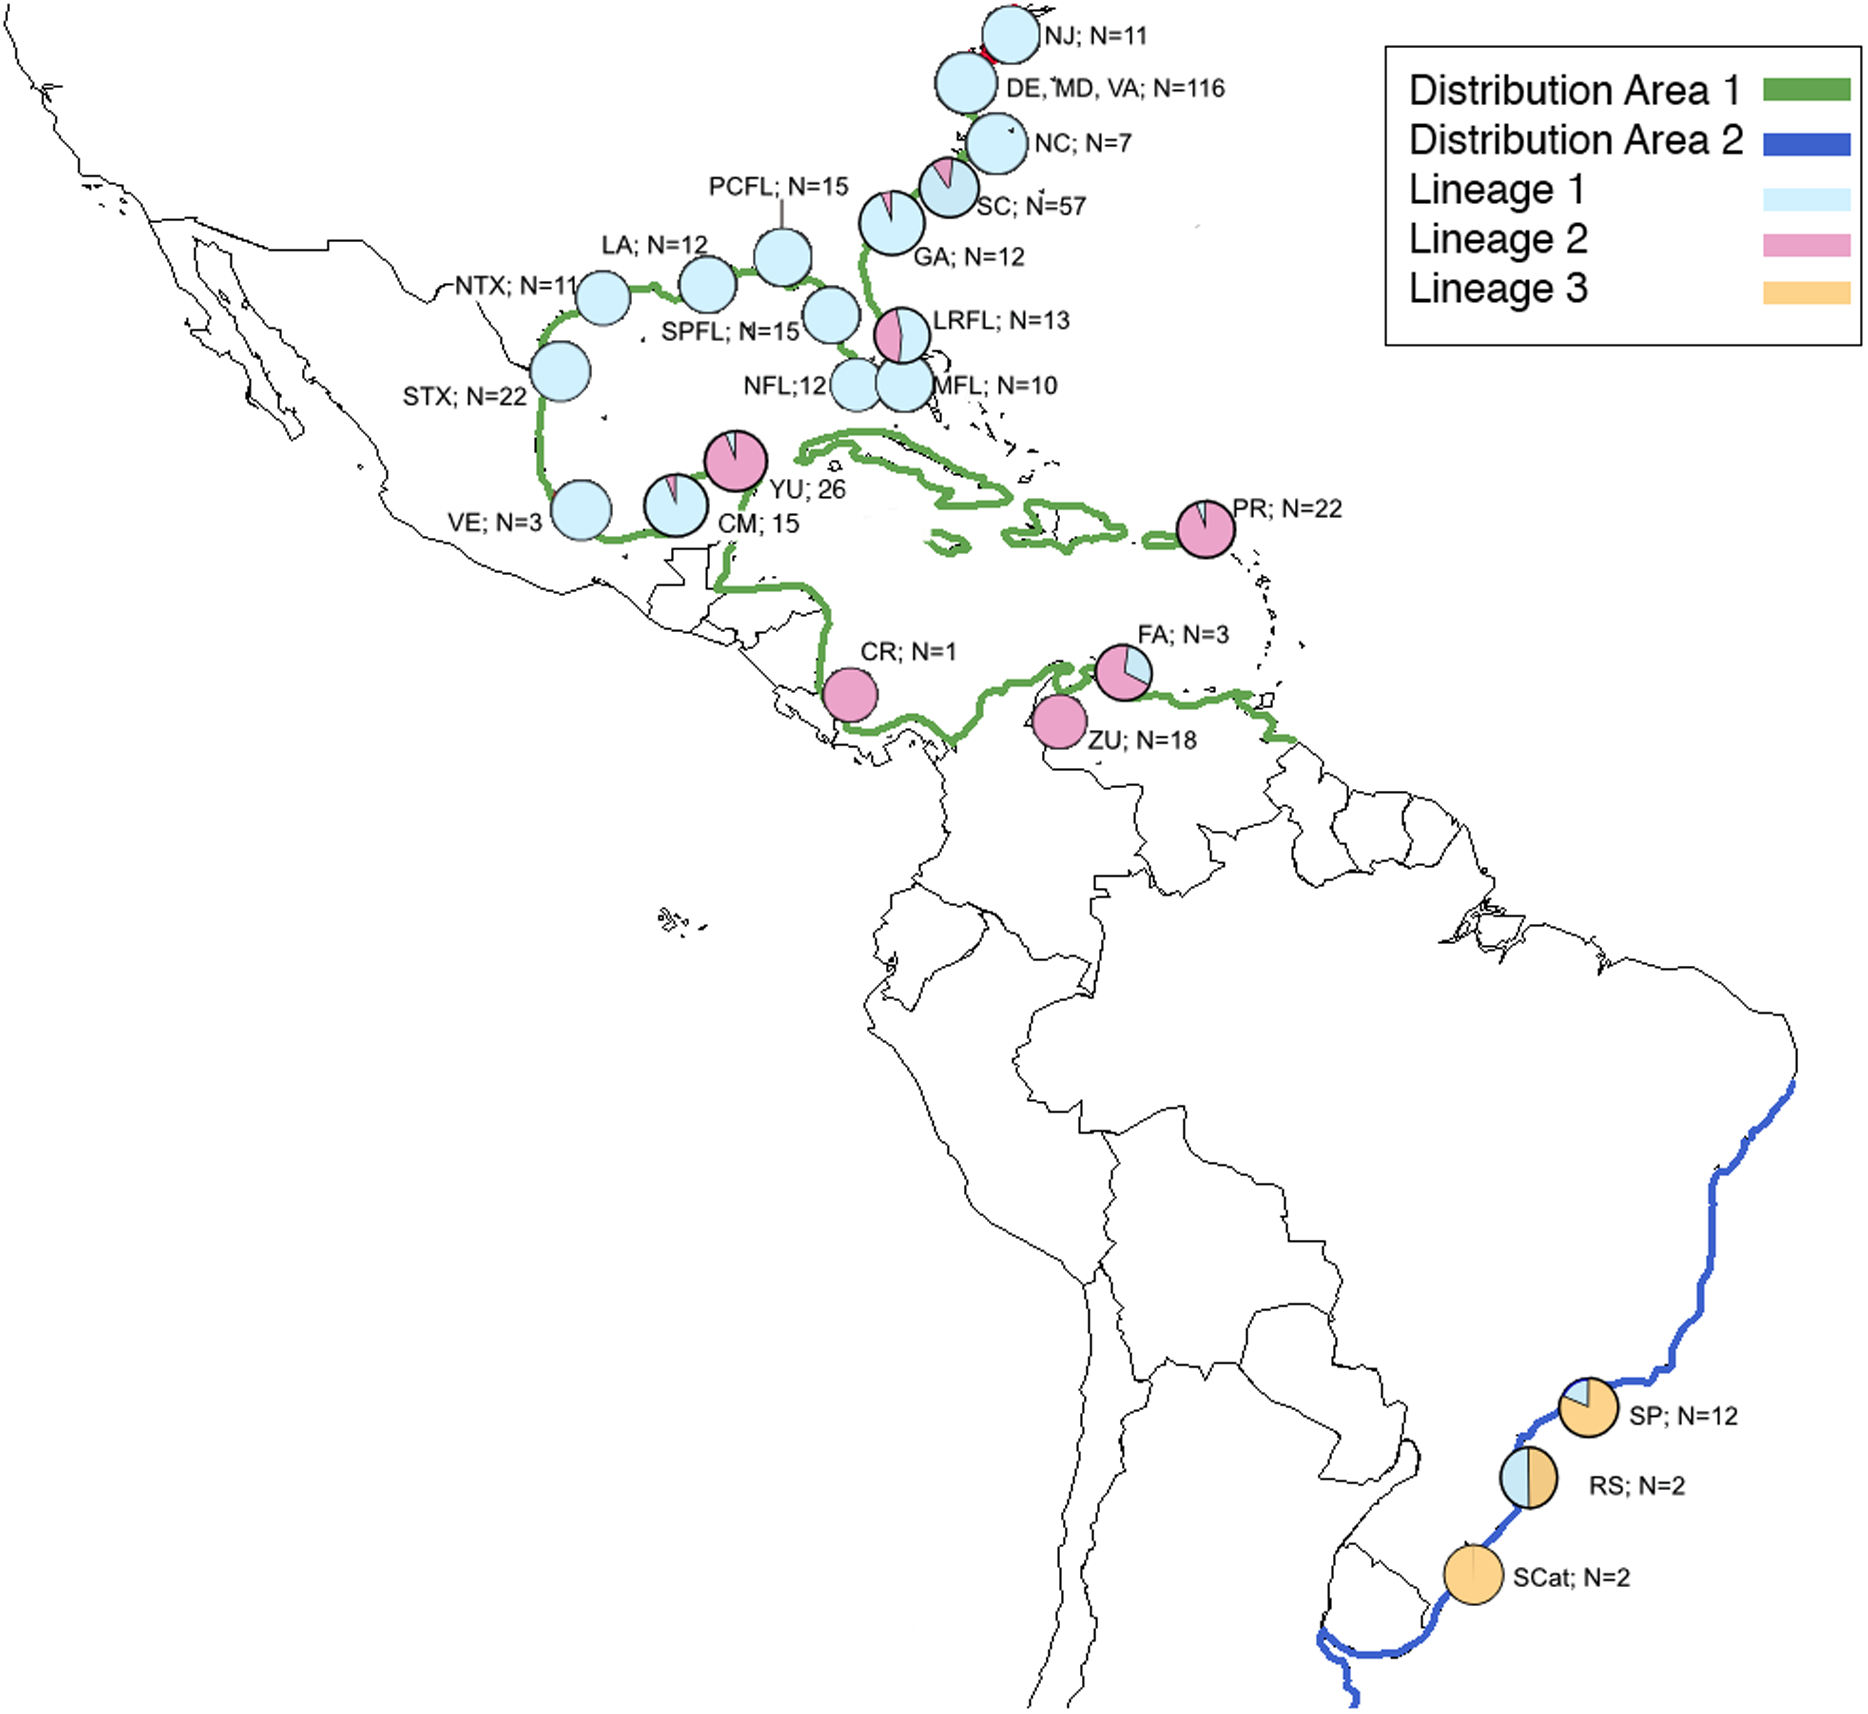
A review of the taxonomic history of C. sapidus revealed that the species was once divided into two subspecies, the “typical” C. sapidus sapidus and “acute” C. sapidus acutidens Rathbun, 1896 which was defined by its stronger carapace features and larger, more acute spines. This subspecies was first described from small specimens from Brazil and reportedly ranged from the east coast of Florida to the central coast of Brazil (Rathbun, 1930). However, Williams (1974) synomymized the two subspecies after examining over 1,500 specimens. He concluded that external morphology in C. sapidus is highly variable throughout its range and that morphological characters do not reliably segregate individuals putatively identified as C. sapidus acutidens from those identified as “typical” C. sapidus. Williams (1984) went on to characterize C. sapidus as a polymorphic species in which environmental factors may influence external carapace morphology.
Harvest of C. sapidus, both whole, live crabs for local consumption and processed crabmeat for domestic distribution, occurs in every US state on the Atlantic and Gulf coasts from Connecticut to Texas. However, >80% of harvest for production of processed crabmeat occurs in the states of Louisiana, Maryland, Virginia, and North Carolina (NOAA National Marine Fisheries Service Office of Science and Technology CFS, 2017b) (Fig. 2). In addition to domestic US harvest, C. sapidus is imported to the US, primarily as processed crabmeat, from throughout its natural range. Additionally, C. sapidus has become so well established in the eastern Mediterranean Sea that it is being harvested for both local consumption and export (Kevrekidis & Antoniadou, 2018; Piras, Esposito & Meloni, 2019). Crabmeat, regardless of species, is typically processed in such a way that species identification based on visual inspection is impossible, thus providing an opportunity for intentional species substitution and fraud if imported crabmeat is falsely sold to US consumers as domestic C. sapidus at a premium price.
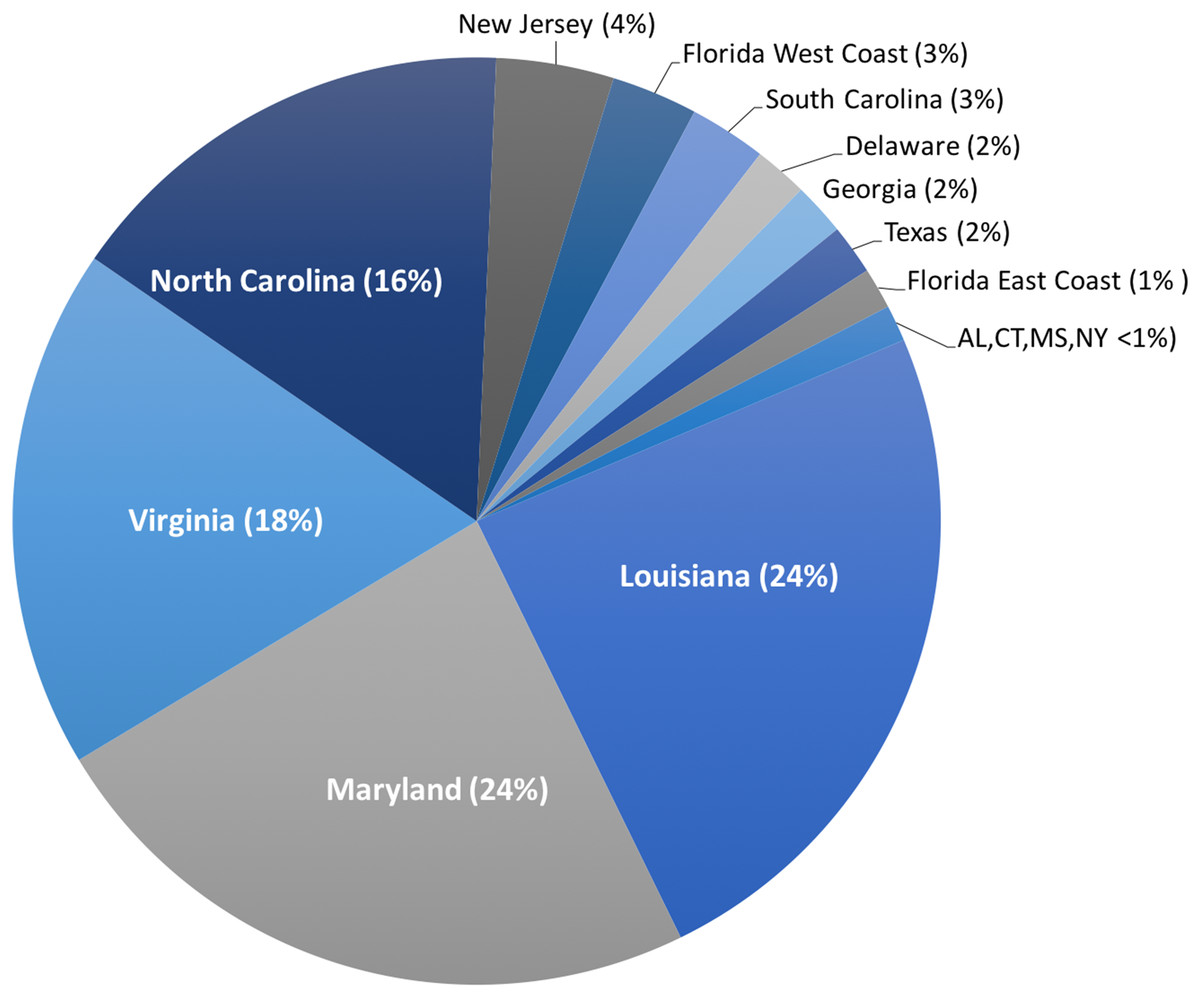
Figure 2: Landings of C. sapidus in the United States.
Proportion of five-year average of US domestic landing of Callinectes sapidus across 15 states. Percent contribution in parentheses.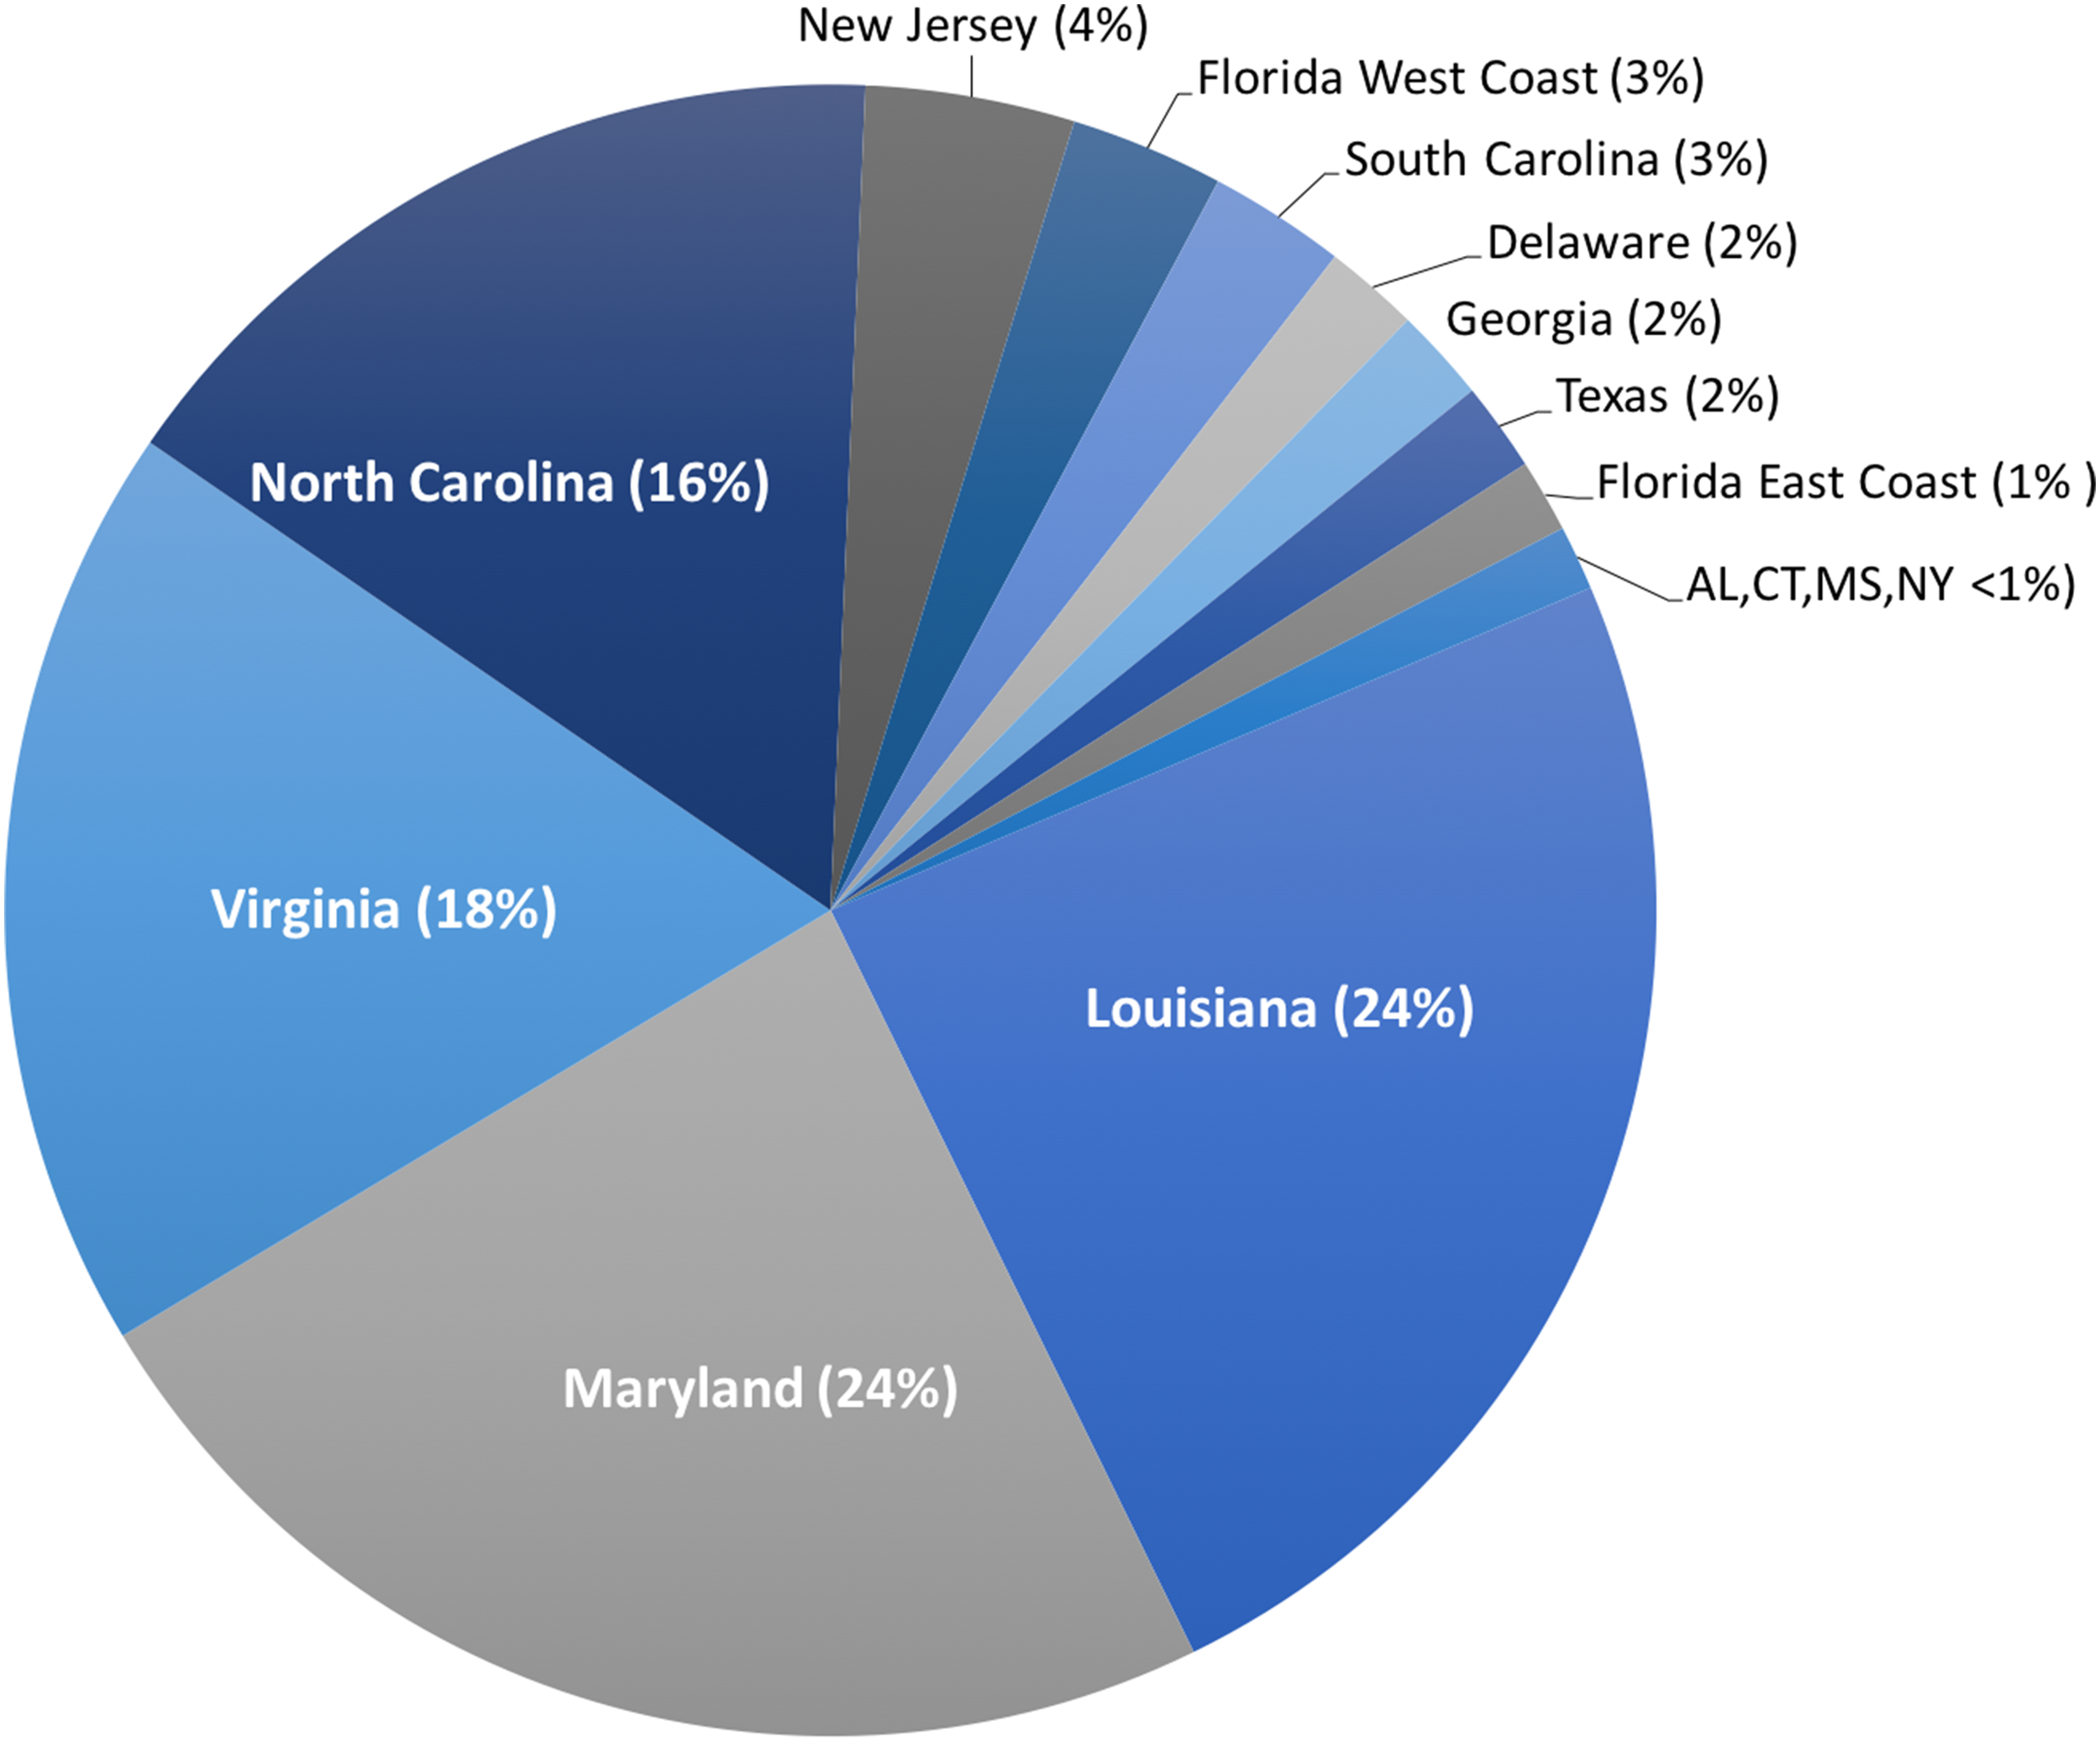
Public and political interest in seafood-related fraud in the United States led to the creation in 2014 of the Presidential Task Force on Combating Illegal, Unreported, and Unregulated (IUU) Fishing and Seafood Fraud. As part of its action plan, the taskforce published a list of commercially important fishes, crustaceans, and molluscs at risk for IUU fishing and fraud in the Federal Register in 2015 (Presidential Task Force on Combating Illegal Unreported and Unregulated (IUU) Fishing and Seafood Fraud Action Plan, 2014) (80 FR 66867). Of the 13 species or species groups chosen for the initial “at risk” listing, three involve crustaceans: all shrimps, king crab, and blue crab. The justification used to place C. sapidus (as “blue crab”) on the priority list was based on a history of misidentification of product origin, species substitution or mixing, and marketing of these products as “Maryland crab,” “Product of the USA,” “C. sapidus,” or “blue crab” (Presidential Task Force on Combating Illegal Unreported and Unregulated (IUU) Fishing and Seafood Fraud Action Plan, 2014) (80 FR 66867). For example, substitution of C. sapidus with one, or sometimes many, other species of portunid crabs that inhabit Indo-Pacific waters was demonstrated by Warner et al. (2015) through DNA testing of crab cakes sold in Maryland and Washington, D.C. area restaurants as “domestic” or “local” blue crab.
The study by Warner et al. (2015) focused on the presence of species other than C. sapidus in “Maryland” or “locally sourced” crab cakes and did not attempt to distinguish domestic from imported C. sapidus. The ability to identify geographic origin of C. sapidus is important because import records show that an average of 3.8 million pounds of processed Callinectes/Portunidae crabmeat was imported into the US annually between 2000 and 2017, with the majority harvested in Mexico and Venezuela (NOAA National Marine Fisheries Service Office of Science and Technology CFS, 2017b) (Fig. 3).
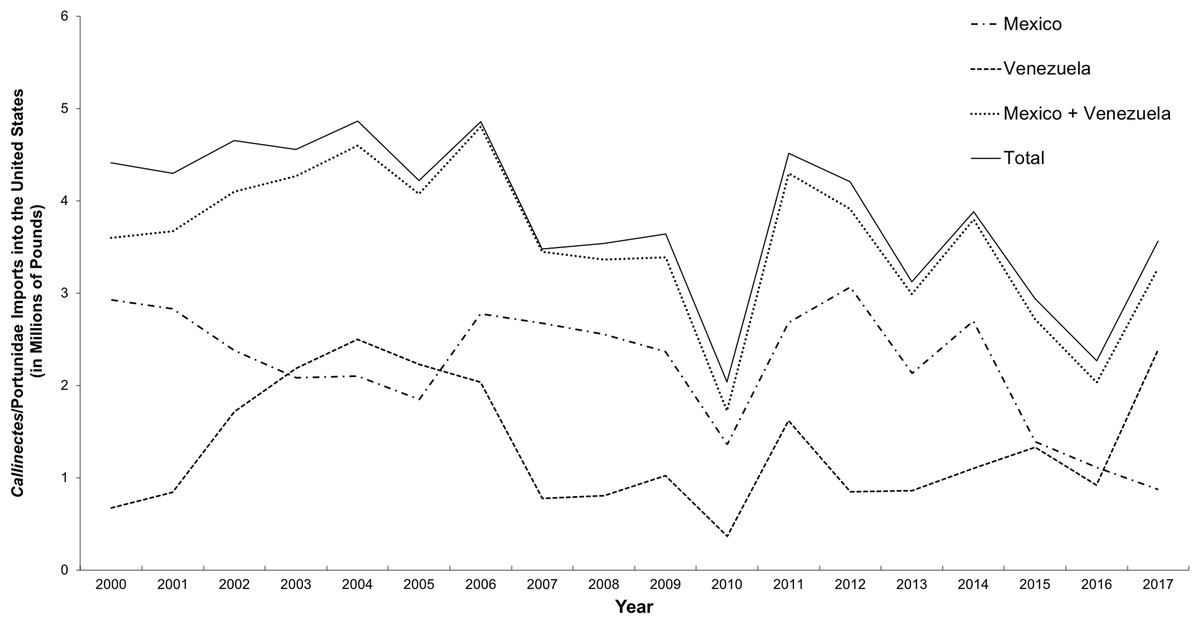
Figure 3: Imports of C. sapidus into the United States from Mexico and Venezuela.
Imports, in millions of pounds, of Callinectes/Portunidae (2000–2017) from Mexico and Venezuela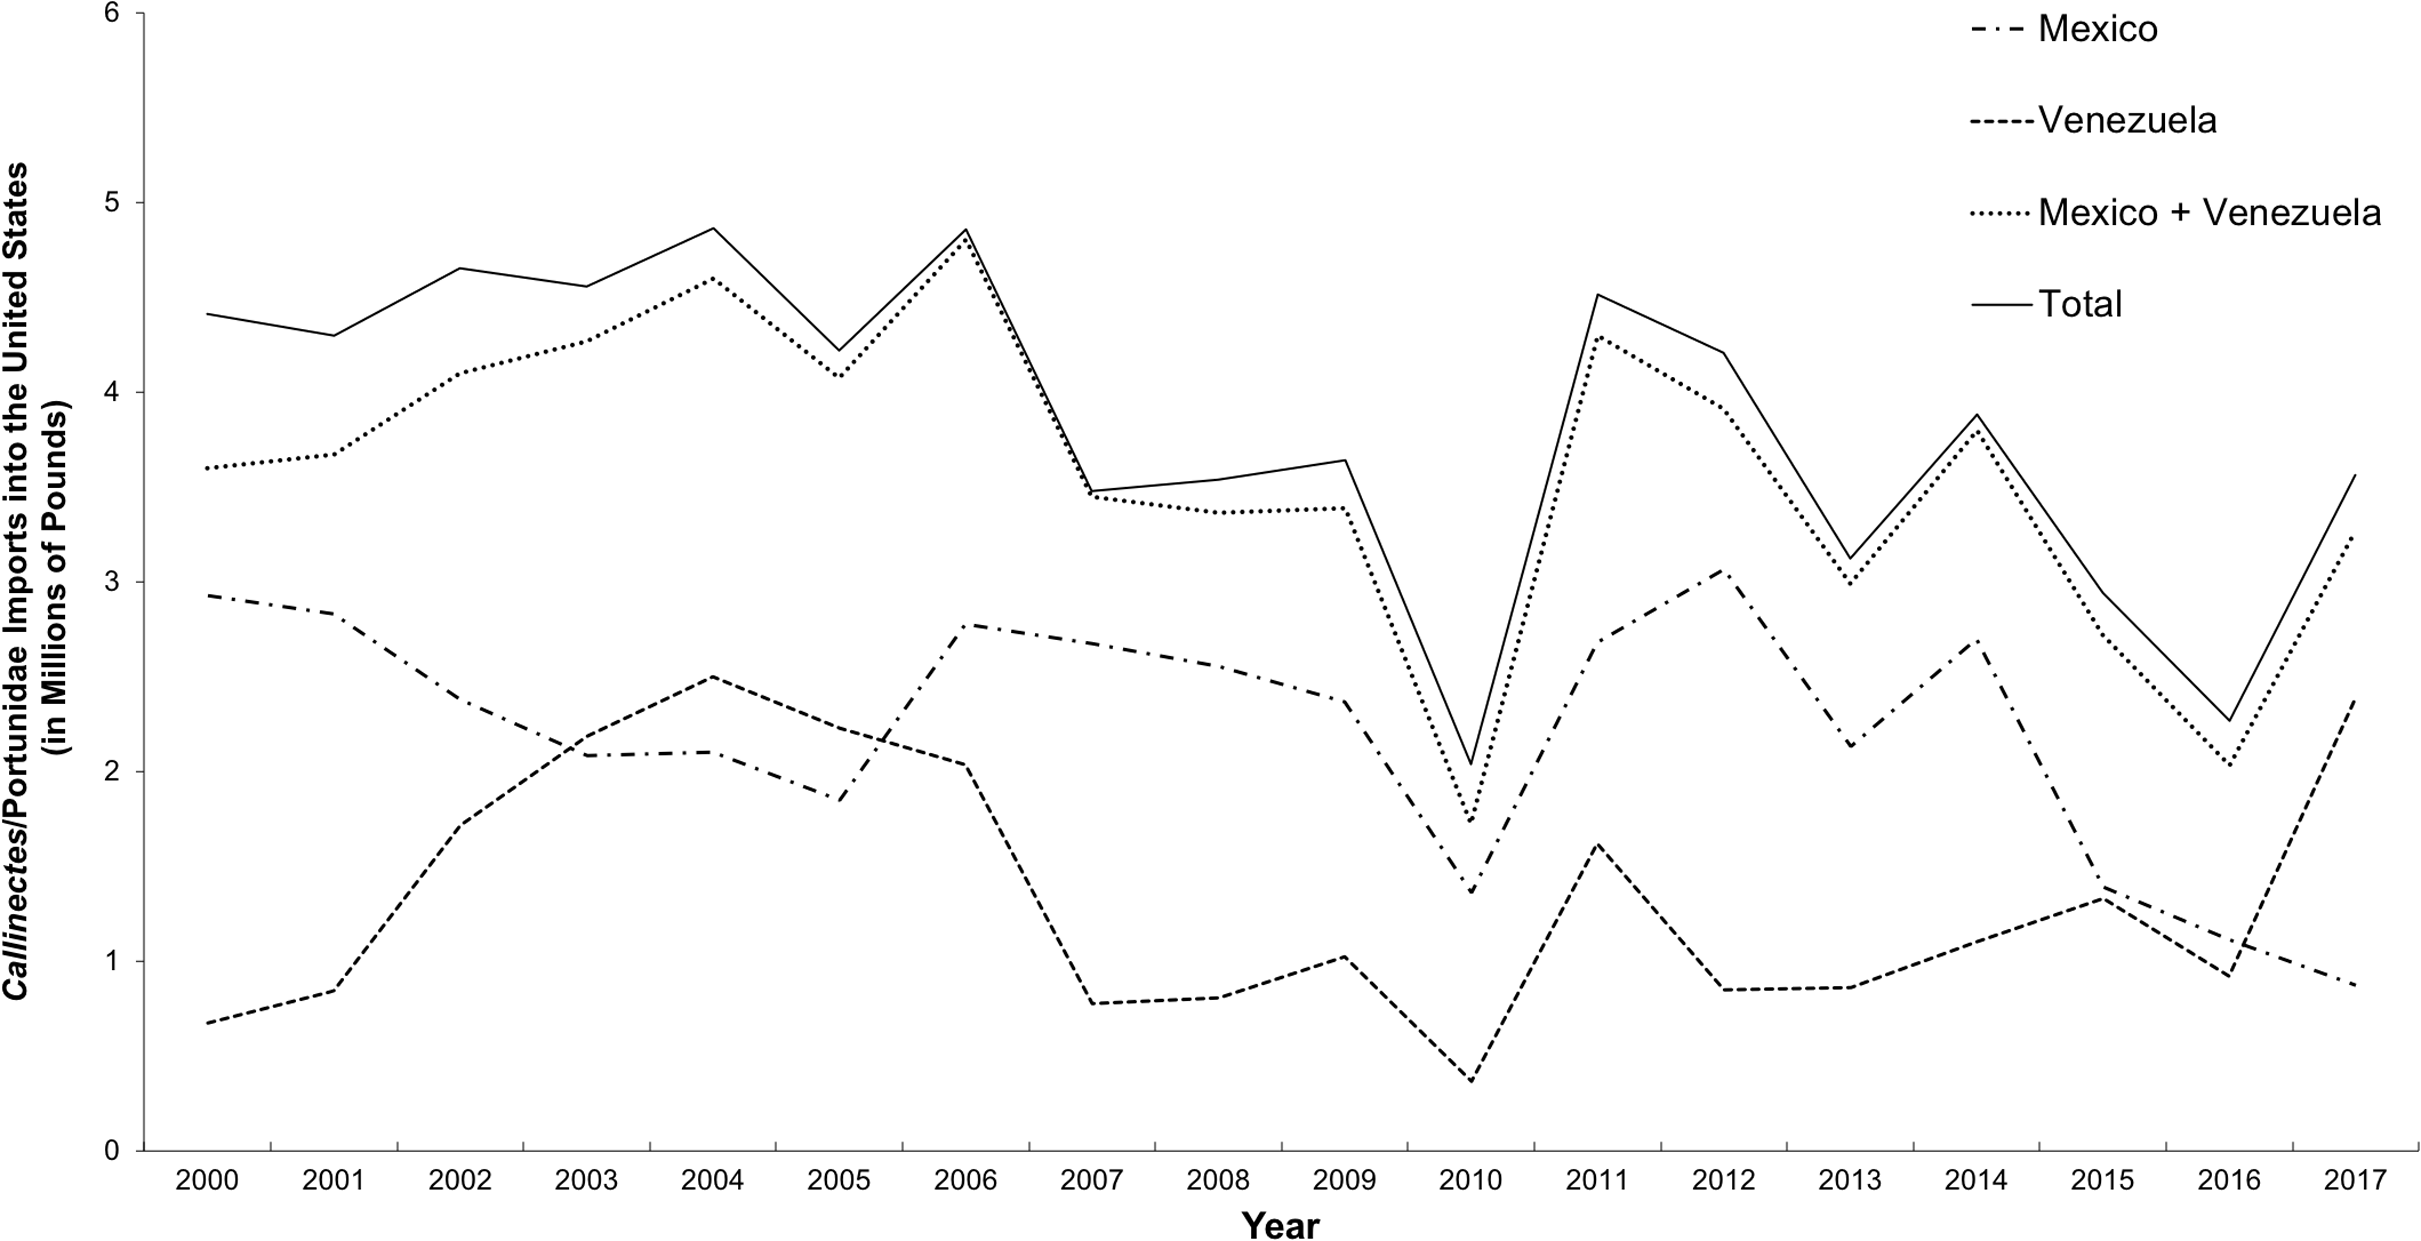
Previous studies have attempted to define population structure of C. sapidus in Chesapeake Bay, US Atlantic coast, Gulf of Mexico, and Brazil with mixed results (Feng, Williams & Place, 2017; Kordos & Burton, 1993; McMillen-Jackson & Bert, 2004; Place & Plough, 2017; Plough, 2017; Rodrigues et al., 2017; Van Montfrans, Ryer & Orth, 1991; Williams, Feng & Place, 2017; Yednock & Neigel, 2014). The studies by Feng (2009), Feng, Williams & Place (2017) and Williams, Feng & Place (2017) revealed high levels of heteroplasmy in mitochondrial genes and a lack of clear population structure in crabs from throughout the Atlantic and Gulf Coasts of the United States. Using nuclear and mitochondrial genes, Yednock & Neigel (2014) studied population dynamics in the Gulf of Mexico with similar findings of high genetic diversity. Further, both Feng, Williams & Place (2017) and Yednock & Neigel (2014) observed significant temporal variation in haplotype frequencies between adults and juveniles in both bodies of water. In contrast, Rodrigues et al. (2017) sequenced the 3′ end of the cytochrome c oxidase I (COI) mitochondrial gene in C. sapidus from Maryland and North Carolina in the US and São Paulo, Santa Catarina, and Rio Grande do Sul in Brazil and found significant genetic structure between US and Brazilian crabs. Based on these results, the authors described two distinct lineages; one found in both Brazilian and US waters and the other found only in Brazil. Plough (2017) used restriction-site associated DNA/genotyping-by-sequencing (RAD/GBS) to examine specimens from Massachusetts, western Florida, and Brazil. Those results also showed significant population structure between US and Brazilian specimens. Plough (2017) also observed low, but significant variation between north Atlantic and US Gulf of Mexico C. sapidus specimens. The studies by Rodrigues et al. (2017) and Plough (2017) are an indication that genetic analyses can inform geographic origin of C. sapidus products on a broad scale. However, of all these studies, only Yednock & Neigel (2014) included any specimens from the Caribbean region. Therefore, analysis of genetic variation in C. sapidus from the entirety of its natural range was deemed necessary.
Detection of mislabeling in Callinectes sapidus products
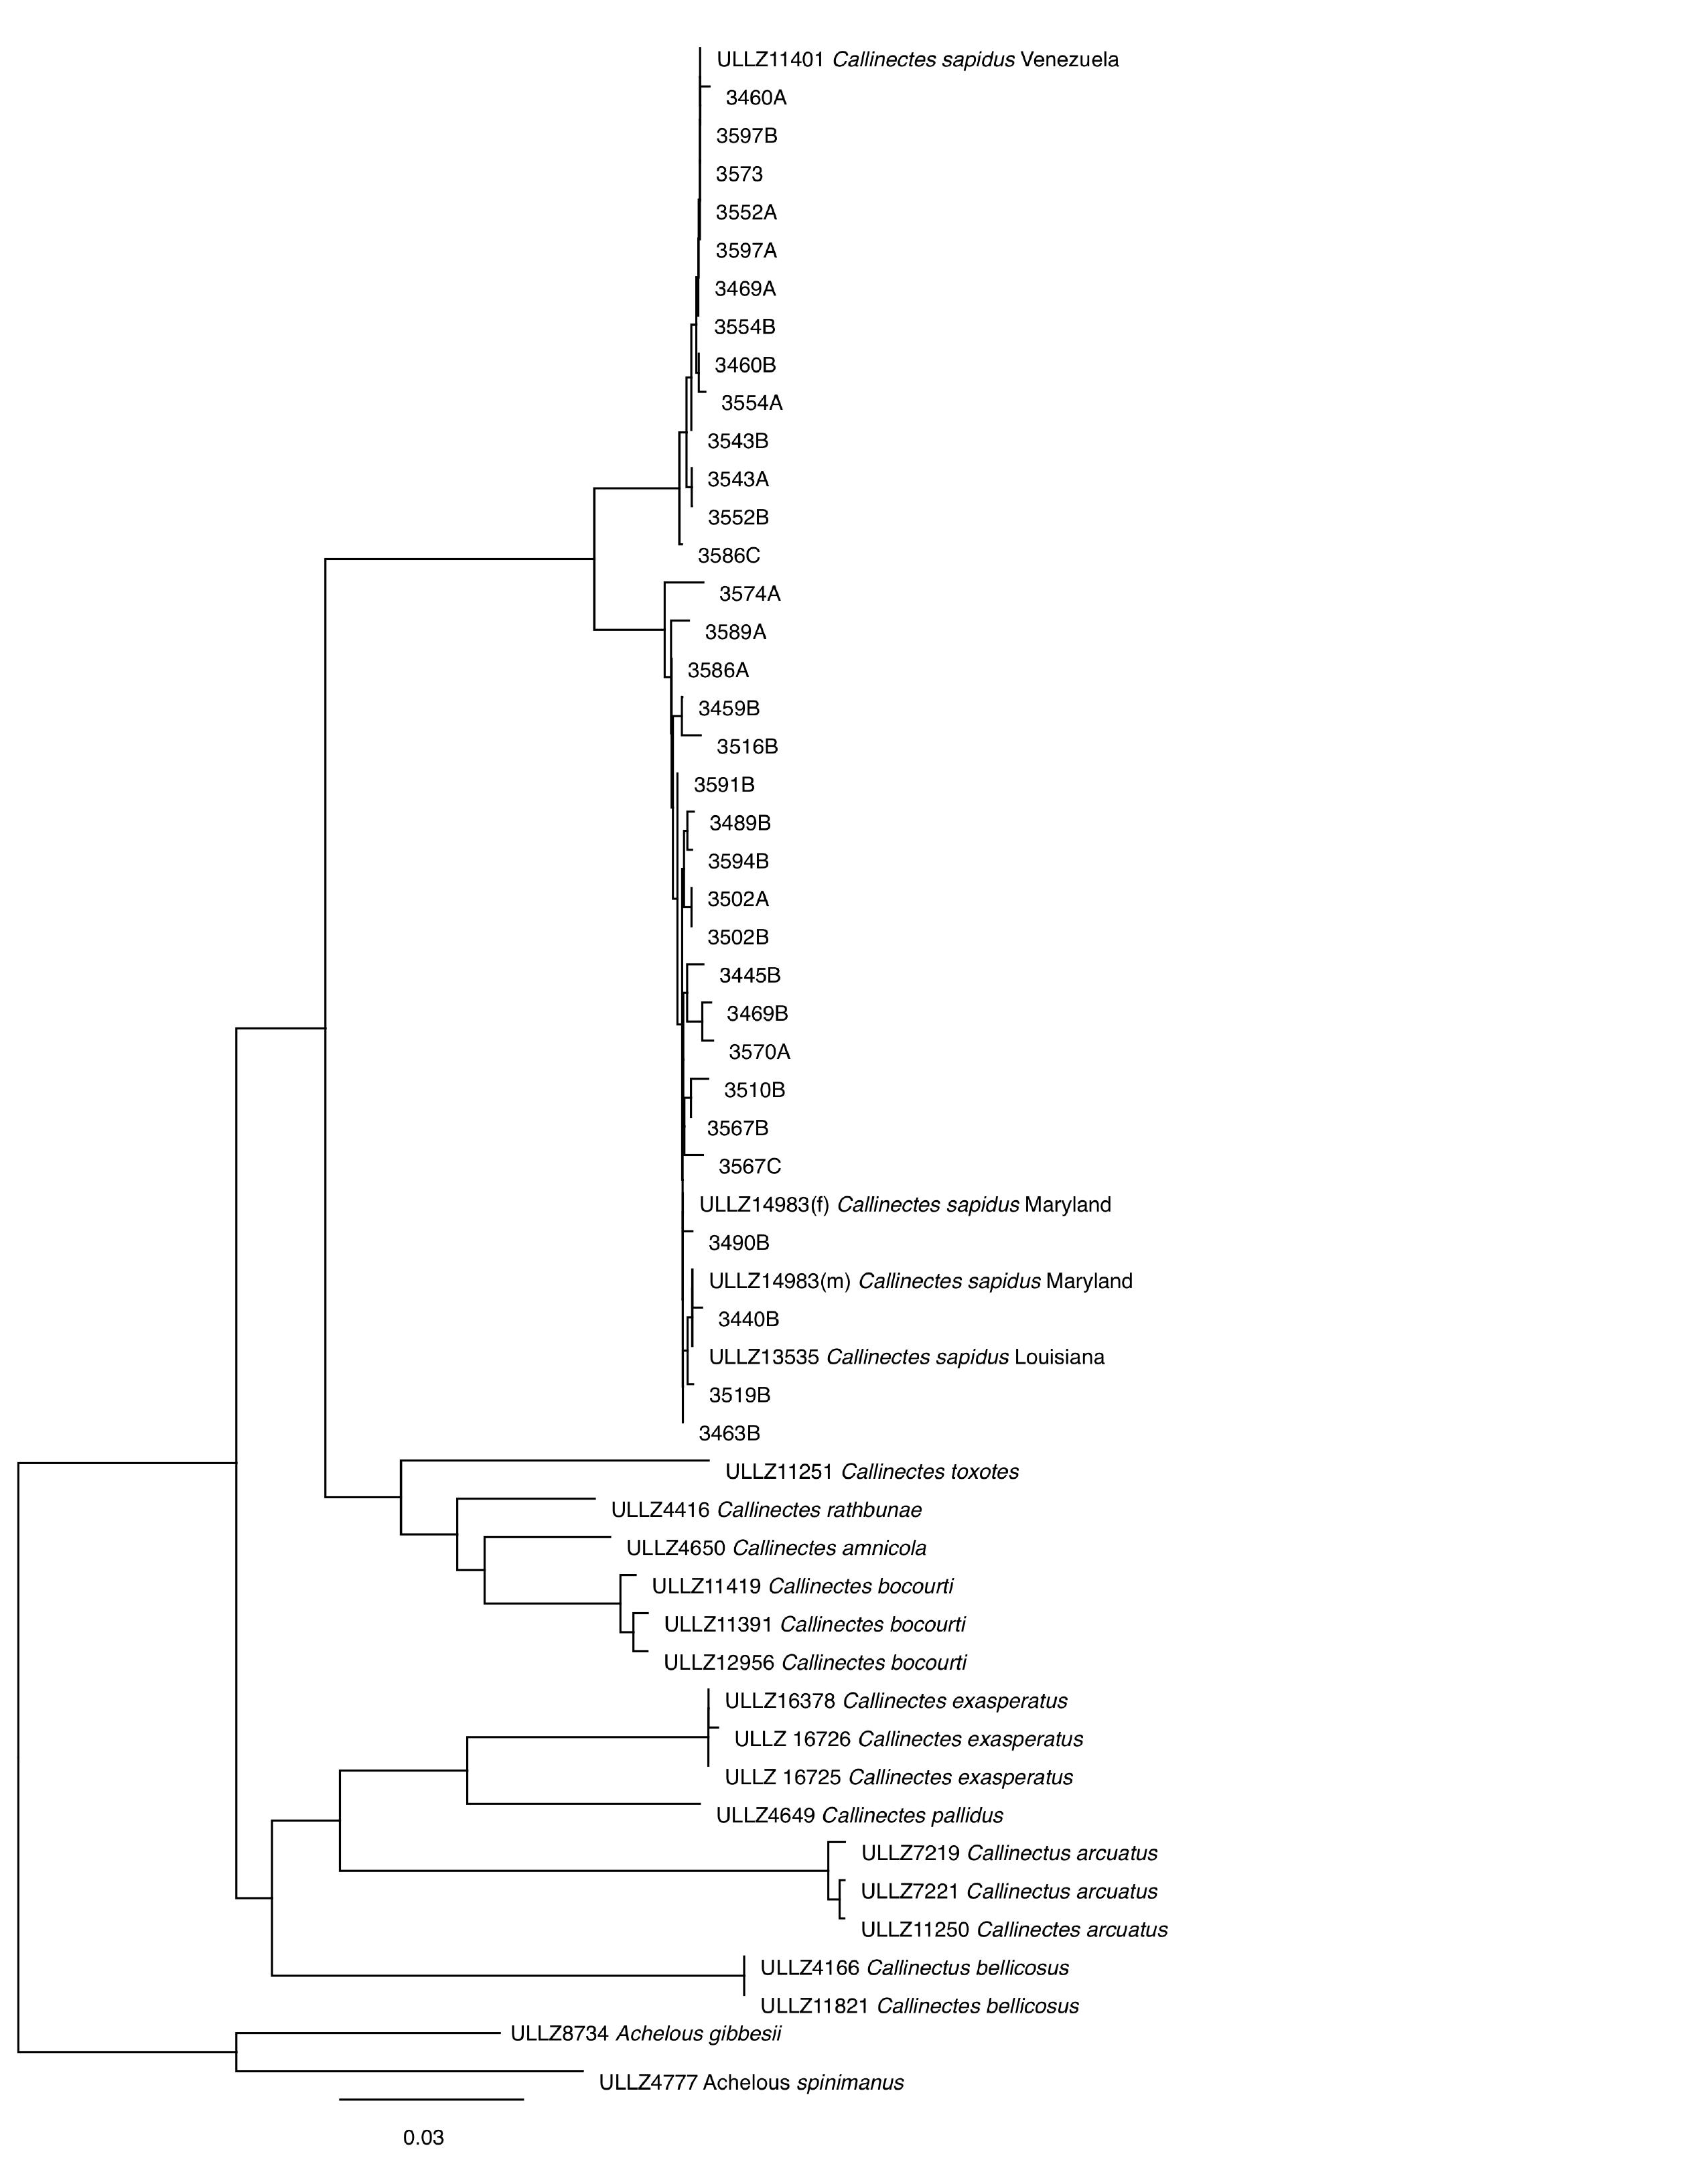
In order to modernize its species identification capabilities to address issues with seafood species substitution and fraud, the United States Food and Drug Administration (FDA) has adopted use of the DNA barcode region (658 bases starting near the 5′ end) of the COI gene (Hebert et al., 2003) for the identification of fish (Handy et al., 2011) and crustacean (Eischeid et al., 2016) products. As part of this effort, FDA developed a publicly available Reference Standard Sequence Library (RSSL) for seafood identification (Deeds et al., 2014; Food and Drug Administration, 2017) which contains sequences linked to authenticated reference specimens suitable for regulatory use. For decapod crustaceans, DNA barcoding is considered an effective tool for identifying species because the average genetic distance between species is 17.16%, whereas average intraspecific variation is 0.46% (Costa et al., 2007). However, in the process of adding DNA barcode sequences from museum-held specimens to the RSSL, a reference sequence from a specimen originally identified as C. sapidus “acutidens” (ULLZ 11401) collected from Zulia, Venezuela in the region of Lake Maracaibo showed a mean pairwise distance (p-distance) of 3.34% to two reference specimens from Maryland (ULLZ 14983(m) and ULLZ 14983(f)) and one from Louisiana (ULLZ 13535). Those three reference samples had p-distances of ≤0.2% between each other. Nevertheless, because there was only one reference specimen from Venezuela available at that time, it was unclear if that sequence was indicative of a cryptic species/subspecies or just an example of the high genetic diversity known in C. sapidus mitochondrial genes. The study by Yednock & Neigel (2014), utilizing one mitochondrial and five nuclear loci, included some of the same Venezuelan reference specimens used in the present study and the authors noted these individuals were “substantially divergent” from specimens collected in the Gulf of Mexico.
In 2014, National Oceanic Atmospheric Administration (NOAA) and FDA began an investigation regarding the importation, re-packaging, and false labeling of crabmeat. Samples of crabmeat were analyzed using COI DNA barcoding. Among the products tested, 59% of the sequences were determined to be species other than C. sapidus. The substituted species, Monomia haanii (Fabricius, 1798) and Ovalipes punctatus (De Haan, 1833–1850), are of western Pacific origin, thus confirming suspicions of species substitution and mislabeling. The remaining sequences were identified as C. sapidus, but 59% of these were allied with the three US reference sequences while the remaining 41% allied with the single reference sequence from Venezuela (Supplemental 2). In contrast, samples from multiple tubs of US-labeled blue crabmeat obtained from additional suppliers within the same time period only contained sequences aligning with the US reference specimens. This suggested that not only was there labeling of other crab species as blue crab but there was also potentially imported C. sapidus labeled fraudulently as “Product of the USA.” A primary objective of this study was to test the hypothesis that the differences observed in the initial four reference samples would continue to coincide with geographic origin after an expanded sampling effort.
The DNA barcode region has proven useful in species delimitation and as a marker for determining geographic structure in other decapods (Dudoit et al., 2018; Fratini & Vannini, 2002; Khamnamtong, Klinbunga & Menasveta, 2009). The genus Callinectes typically exhibits 15.86–18.09% p-distance between species and a p-distance of 0.11–1.08% within species (Costa et al., 2007; Pfeiler et al., 2005). The 3.34% mean p-distance observed between our Venezuelan and US reference specimens of C. sapidus suggests that the DNA barcode region might be useful for indicating geographic origin in C. sapidus. Similarly, two distinct barcode lineages in individuals of the eastern Pacific species, C. bellicosus Stimpson, 1859, were observed by Pfeiler et al. (2005); however, in that case the divergent lineages did not appear to align with geography. Sympatric intraspecific mtDNA divergences have also been recorded in non-decapod marine taxa (Shamblin et al., 2014; Raupach et al., 2014; Tominaga et al., 2009).
Objectives
Based on our preliminary findings, we decided to further document and describe intraspecific variation within the DNA barcode region of C. sapidus. To accomplish this, we sequenced specimens collected from throughout the broad, disjointed, geographic range. These sequences then served as reference standards for comparison to commercial crabmeat products labeled as originating from the United States or Venezuela to evaluate if we can positively identify the US vs. non-US origin of C. sapidus crabmeat products.
Materials and Methods
Reference specimens
In addition to reference specimens already in the FDA’s RSSL, reference specimens of C. sapidus were obtained live from local fishermen or hand collected by NOAA Office of Law Enforcement and state and federal partners from throughout the continental US, Puerto Rico, and the Yucatan Peninsula of Mexico between September 2014 and June 2017. Crabs were frozen for initial preservation prior to being photographed and tissue-sampled for both archival and DNA extraction purposes. Archival tissue samples were stored in 95% ethanol at −80 °C in the NOAA Northwest Fisheries Science Center (NWFSC) Forensic Laboratory and the FDA seafood species reference tissue collections. Specimens in good physical condition (i.e., had most appendages and an intact carapace, N = 114) were preserved in 70% ethanol and deposited to the National Museum of Natural History (NMNH), Smithsonian Institution (Acc. 2076129). Additional tissues were gifted from specimens in the University of Louisiana at Lafayette Zoological Collections (ULLZ); the Crustacean Collection: Department of Biology, Faculty of Philosophy, Sciences, and Letters of Ribeirão Preto, University of São Paulo (CCDB); Museum of Zoology, University of São Paulo (MZUSP); the Bracken-Grissom Lab, Florida International University (HBG); and the University of Maryland Institute of Marine and Environmental Technology. Finally, sequences from six museum-accessioned specimens available from GenBank were included in our analyses. Specimen details, including collection location, collection year, lineage, haplotype, geographic region, and GenBank accession numbers are provided in Table S1.
Commercial products
For the analysis of commercial products, one-pound (454 g) tubs of fresh or pasteurized crabmeat labeled as either “Product of the USA” (N = 7 from six brands) or “Product of Venezuela” (N = 7 from six brands) were purchased at retail grocery or seafood markets in the greater Washington D.C. metropolitan areas of Maryland and Virginia between January 2016 and August 2017. Portions of 10 lumps (i.e., single piece of crabmeat reasonably expected to be from an individual crab) from each tub were sampled for DNA extraction for a total of 70 samples from each labeled product origin. Additional commercial samples labeled as products of Colombia (one 454 g can of “blue crab” cocktail claws), Nicaragua (one 454 g package of whole frozen uncooked “blue claw crabs”), and Turkey (one 500 g package of whole frozen uncooked “blue crabs”) were obtained opportunistically for supplemental analysis. The canned claws were sampled as described for the crabmeat tubs above, whereas muscle tissue from each crab (N = 4 and 5, respectively) was sampled for the whole frozen crab products from Nicaragua and Turkey.
Lastly, DNA extracted from remaining pieces of crab cakes (one to three individual lumps per cake, N = 115 total) purchased and identified previously through DNA sequencing as C. sapidus by Warner et al. (2015), and subsequently preserved dry in silica beads, was re-analyzed using the methods described below.
Molecular methods
Genomic DNA was extracted from muscle tissue of fresh-frozen reference specimens with either a phenol chloroform extraction on an Autogen GenePrep 965 or a Qiagen DNeasy 96 kit according to each manufacturer’s animal tissue protocol. The 658 bp barcode region of the COI gene was amplified with either LCO1490 and HCO2198 (Folmer et al., 1994) or JgLCO1490 and JgHCO2198 (Geller et al., 2013) with annealing temperatures of 42–46 °C. A 640 bp region at the 3′ end of the COI gene was also amplified with the primers COIf and COIa (Palumbi & Benzie, 1991). PCR products were visualized by agarose gel electrophoresis (1.5% agarose), and successful amplifications were purified with ExoSAP-IT (Affymetrix, Santa Clara, CA, USA) according to the manufacturer’s protocols prior to sequencing. Sequencing reactions were performed using one µL of purified PCR product in a 10 µL reaction containing 0.5 µL 10 µM primer, 1.75 µL 5× Big Dye buffer and 0.75 µL Big Dye (Life Technologies, Carlsbad, CA, USA). Reactions were purified using Millipore Sephadex (MAHVN-4550) or Edge Bio Optima DTR (17946) 96-well plates and sequenced on an ABI 3730XL or ABI3130 automated DNA sequencer. DNA extraction, PCR, and sequencing of reference specimens was carried out at the Laboratories of Analytical Biology at the NMNH and the NOAA NWFSC. Commercial samples, including crab cake samples re-analyzed from the Warner et al. (2015) study, were sequenced at the FDA following the protocols described in Eischeid et al. (2016).
All sequences generated from this study have been deposited in GenBank (NCBI) under bioproject PRJNA554071 and accession nos. MG462242–MG462317; MG462319–MG462696; MG515495–MG515527; MH062454–MH062672; MH985860–MH985991; and MH985992–MH986002 (Tables S1 and S2).
| 109 | 127 | 160 | 172 | 193 | 197 | 205 | 232 | 244 | 262 | 271 | 334 | 412 | 421 | 469 | 475 | 508 | 580 | 631 | 637 | 640 | 652 | |
|---|---|---|---|---|---|---|---|---|---|---|---|---|---|---|---|---|---|---|---|---|---|---|
| Lineage 1 | A (1G) | C (4T) | G (30A) | T | T | C (1T) | C (6T) | C (10T) | A | A (1G) | T (8C) | T | T/C | A/G | T (1C) | T (4C) | T | T (1C) | C (5T, 1A) | T (4C) | T (1C) | T |
| USA | A | C | G (1A) | T | T | C (1T) | C (1T) | C (4T) | A | A (1G) | T (2C) | T | T/C | A | T | T (1C) | T | T | C | T | T | T |
| Turkey | A | C | G | T | T | C | C | C | A | A | T | T | T | A | T | T | T | T | C | T | T | T |
| Lineage 2 | G (1A) | T | A | C | C | T | T | T | G (4A) | A | C (7T) | C | A | C | C | C | C | C (2T) | T | C | C (1T) | T (1C) |
| Venezuela | G | T | A | C | C (1T) | T | T | T | G (1A) | A | C | C | A | C | C | C (1T) | C (2T, 1A) | C (1T) | T | C | C | T |
| Colombia | G | T | A | C | C | T | T | T | G | A | C | C | A | C | C | C | C | C | T | C | C | T |
| Nicaragua | G | T | A | C | C | T | T | T | G | A | C | C | A | C | C | C | C | C | T | C | C | T |
| Lineage 3 | G | T | A | T | T | T | T | T | G | G | C | C | T | C | C | T | C | T | T | T | C | C |
Notes:
Phylogenetically informative sites in COI sequences from reference specimens (Lineage 1, Lineage 2, Lineage 3) and commercial crabmeat (USA, Venezuela, Colombia, Nicaragua, Turkey). In cases where sites had more than one nucleotide state, number of divergent sequences and the less common nucleotide are shown in parentheses.
Black boxes indicate sites where all alignments exhibited fixed nucleotide differences between lineages, blue italic letters indicate fixed differences between reference specimens, and red italic letters indicate fixed differences between commercial products labeled as either “Product of the USA” or “Product of Venezuela.” Bold letters indicate informative sites unique to Lineage 3.
| Sample region/Lineage | Number of polymorphic sites (S) | Haplotype diversity (h) | Nucleotide diversity (π) | Average number of pairwise differences (k) |
|---|---|---|---|---|
| Mid-Atlantic Bight | 60 | 0.93 | 0.43% | 2.82 |
| South Atlantic Bight | 76 | 0.97 | 1.24% | 8.16 |
| Gulf of Mexico | 77 | 0.95 | 0.51% | 3.35 |
| Caribbean | 47 | 0.73 | 0.47% | 3.08 |
| Brazil | 22 | 0.63 | 0.91% | 5.97 |
| USA Products | 42 | 0.87 | 0.40% | 2.65 |
| Venezuela Products | 27 | 0.57 | 0.14% | 0.91 |
| Lineage 1 | 114 | 0.95 | 0.45% | 2.95 |
| Lineage 2 | 30 | 0.69 | 0.19% | 1.27 |
| Lineage 3 | 3 | 0.42 | 0.07% | 0.46 |
Genetic analyses
Geneious 9.1.8 (Biomatters, Auckland, New Zealand) was used to visualize, trim, and assemble contigs from forward and reverse sequences. Only sequences that were bidirectional, 658 bp (or 640 bp) in length, had fewer than three sequence ambiguities, and contained an open reading frame were included in analyses. Sequences were aligned using MAFFT (Katoh & Standley, 2013) with sequences from (1) all reference specimens [REF], (2) all newly collected commercial crabmeat products [PROD], and (3) all reference specimens plus all commercial products [TOTAL]. Haplotypes were assigned by DNAsp v5 (Librado & Rozas, 2009) based on the [TOTAL] alignment. For visualization purposes, unrooted neighbor-joining (NJ) dendrograms were constructed using the uncorrected p-distance method in MEGA7 (Kumar, Stecher & Tamura, 2016) for each alignment. Distance matrices were also calculated in MEGA7 for each alignment using p-distance. p-distances were used instead of a model of evolution to avoid over parameterization and over complication of analysis of very closely related sequences (Collins et al., 2012; Nei & Kumar, 2000).
Calculations of sequence divergence were carried out in DnaSP on [REF] and [PROD] alignments. Groups were defined according to coarse geographic origin, NJ dendrogram lineage [REF], or to labeled geographic origin [PROD]. Measures of genetic diversity (Fst) were calculated using the software Arlequin 3.5 (Excoffier & Lischer, 2010) to test for significant differences between the populations inhabiting the Mid Atlantic Bight (MAB: NJ to Cape Hatteras, NC), South Atlantic Bight (SAB: Cape Hatteras, NC to the Florida Keys), Gulf of Mexico (GMx: Gulf FL to Campeche, Mx), Caribbean (CAR: Yucatan, Mx to Venezuela; Puerto Rico), and Brazil (BR: Brazilian coast) and between lineages derived from NJ dendrograms. These population delimitations were chosen based on broad geographic delineations that have been variously linked to biogeographic distribution in other marine taxa (Boschi, 2000; Dalyander et al., 2013; Robertson & Cramer, 2014; Ezer, 2019).
The web service DIVEIN (Deng et al., 2010) was used to identify phylogenetically informative sites, defined as positions at which there are at least two different character states and each of those states occurs in at least two of the sequences, within the [REF] and [PROD] alignments. These sites were then manipulated in Geneious to determine their utility as diagnostic character states between the lineages.
The supplementary analysis of 3′ COI sequences from this study, plus those generated by Rodrigues et al. (2017) (GenBank Popset 1019591405) [3′COI] were aligned and a NJ dendrogram was built using the same methods described for the reference specimens. We chose to focus on the more universally comparable barcode region of COI, so haplotype analyses were not performed on this the 3′COI dataset.
Import and domestic production data for crabmeat
Data on domestic landings and imported processed crabmeat weights (in metric tons) were acquired from the NOAA National Marine Fisheries Service (NMFS) Office of Science and Technology, Commercial Fisheries Statistics Landings webpage: https://foss.nmfs.noaa.gov/apexfoss/f?p=215:200:17318262838662::::: (Downloaded 9/29/17). Domestic data was acquired from the “Commercial Landings” tab by selecting “Annual Commercial Landings Statistics,” “Crab, Blue,” year range “2010–2015,” and “All States by State.” Import data was acquired from the https://www.st.nmfs.noaa.gov/commercial-fisheries/foreign-trade/applications/annual-product-by-countryassociation. Table values were set to: trade type “Imports,” year “2000–2017,” product “Crab, Swimming,” and country/association “All Countries Individually.” Domestic landing and import weights were not directly comparable as imports are reported as weight of processed crabmeat, while domestic landings are listed as weights of whole crab.
Results
Reference specimens
For the reference samples [REF], a total of 417 barcode region sequences were successfully generated. Haplotype assignment of the [REF] alignment yielded 174 haplotypes with seven haplotypes shared by 10 or more individuals and 134 singleton haplotypes (Table S1; Supplemental 1). The NJ dendrogram constructed to visualize an alignment of haplotype exemplars from each population region depicted three distinct lineages (Fig. 4). The distribution of those lineages is largely, but not exclusively, associated with geographic origin (Fig. 1). The majority of specimens from the MAB, SAB, and GMx regions (314/331) group within one clade that we hereafter term Lineage 1 (Table S1; Figs. 1 and 4). The majority of specimens from the Caribbean region (66/69) form a second clade identified here as Lineage 2 (Table S1; Figs. 1 and 4). The majority of specimens from Brazil (13/16) form a third lineage that we termed Lineage 3. DnaSP identified six fixed nucleotide differences between Lineage 1 and Lineage 2; Lineage 3 had five and seven fixed differences between Lineages 1 and 2, respectively (Table 1).
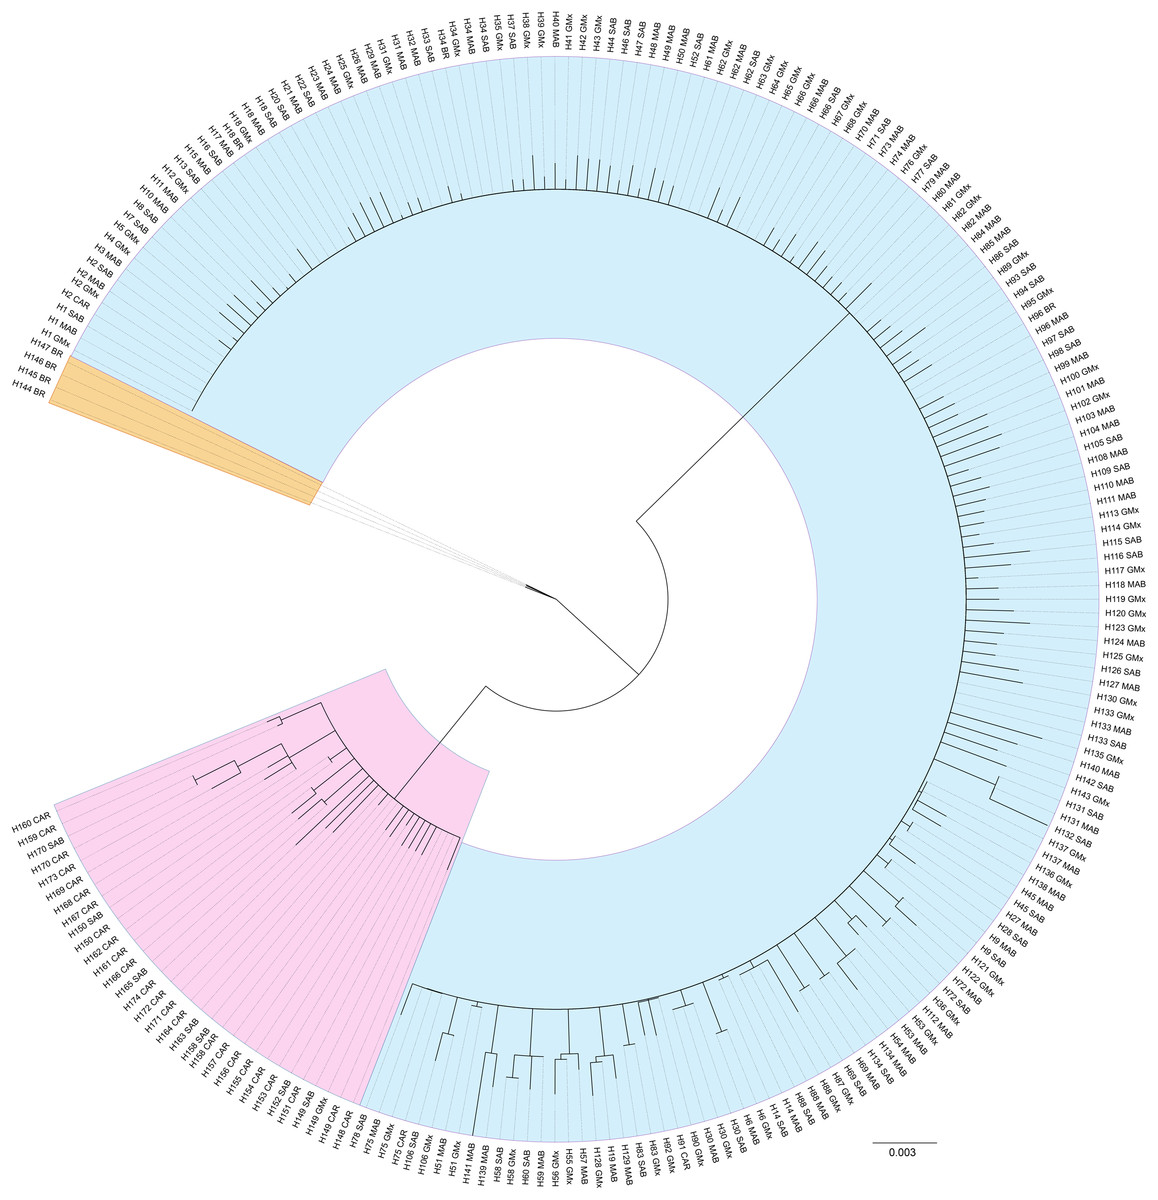
Figure 4: Unrooted neighbor-joining dendrogram of haplotype sequences from each collection region.
Unrooted neighbor-joining dendrogram of COI haplotype sequences from throughout the natural range of Callinectes sapidus showing three lineages: blue, Lineage 1 (predominantly northwestern Atlantic and Gulf of Mexico); pink, Lineage 2 (predominantly Caribbean region); orange, Lineage 3 (Brazil only). Tip labels are haplotype number and collection region. MAB, Mid-Atlantic Bight; SAB, South Atlantic Bight; GMx, Gulf of Mexico; CAR, Caribbean region; BR, Brazil.
When grouped by geography, haplotype diversity (h) ranged from 0.63 to 0.97 and was highest in the SAB region and lowest in Brazil (Table 2). Nucleotide diversity (π) was highest in the SAB and lowest in the MAB. Likewise, the average number of pairwise differences (k) was highest in the SAB and lowest in the MAB (Table 2). When grouped by lineage, Lineage 1 had the highest haplotype and nucleotide diversities and Lineage 3 the lowest.
Pairwise Fst values between the major geographic regions was significant (p < 0.01) for all pairings except MAB/GMx (Fst = −0.001 p = 0.61) (Table 3). The three lineages were all significantly different from each other (Table 4).
| MAB [129] | GMx [105] | SAB [98] | CAR [69] | BR [16] | US [70] | |
|---|---|---|---|---|---|---|
| GMx [105] | -0.001 (0.61) | |||||
| SAB [98] | 0.086 (<0.01) | 0.073 (<0.01) | ||||
| CAR [69] | 0.859 (<0.01) | 0.844 (<0.01) | 0.668 (<0.01) | |||
| BR [16] | 0.767 (<0.01) | 0.738 (<0.01) | 0.475 (<0.01) | 0.657 (<0.01) | ||
| USA [70] | 0.004 (0.14) | 0.001 (0.25) | 0.083 (<0.01) | 0.864 (<0.01) | 0.767 (<0.01) | |
| VEN [70] | 0.788 (<0.01) | 0.766 (<0.01) | 0.607 (<0.01) | 0.006 (0.05) | 0.447 (<0.01) | 0.761 (<0.01) |
Notes:
MAB, Mid-Atlantic Bight; SAB, South Atlantic Bight; GMx, Gulf of Mexico; CAR, Caribbean Sea; BR, Brazilian Coast; USA, Commercial products labeled “Product of USA”; VEN, commercial product labeled “Product of Venezuela.” Numbers within brackets are sample numbers within each geographic area. Numbers in bold represent non-significant differences between geographic areas and/or products (α = 0.01).
| L1 [321] | L2 [83] | L3 [13] | USA [70] | |
|---|---|---|---|---|
| L2 [83] | 0.883 (<0.01) | |||
| L3 [13] | 0.848 (<0.01) | 0.872 (<0.01) | ||
| USA [70] | 0.004 (<0.09) | 0.913 (<0.01) | 0.874 (<0.01) | |
| VEN [70] | 0.825 (<0.01) | 0.005 (<0.01) | 0.473 (<0.01) | 0.761 (<0.01) |
Notes:
USA, Commercial products labeled “Product of USA;” VEN, commercial product labeled “Product of Venezuela.”
Numbers within brackets are sample numbers within each lineage. Numbers in bold represent non-significant Fst distance (α = 0.01).
When grouped by lineage in MEGA7, the mean p-distance between Lineage 1 and Lineage 2 is 3.15%, between Lineages 1 and 3 is 2.55%, and between Lineages 2 and 3 is 1.35%. Within-group mean p-distances were 0.45%, 0.19%, 0.07% for Lineages 1, 2, and 3, respectively (Table 5). The maximum within-group p-distance for any lineage was 1.70% (Lineage 1).
| Lineage 1 | Major US Producers | Product of USA | Lineage 2 | Zulia, Venezuela | Product of Venezuela | Lineage 3 | |
|---|---|---|---|---|---|---|---|
| Lineage 1 | 0.45/1.7 | 0 | 0 | 2.74 | 2.7 | 2.6 | 2.3 |
| Major US producers | 0.22 | 0.43/1.68 | 0 | 2.7 | 2.7 | 2.3 | 2.3 |
| Product of USA | 0.23 | 0.22 | 0.44/1.22 | 2.9 | 2.9 | 2.7 | 2.3 |
| Lineage 2 | 3.15 | 2.76 | 2.78 | 0.19/1.11 | 0 | 0 | 1.1 |
| Zulia, Venezuela | 3.16 | 3.28 | 2.75 | 0.18 | 1.15/0.46 | 0 | 1.2 |
| Product of Venezuela | 3.01 | 2.75 | 2.77 | 0.16 | 0.13 | 0.14/1.11 | 1.1 |
| Lineage 3 | 2.55 | 2.14 | 2.15 | 1.35 | 1.35 | 1.33 | 0.07/0.31 |
Note:
Between and within group mean, minimum, and maximum p-distances (%) for reference specimens (Lineages 1, 2, and 3); major crab-producing states in the US (Maryland, Louisiana, Virginia, North Carolina); the major crab producing state in Venezuela (Zulia); commercial crab meat labeled as “Product of USA”; commercial crab meat labeled as “Product of Venezuela.” Lower triangle, between group mean p-distances; upper triangle, between group minimum p-distances; diagonal, within-group mean/maximum p-distances.
DIVEIN identified 73 informative sites: six with fixed differences between lineages, 16 sites where nucleotides were complementary between lineages in the majority of sequences, and 51 sites where nucleotide state was conserved in the majority of sequences across both lineages (Table 1). These 51 nucleotide positions, when experimentally removed or modified to “N,” had no impact on our ability to recover the two lineages (i.e., met the definition of an informative site, but did not contribute to lineage divergence). However, when the remaining 22 highly bipartite sites were modified to an “N” or removed, the two lineages were no longer recovered in the NJ dendrogram.
A closer look at barcode region haplotype frequencies shows that the most common haplotype in Lineage 1 (H34; N = 62) is shared by individuals from the MAB, SAB, GMx, and BR. A total of 60 of these sequences occurred in the continental US. Furthermore, 67 haplotypes, all of which belong to Lineage 1, were identified in the 127 reference specimens from the four major C. sapidus-producing US states (LA, MD, VA, NC). The most abundant haplotype in each of these states is H34.
The most common haplotype in Lineage 2 (H149; N = 46) is shared by individuals from the SAB, GMx, and CAR regions. This haplotype makes up 55.6% of the sequences from Zulia, which is the major crab harvesting state of Venezuela.
Lineage 3 is comprised of four haplotypes that only occur in Brazil. The most common haplotype (H145) was seen in 10 individuals. The remaining three haplotypes are singletons.
The NJ dendrogram built from the [3′ COI] showed lineage congruence between the barcode region and 3′ region of COI. Our Lineage 1 defined for the barcode region is consistent with Lineage 1 defined by Rodrigues et al. (2017) and our Lineage 3 corresponds to their Lineage 2 (Fig. S1). None of the sequences generated by Rodrigues et al. (2017) allied with sequences in our Lineage 2. In instances where the barcode region sequence was not successfully generated, we used the 3′ region sequence to infer lineage (Table S1).
Commercial products
A total of 70 samples each were successfully sequenced from tubs of crabmeat labeled as “Product of the USA” or “Product of Venezuela.” Sequences of US-labeled products were assigned by DNAsp to 31 haplotypes with nine shared by two or more individuals. The Venezuelan-labeled crabmeat sequences were assigned to 24 haplotypes with three haplotypes shared by two or more individuals. The most common haplotype in US-labeled products was H34 (N = 25) and in Venezuelan-labeled products it was H149 (N = 45). All haplotype sequences from tubs labeled as Product of the USA grouped with the top five most common Lineage 1 haplotypes while all haplotype sequences from tubs labeled as Product of Venezuela grouped with the five most common haplotypes in Lineage 2 (Fig. 5).
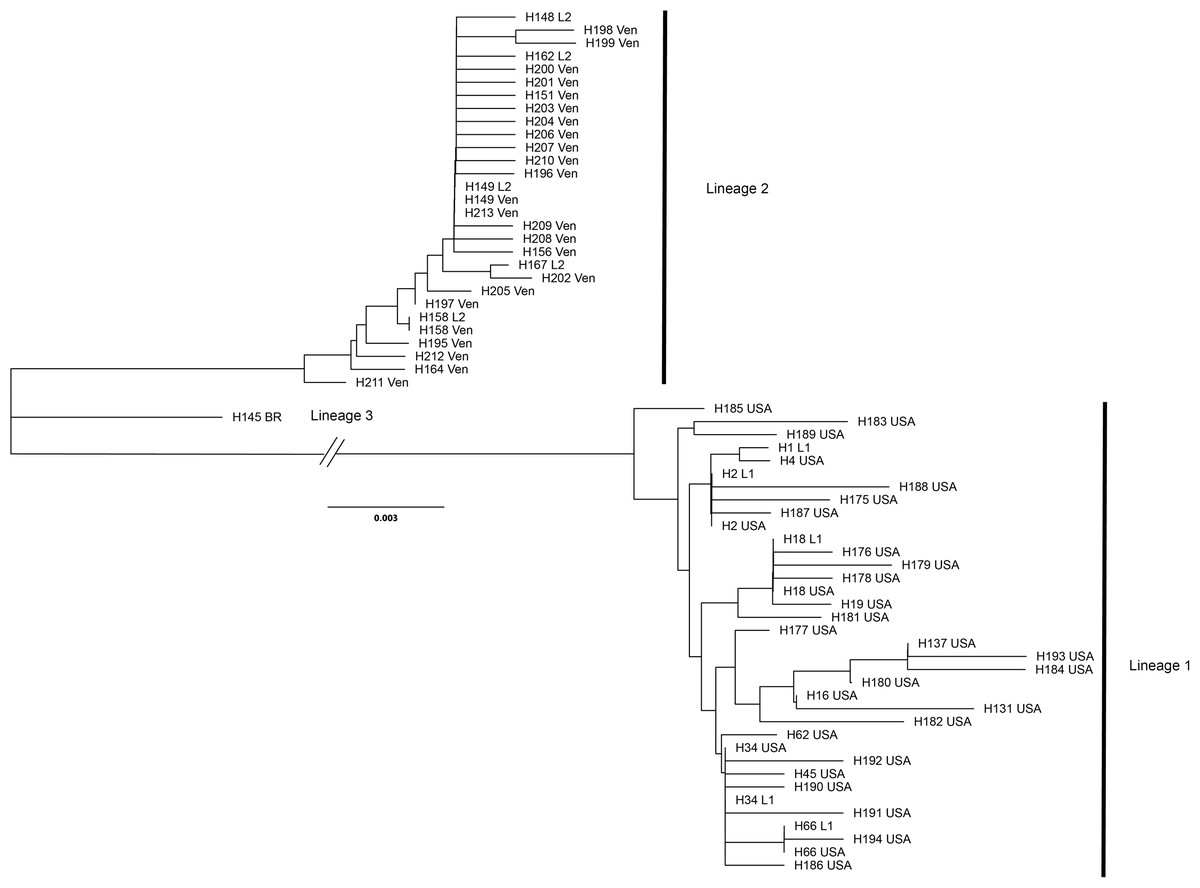
Figure 5: Unrooted dendrogram of the most common reference specimen haplotypes and each haplotype observed in samples of commercial products.
Unrooted neighbor-joining dendrogram of the five most common COI haplotypes in the Lineage 1 and 2 and the most common Lineage 3 haplotype observed in reference specimens aligned with haplotype sequences from commercial Callinectes sapidus products purchased labeled as either “Product of USA” or “Product of Venezuela” from grocery stores in Maryland and Virginia. USA, “Product of USA”; VEN, “Product of Venezuela."
Haplotype diversity was higher in US-labeled crabmeat (h = 0.87) than Venezuelan-labeled crabmeat (h = 0.57). Nucleotide diversity (π) was higher in the US- than Venezuelan-labeled products, as was the average number of pairwise differences (Table 2). DIVEIN analysis identified the same 22 highly dichotomous nucleotide positions observed in the reference specimen sequences as responsible for the lineage split (Table 1).
Pairwise Fst values between US- and Venezuelan-labeled products were significant (Table 3). Pairwise values between US-labeled crabmeat and MAB and GMx were not significant (0.004, p = 0.14; 0.001 p = 0.25). However, significant structure was shown between US-labeled crabmeat and the SAB, CAR, and BR regions (p = <0.001) (Table 3). When compared to the lineages described for reference specimens, pairwise Fst values between US-labeled products and Lineage 1 were not significant (0.004, p = 0.09) (Table 4). Pairwise Fst values were not significant between Venezuelan products and the CAR region (0.006, p = 0.05). Pairwise Fst values were significant between Venezuelan products and each of the three lineages (Table 4).
Within the [PROD] alignment, all samples from each labeled country of origin fell into two discrete clades with a between group mean p-distance of 2.77% (Table 5) and a within-group mean p-distance 0.44% and 0.14%, for USA- and Venezuelan-labeled products, respectively (Table 5).
In the [TOTAL] alignment, all haplotype sequences from tubs labeled as Product of the USA grouped with Lineage 1 while all sequences from tubs labeled as Product of Venezuela grouped with Lineage 2. The dendrogram with individual sequences of both the reference specimens and products is shown Fig. S2.
Additional commercial and retail products
Samples from additional commercial crabmeat products labeled as originating from Colombia, Nicaragua, and Turkey (one package each, N = 27 sequences total) were successfully sequenced but were not used in the full product analyses due to low sample numbers. For informational purposes, we constructed a NJ dendrogram of these samples along with representative references sequences from each lineage (Fig. S3; Table S2). All sequences (N = 5) from the product labeled as originating from Turkey aligned with Lineage 1 reference specimens. All sequences (N = 4) from the product labeled as originating from Nicaragua aligned with reference specimens from Lineage 2. Sequences from samples labeled as originating from Colombia (N = 10) were identified as two species, C. sapidus and C. bocourti. All of the C. sapidus sequences from the Colombian product (N = 4) aligned with reference specimens from Lineage 2 as well as commercial products from Venezuela.
From the 115 individual lumps of preserved crabmeat reanalyzed from the Warner et al. (2015) study, only 33 produced usable sequences. Sequences from these samples, previously determined via BLAST search to be C. sapidus, fell into two groups distinguished by a between-group mean p-distance of 2.95%. One group (N = 20) allied with Lineage 1, while the other (N = 13) allied with Lineage 2 (Fig. S4), suggesting that some of these products, that had already been genetically identified as C. sapidus, were potentially not of US origin.
Discussion
Genetic diversity in Callinectes sapidus
Callinectes sapidus has been previously shown to have high levels of local genetic diversity in mitochondrial genes (Feng, Williams & Place, 2017; Williams, Feng & Place, 2017). This high diversity has confounded attempts to study population dynamics of C. sapidus across relatively small geographic areas compared to its entire natural range (Rodrigues et al., 2017; McMillen-Jackson & Bert, 2004; Yednock & Neigel, 2014). However, we observed that when specimens are sampled from throughout the species’ disjointed distribution, signals emerge that separate crabs into two significantly different lineages within distribution area 1 (US to Venezuela), and a third lineage occurring in distribution area 2 (Brazil to Argentina) (Fig. 1).
The Yucatan peninsula region appears to be a boundary zone between Lineages 1 and 2, which is consistent with other marine taxa (Robertson & Cramer, 2014). The Cape Hatteras, NC area, another documented biogeographic boundary established by near-shore currents flowing north to south from the southern-most region of the MAB (Boschi, 2000; Epifanio & Garvine, 2001; Reeb & Avise, 1990; Shanks, 1988), also appears to be a biogeographic boundary in the current study.
Lineage 1 predominated in the MAB, SAB, and GMx whereas Lineage 2 predominated in the CAR. Similar to the findings by Rodrigues et al. (2017), we observed crabs allied with Lineage 1 to be geographically widespread but more concentrated in the US Atlantic coast and Gulf of Mexico. For Example, one reference specimen collected from Venezuela, one from Yucatan, Mexico, one from Puerto Rico, and three from Brazilian waters were allied with Lineage 1. We also observed 16 specimens grouping with Lineage 2 in the SAB. This accounts for the non-significant pairwise Fst values between the SAB and the MAB and GMx. Finding Lineage 2 specimens in the SAB was not implausible because natural transport of larvae from the Caribbean Sea is possible via the Gulf Stream and other smaller northbound currents flowing close to the coast before veering out to sea at Cape Hatteras. While elucidating exactly why these patterns exist is beyond the scope of this study, we concur with Rodrigues et al. (2017) that human mediated transport might explain the existence of Lineage 1 specimens in areas such as the Brazilian coast where oceanographic forces are predicted to prevent transport.
Identifying Callinectes sapidus products of non-US origin
Between 2000 and 2016, an average of 42 million pounds of “swimming crab” products were imported annually into the US, primarily from Indonesia, China, Thailand, the Philippines, Vietnam, and India. These countries accounted for an average of 87% of total imports over that period. Of the remaining percentage of swimming crab imports, the majority (10% of the total) came from Central and South America (NOAA National Marine Fisheries Service Office of Science and Technology CFS, 2017a). Latin American countries account for only 10%, on average, of total imports of “Portunidae” crabmeat in the US, and the Caribbean and Atlantic coasts of Latin American countries are the only ones with fisheries for C. sapidus within its natural range. Venezuela and Mexico combined accounted for 81–99% of imported products labeled as either Callinectes or Portunidae from Latin America between 2000 and 2017 (AVG 93% ± 5%). Typically, more crabmeat is imported to the US from Mexico than from any other Latin American country (Fig. 3). Three species of swimming crab comprise the bulk of commercial crabmeat produced in Mexico: C. bellicosus and C. arcuatus Ordway, 1863 on the Pacific coast and C. sapidus in the Gulf of Mexico, with the majority of Mexican crabmeat produced from the two Pacific species (Monterey Bay Aquarium Seafood Watch, 2018). The majority of C. sapidus harvest in Mexico comes from the states of Veracruz, Campeche, and Tamaulipas (Monterey Bay Aquarium Seafood Watch, 2018). We predict that the majority of crabs from these areas would belong to Lineage 1, which current results show predominates in US waters. Therefore, C. sapidus crabmeat products from Mexico likely could not be accurately identified as of US or non-US origin based on genetic analysis using the DNA barcode region. However, because the majority of Mexican exports are the two Pacific Callinectes species, we consider Venezuela to be the primary source of imported C. sapidus products into the US at present. Venezuelan exports mainly originate from the geographically restricted area of Lake Maracaibo in Zulia State (Oesterling & Petrocci, 1995); all 18 reference specimens from this area belonged to Lineage 2, and had a between-group mean genetic distance of 3.15% from Lineage 1.
All subsamples from tubs labeled “Product of the USA” were allied with Lineage 1, the predominant lineage in the reference specimens collected in the continental US (Fig. 5). Pairwise Fst values between US crabmeat products and Lineage 1 were not significant (Table 3), thus failing to reject the null that there is no difference between the populations. However, pairwise Fst values were significant between US crabmeat and Lineages 2 and 3 and the Venezuelan-labeled crabmeat products (Table 3).
All subsamples from Venezuelan-labeled were allied with Lineage 2 and had a mean p-distance of 0.16% to the reference specimens in that lineage (Table 5). However, pairwise Fst values between Venezuelan products and Lineage 2 were significant. While H149 was the most common haplotype encountered in our Venezuelan reference samples and commercial products, only four other haplotypes (H151, H156, H158, and H164) were shared between the two datasets. This may be an artefact of sampling because there are relatively few reference specimens from Venezuela. While more sampling in the Caribbean region is required, the informative sites identified for Venezuelan products by DIVEIN are consistent with Lineage 2.
Pairwise Fst values do not support population structure between MAB and the entire GMx. We observed 100% of reference specimens from the MAB and USGMx (N = 228) to align with Lineage 1. Considering that 94% of the total domestic harvest of C. sapidus currently occurs in the MAB and USGMx, if a commercial product labeled as “Product of the USA” was found to contain a high percentage of sequences aligning with Lineage 2 or Lineage 3, that would not be consistent with current US fisheries, would indicate that the product was potentially not of US origin, and would warrant further investigation.
In contrast, Pairwise Fst values between SAB and MAB or SAB and GMx are significant, indicating that there are substantial differences between these populations. This is undoubtedly due to that fact that in reference specimens from the SAB (N = 98), ~84% aligned with Lineage 1 and ~16% aligned with Lineage 2. With respect to commercial production in North Carolina, more than 90% of harvest takes place in the Albemarle and Pamlico Sounds (North Carolina Environmental Quality, 2018), the latter of which spans the MAB/SAB divide. All seven of our specimens from North Carolina were collected from approximately 100 miles south of the MAB/SAB divide and all allied with Lineage 1. While the lineage distribution pattern we observed here indicates that Lineage 2 crabs are unlikely to occur in the MAB region of NC, much more sampling is needed from the entire NC coast to more fully understand lineage distribution. The other three states within the SAB accounted for only 6% of the total domestic harvest between 2010 and 2015 (Fig. 2). If domestic production in the SAB increases in the future, the utility of the DNA barcode for identifying geographic origin will need to be re-evaluated.
It should be noted that products from Puerto Rico, as a US territory, are allowed to be labeled as “Products of the USA.” Taking into account that 21/22 sequences from reference C. sapidus collected in Puerto Rico belonged to Lineage 2, the barcode region of COI would not be useful for determining the US vs non-US origin of this product. According to a survey of Puerto Rican fisheries (Matos-Caraballo, 2012), commercial harvest of swimming crabs is negligible at present. If this changes in the future, or if there is a need to distinguish crabmeat imported from Venezuela from crabmeat harvested locally in Puerto Rico, alternative methods for identification of product origin will need to be assessed.
Latin American countries such as Brazil, Chile, Colombia, Ecuador, Guatemala, Nicaragua, Panama, and Peru have contributed only a small portion of Callinectes/Portunidae imports over the past 17 years (NOAA National Marine Fisheries Service Office of Science and Technology CFS, 2017b). During the course of this study, we only encountered two Latin American C. sapidus products at retail not from Venezuela: one each from Nicaragua and Colombia. Callinectes sapidus sequences from these products were all congruent with Lineage 2 (Fig. S3). Interestingly, the product of Colombian origin, labeled as “blue crab (C. sapidus),” also contained the sympatric congener C. bocourti (Fig. S3).
One package of frozen crabs labeled as “Product of Turkey,” that was not yet commercially available in the US was acquired directly from the distributor at a seafood trade show in 2016. The five specimens shared one haplotype (H179) that is allied with Lineage 1 (Table S2). Interestingly, this haplotype is not found in our reference specimens but was found in two US-labeled crabmeat products (Table S2). At present, the utility of the DNA barcode for determining geographic origin of C. sapidus from outside of its natural range is unknown and would require extensive sampling of the introduced populations.
Regulatory considerations
The FDA and the NMFS both have the regulatory authority to investigate and interdict on cases of seafood fraud. The NMFS Office of Law Enforcement is responsible for investigating potential violations of the Lacey Act of 1900 16 U.S.C. § 3371-3378 (2017). In particular, the Lacey Act of 1900; False Labeling Offenses 16 U.S.C. § 3372(d) (2017) prohibits, among other things, making or submitting a false record, account, or label for fish or wildlife that has been or is intended to be transported in interstate or foreign commerce.
The FDA first issued Compliance Policy Guide § 540.300 (1977) Crabmeat – Product Name in 1977 which stated, “Product labeled as “crabmeat,” from domestic sources, without qualification, are generally accepted to have been derived from the blue crab, C. sapidus.” In 1996, CPG 7108.04 was revoked and replaced with CPG 7108.26 Common or Usual Names for Seafood in Interstate Commerce (Compliance Policy Guide § 540.750, 1996), which announced FDA’s intent to use a document known as “The Seafood List” as the primary guidance for the selection of acceptable market names for seafood products (Food and Drug Administration, 2018). At present, The Seafood List contains 13 species of portunioid crab that are commonly used in the production of crabmeat around the world. Only C. sapidus has the acceptable market name of “blue crab.” Other commonly harvested species of Callinectes and Portunus, as well as O. punctatus (De Haan, 1833) and Scylla serrata (Forskål, 1775), have the acceptable market name of “swimming crab.” Furthermore, Section 403(a)(1) of the Federal Food Drug and Cosmetic Act (2018) states that a food shall be deemed misbranded if its labeling is false or misleading in any particular. An example of how a market name may be false or misleading is by indicating a geographical origin that is not truthful. Geographical designations used as part of a market name should truthfully represent the geographic origin of the species (Misbranding of Food 21 CFR § 101.18(c), 2017), or otherwise conform to the provisions of Misbranding of Food 21 CFR § 101.18(c)(4) (2017). Therefore, it is potentially a violation of both the Food Drug and Cosmetic and Lacey Acts when crabmeat is not correctly identified on its label or in its labeling.
Conclusions and future directions
Based on our sequence data from reference specimens with known collection locations, we propose that the US vs. non-US origin of C. sapidus crabmeat products, with some exceptions, may be inferred by considering the lineage composition of product subsamples sequenced for the DNA barcode region of COI. As pointed out by Ogden & Linacre (2015), geographic assignment techniques are not universal and often must be considered specific to both a single species and a defined investigative question. Therefore, the usefulness of COI in determining geographic origin of crabmeat may not carry over to other genera, species, or regulatory frameworks. In the present case, evolutionary factors have led to high haplotype diversity but detectable, consistent sequence divergence in the DNA barcode region between MAB, SAB, GMx, Caribbean, and Brazilian populations. The consistency of sequence divergence illustrates the utility of the DNA barcode region for implying the US or non-US origin of commercial C. sapidus products. However, due to the observed lineage overlaps, likely from ocean currents and/or human mediated transport, there are limitations to delimiting crabmeat from regions such as the SAB, Gulf coast of Mexico, or domestic harvest in Puerto Rico or other Caribbean US territories. If production or importation of C. sapidus from these regions increases in the future, alternative genetic methods will be required to verify product origin.
The RAD/GBS method utilized by Plough (2017) showed promise in refining region of origin determination even further. Although sample numbers were small, Plough (2017) found a distinction between MAB and USGMx samples. This RAD/GBS method could be applied to identifying C. sapidus of Mexican gulf coast or Puerto Rican origin and might also be useful in other taxa where country of origin is a pressing regulatory concern.
Supplemental Information
An unrooted neighbor-joining phylogram of sequences from the 3′ region of COI generated for this study and sequences deposited in GenBank by Rodrigues et al. (2017) (Popset 1019591405).
Sequences from our study labeled with state and country, sequences from Rodrigues et al. (2017) labeled with GenBank accession number and their location codes.
An unrooted neighbor-joining dendrogram of all Callinectes sapidus sequences from the barcode region of COI generated for this study.
Leaf tips are named by specimen ID and state or country where the specimen was collected.
An unrooted neighbor-joining dendrogram of COI sequences of Callinectes sapidus products from Colombia, Nicaragua, and Turkey with reference sequences from each lineage of the present study.
Turkish samples fall within the lineage 1 while Colombian and Nicaraguan samples fall within the lineage 2. Six of the 10 Colombian samples Callinectes bocourti.
Neighbor-joining dendrogram of new DNA Barcode region sequences from crab cakes in the study by Warner et al. (2015).
Neighbor-joining dendrogram of new DNA Barcode region sequences from crab cakes in the study by Warner et al. (2015) with the initial four reference sequences of C. sapidus in the FDA Reference Sequence Standard Library and other species of Callinectes all deposited in the University of Louisiana at Lafayette Zoological Collection (ULLZ). A total of 20 sequences join with the reference specimens from Maryland and Louisiana and the remaining 13 sequences join with the reference specimen from Venezuela.