Thermal biology and swimming performance of Atlantic cod (Gadus morhua) and haddock (Melanogrammus aeglefinus)
- Published
- Accepted
- Received
- Academic Editor
- María Ángeles Esteban
- Subject Areas
- Aquaculture, Fisheries and Fish Science, Marine Biology, Climate Change Biology
- Keywords
- Critical swimming speed, Metabolic rate, Critical thermal maximum, Physiology, Fish, Climate change, Thermal tolerance, Temperature, Climate warming
- Copyright
- © 2019 Norin et al.
- Licence
- This is an open access article distributed under the terms of the Creative Commons Attribution License, which permits unrestricted use, distribution, reproduction and adaptation in any medium and for any purpose provided that it is properly attributed. For attribution, the original author(s), title, publication source (PeerJ) and either DOI or URL of the article must be cited.
- Cite this article
- 2019. Thermal biology and swimming performance of Atlantic cod (Gadus morhua) and haddock (Melanogrammus aeglefinus) PeerJ 7:e7784 https://doi.org/10.7717/peerj.7784
Abstract
Atlantic cod (Gadus morhua) and haddock (Melanogrammus aeglefinus) are two commercially important marine fishes impacted by both overfishing and climate change. Increasing ocean temperatures are affecting the physiology of these species and causing changes in distribution, growth, and maturity. While the physiology of cod has been well investigated, that of haddock has received very little attention. Here, we measured the metabolic response to increasing temperatures, as well as the critical thermal maximum (CTmax), of cod acclimated to 8 and 12 °C and haddock acclimated to 12 °C. We also compared the swimming performance (critical swimming speed, Ucrit) of cod and haddock at 12 °C, as well as the Ucrit of 12 °C-acclimated cod acutely exposed to a higher-than-optimal temperature (16 °C). The CTmax for cod was 21.4 and 23.0 °C for 8- and 12 °C-acclimated fish, respectively, whereas that for the 12 °C-acclimated haddock was 23.9 °C. These values were all significantly different and show that haddock are more tolerant of high temperatures. The aerobic maximum metabolic rate (MMR) of swimming cod remained high at 16 °C, suggesting that maximum oxygen transport capacity was not limited at a temperature above optimal in this species. However, signs of impaired swimming (struggling) were becoming evident at 16 °C. Haddock were found to reach a higher Ucrit than cod at 12 °C (3.02 vs. 2.62 body lengths s−1, respectively), and at a lower MMR. Taken together, these results suggest that haddock perform better than cod in warmer conditions, and that haddock are the superior swimmer amongst the two species.
Introduction
Overfishing and climate change, independently or in combination, are affecting fish populations in the world’s oceans (Perry et al., 2005; Cheung et al., 2009, 2013; Pecl et al., 2017). Poleward migrations and distribution shifts of fishes have been observed in response to warming for various cold-water species (Perry et al., 2005; Cheung, Watson & Pauly, 2013; Pörtner et al., 2014; Fossheim et al., 2015) and increased temperatures are affecting their physiology (Pörtner & Knust, 2007; Hofmann & Todgham, 2010; Pörtner & Peck, 2010; Audzinjoyte et al., 2019) resulting in, amongst other things, reduced size-at-age and lower fishery yields (Cheung, Watson & Pauly, 2013; Daufresne, Lengfellner & Sommer, 2009; Baudron, Needle & Marshall, 2011).
In addition to the relatively slow, but steady, effect of human-induced climate warming (Bradshaw & Holzapfel, 2006; Lima & Wethey, 2012), the temperature experienced by individual fish varies significantly both within and across populations. This is due to differences or variations in physiology and behaviour (Kobler et al., 2009; Killen, 2014), geographic location, year-to-year and seasonal temperatures, depth, current, and/or age of the fish (Malmberg & Blindheim, 1994; Ottersen, Michaelsen & Nakken, 1998; Morita et al., 2010; Rijn et al., 2017). Thus, fish are faced with both temporal and spatial fluctuations in ambient temperature, which requires adjustments in physiological and behavioural traits over both short and long time scales. Since key physiological functions such as growth, metabolic rate, and swimming performance have species-specific temperature optima that combine to determine a species’ preferred temperature (Pörtner & Peck, 2010; Fry, 1971; Clark, Sandblom & Jutfelt, 2013; Speers-Roesch & Norin, 2016), the capacity for physiological adaptation and acclimation will, along with behavioural adaptations, define the temperature window for growth and reproduction as required for successful long-term maintenance of a population (Pörtner, 2002; Wang & Overgaard, 2007; Holt & Jørgensen, 2015). On shorter time-scales, the thermal dependence of swimming performance and metabolic rate is important when fish are migrating and foraging through thermally variable environments (Neat & Righton, 2007; Neuenfeldt, Andersen & Hinrichsen, 2009) or actively tracking a preferred temperature (Ottersen, Michaelsen & Nakken, 1998; Claireaux et al., 1995; Castonguay et al., 1999; Begg & Martinesdottir, 2002; Cavole et al., 2016).
Aerobic scope (AS), the difference between the aerobic maximum metabolic rate (MMR) and the standard (resting) metabolic rate (SMR), is a measure of the energy available for physical activity, growth, and reproduction (Fry, 1971; Clark, Sandblom & Jutfelt, 2013; Farrell, 2016). It has been suggested that AS determines both the thermal preference and thermal tolerance of fishes (Pörtner & Knust, 2007; Pörtner & Farrell, 2008), although this is currently being debated (Clark, Sandblom & Jutfelt, 2013; Holt & Jørgensen, 2015; Gräns et al., 2014; Norin, Malte & Clark, 2014; Schulte, 2015; Pörtner, Bock & Mark, 2017, 2018; Jutfelt et al., 2018). Nonetheless, measurements of swimming performance and metabolic rate provide insights into the thermal biology of a species. Generally, swimming performance and metabolic rate increase with rising water temperature up to an optimum (Brett, 1971; Gamperl et al., 2002), after which performance is decreased (Lefevre, 2016). However, there are also examples where the thermal optimum can approach the species’ upper critical (or lethal) temperature (Clark, Sandblom & Jutfelt, 2013; Gräns et al., 2014; Norin, Malte & Clark, 2014; Lefevre, 2016).
Atlantic cod (Gadus morhus) and haddock (Melanogrammus aeglefinus) are two very important commercial species affected by both overfishing (Beaugrand et al., 2003; Brander, 2005; Cardinale et al., 2012) and ongoing climatic warming (Perry et al., 2005; Cheung et al., 2013; Cheung, Watson & Pauly, 2013; Baudron, Needle & Marshall, 2011; Rogers et al., 2011). Furthermore, the two species overlap broadly in their distribution and ecology (Eriksen et al., 2012; Renaud et al., 2012), with the haddock appearing to prefer slightly warmer temperatures than cod (Cheung, Watson & Pauly, 2013; Eriksen et al., 2012) and responding differently to temperature in terms of distribution, growth, and age-at-maturity (Baudron, Needle & Marshall, 2011; Eriksen et al., 2012). Despite the similarities (and dissimilarities) between the two species, little effort has been made to directly compare the physiological performance of cod and haddock under different temperature scenarios; information that is important for understanding how these species may respond to climate warming, and how they may compete both amongst each other and with other species they may encounter as their distributions continue to change (Renaud et al., 2012).
The effect of temperature on the swimming performance and metabolic rate of cod has been investigated in several studies (Claireaux et al., 1995; Schurmann & Steffensen, 1997; Claireaux et al., 2000; Sylvestre et al., 2007; Tirsgaard, Behrens & Steffensen, 2015). Surprisingly, however, the effect of acclimation temperature on these parameters and on upper thermal tolerance (upper critical temperature) of this species has not been extensively investigated (but see Tirsgaard, Behrens & Steffensen, 2015; Kelly et al., 2014). The metabolic physiology of haddock has not received nearly as much attention (Peck, Buckley & Bengtson, 2005; Lankin et al., 2008; Perez-Casanova, Lall & Gamperl, 2010; Tytler, 1969) and, with the exception of Tytler (1969), the few studies that exist on haddock have focused on routine metabolic rate (RMR) (Peck, Buckley & Bengtson, 2005; Lankin et al., 2008; Perez-Casanova, Lall & Gamperl, 2010), with swimming performance and active or maximum metabolic rates being largely overlooked. Clearly, such information would be beneficial, as maximum metabolic performance and swimming speed are important not only for these species’ migration and foraging, but likely also for their susceptibility to capture by (or ability to escape from) fishing gear (Pörtner & Peck, 2010; He, 1993; Breen et al., 2004; Hollins et al., 2018; Thambithurai et al., 2018).
Based on the above, the objectives of the present study were to: (1) examine the influence of acclimation temperature on the upper thermal tolerance (critical thermal maximum, CTmax) of cod by exposing fish from two acclimation groups (8 and 12 °C) to an acute (2 °C h−1) increase in water temperature until loss of equilibrium; (2) determine the effect of an acute temperature increase up to a supra-optimal temperature (i.e. from 12 to 16 °C) on the swimming performance and metabolic rate of cod using the well-established critical swimming speed (Ucrit) test (cf., Brett, 1964; Farrell, 2007); and (3) compare the thermal tolerance, swimming performance, and metabolic rates of cod and haddock acclimated to 12 °C (including examining whether metabolic parameters (e.g. MMR and AS) in these species differ when obtained using CTmax vs. Ucrit tests).
Materials and Methods
These studies were conducted in accordance with the guidelines of the Canadian Council on Animal Care and approved by the Institutional Animal Care Committee of Memorial University of Newfoundland (MUN), Canada (protocol #05-01-KG).
Fish
The cod used in these experiments were spawned from broodstock collected in Placentia Bay (Newfoundland, Canada), and reared at the Dr. Joe Brown Aquatic Research Building (JBARB) at MUN’s Ocean Sciences Centre (OSC). The haddock were spawned and reared at the National Research Council’s Sandy Cove aquaculture facility (Nova Scotia, Canada) until a size of 5–10 g, and then shipped to the OSC. Both species were held indoors at the JBARB in 3,000 L circular fibreglass tanks containing oxygenated seawater (~32 ppt salinity) at 10 °C. At least 3 weeks before experiments began, water temperature was changed to the experimental acclimation temperatures (8 ± 1 or 12 ± 1 °C). Fish used in the swimming performance experiments were exposed during this period to a current of approximately 1 body length per second (BL s−1). This current was created in the tanks using a vertical spray bar that received water from the tank inflow line (for the cod) or a submersible pump (Little Giant Co., Oklahoma City, OK, USA) placed at the bottom of the tank (for the haddock). During the holding and acclimation periods, the fish were exposed to an ambient photoperiod and fed commercial pellets, twice a day, to satiation. However, feeding was suspended 24 h before experimentation. All experiments were performed from August to November 2004.
Experimental details (respirometry)
Measurements of oxygen uptake rate , obtained using intermittent-closed respirometry (Clark, Sandblom & Jutfelt, 2013; Steffensen, 1989), were used as proxies for the fish’s aerobic metabolic rates at the different swimming speeds and temperatures (detailed below).
All experiments were conducted using a modified Blažka swim tunnel respirometer (6.81 L volume), composed of two Plexiglas tubes (10 and 15 cm in diameter, one inside the other), with conical-shaped end caps, an impellor, and a honeycomb plastic grid at the front to promote a laminar water flow (Waterloo Biotelemetry Institute, University of Waterloo, Waterloo, ON, Canada). In this swim tunnel, the fish swam in a stationary position in the swimming section (37 cm in length) of the inside tube, and water speed (i.e. revolutions of the impellor) was controlled by an electric motor. Water was continuously supplied to the swim tunnel at a rate of 5 L min−1 by a submersible pump (Little Giant Pump Co., Oklahoma City, OK, USA) placed in a large (120 L) reservoir adjacent to the swim tunnel. The water temperature in the reservoir was controlled using thermostatically-controlled circulating water baths (model 1013S; Fisher Scientific, Pittsburgh, PA, USA), which pumped water through stainless steel coils immersed in the reservoir. Oxygen tension in the reservoir was maintained at air saturation by bubbling air and/or pulsing pure oxygen into the water as needed. Water temperature and oxygen concentration in the swim tunnel were continuously monitored during the experiments using a peristaltic pump (Masterflex L/S model 77200-12; Cole-Palmer, Vernon Hills, IL, USA) to draw water past a galvanic oxygen electrode with thermal sensor (CellOx 325; WTW, Weilheim, Germany). This sensor was housed in a flow-through chamber (D-201; WTW, Weilheim, Germany) in an external circuit comprised of tubing with very low gas permeability (Tygon Food®; Cole Palmer, Inc., Vernon Hills, IL, USA). The oxygen electrode was connected to an oxygen metre (Oxi 342; WTW, Weilheim, Germany) with automatic temperature compensation, and water oxygen concentration was recorded in mg O2 L−1. The front portion of the respirometer was covered with black plastic during experiments to provide a darkened refuge and to minimise disturbance of the fish. This darkened section encouraged the fish to maintain its swimming position towards the front of the swim tunnel. The rear of the swimming section contained a stainless steel grid which, in order to prevent the fish from resting on the grid during swimming experiments, was connected to electrodes so that mild electrical stimuli (<5 V, ~0.2 A) could be applied.
measurements were made by stopping the flow of water into the swim tunnel respirometer and recording the drop in water oxygen content caused by the fish respiring inside the respirometer, after which (in mg O2 h−1 kg−1) was calculated as: where, V is volume of the respirometer and external circuit (6.81 L) minus the volume of the fish (assuming a density of 1 kg L−1), α is the decline in oxygen concentration during the closed phase of the respirometry cycle (mg O2 L−1 h−1), and M is body mass of the fish (kg). measurements were allometrically scaled (to a standard body mass of 100 g) using a mass-scaling exponent of 0.80 (Saunders, 1963; Reidy et al., 1995) as: where is the standardised (body-mass-adjusted) value, is the measured value, Mmeasured is the measured body mass, Mscaled is the body mass to which the values were standardised (100 g), and b is the mass-scaling exponent (0.80).
Experimental protocols
Metabolic rate and critical thermal maximum
Individual fish were transferred from the holding tank to the swim tunnel respirometer the evening before each trial and allowed to recover for at least 15 h. During this time, water was continuously supplied from the reservoir via the submersible pump. Oxygen levels were maintained at >90% air saturation, water velocity was 7.5 cm s−1 (~0.4 BL s−1) to ensure mixing within the swim tunnel, and water temperature was maintained at the fish’s acclimation temperature (8 or 12 °C). Thermal challenges began at 08:00–10:00 the next morning and lasted 6–8 h. In these experiments, the water temperature was increased at a rate of 2 °C h−1 until the fish lost equilibrium. The temperature at loss of equilibrium was recorded as the fish’s CTmax. was measured over 12 min intervals, starting at 8 or 12 °C and then for every 1 °C increase in temperature until CTmax. Immediately after the fish reached CTmax, they were removed from the swim tunnel and anaesthetised in 0.1 g L−1 MS-222. Fork length (L, cm) and body mass (M, g) were measured and the condition factor (K) was calculated as K = 100 ∙ M ∙ L−3.
The at 8 °C (cod) or 12 °C (cod and haddock) was taken as the fish’s RMR, and the maximum recorded during the thermal challenges was taken as the fish’s temperature-induced maximum metabolic rate (MMRT). In the absence of SMR measurements, temperature-induced aerobic scope (AST) was approximated as MMRT – RMR, bearing in mind that AS is defined as MMR – SMR.
Acute thermal sensitivity (i.e. temperature coefficient, Q10) of metabolic rate was calculated as: where is the at the higher temperature (T2) and is the at the lower temperature (T1) between which Q10 is calculated.
Metabolic rate and swimming performance
As per the protocol for the CTmax tests, fish were transferred into the swim tunnel the evening prior to the start of each trial, and allowed to settle in the tunnel at a low water velocity of 7.5 cm s−1 for at least 15 h. Two different protocols were used in the swimming performance (Ucrit) experiments: First, to examine whether the swimming performance and activity metabolism of 12 °C-acclimated cod and haddock differed, was recorded for both species at 12 °C, then water velocity was increased in increments of 5 cm s−1 (starting from 7.5 cm s−1) every 20 min until the fish fatigued. At each swimming speed, was measured over 12 min, beginning 5 min after the speed was increased. Second, to examine the effect of an acute temperature increase on the swimming and metabolic performance of cod, another group of 12 °C-acclimated cod were exposed to a 2 °C h−1 increase in water temperature to 16 °C, held at 16 °C for a further 2 h, and then subjected to a Ucrit test as described above.
Exhaustion in all experiments was determined as the inability of the fish to separate itself from the rear grid of the respirometer after two or three mild electrical stimuli. At the end of the Ucrit test, the fish were removed from the swim tunnel and anaesthetised in 0.1 g L−1 MS-222 for measurements of body mass and fork length. Condition factor was calculated as described above.
The of fish swimming at 7.5 cm s−1 at 12 °C (cod and haddock) or 16 °C (cod) was taken as the fish’s RMR. The maximum recorded (usually at, or immediately before, the maximum swimming speed) was taken as the swimming-induced MMR (MMRS). SMR was estimated by extrapolating the vs. swimming speed relationship back to a swimming speed of zero. For the purpose of comparing with AST, swimming-induced aerobic scope (ASS) was also approximated as MMRS – RMR, which underestimated the ‘true’ AS (i.e. MMR – SMR) by ~20% (see Results for details).
Critical swimming speed was calculated as: where U is the velocity at which the fish swam for the entire time increment, Ui is the velocity increment (5 cm s−1), tf is the time elapsed from the last change in water velocity to fatigue, and ti is the time increment between stepwise increases in water velocity (20 min).
The fish’s cost of transport (COT, mg O2 km−1 kg−1) was calculated as either their gross COT (COTgross) by dividing their absolute at a given velocity by swimming speed, or as their net COT (COTnet) by subtracting SMR from their before dividing by swimming speed. The optimal swimming speed (Uopt) was then calculated by fitting third-order polynomials to the COTnet vs. U relationship for each fish, and finding the swimming speed (in 0.1 cm s−1 bins) corresponding to the minimum COTnet (i.e. COTmin).
Statistics
Statistical analyses were performed using SigmaPlot 11 (Systat Software Inc., San Jose, CA, USA). One-way ANOVAs, followed by Holm–Sidak post hoc tests, were performed to assess differences between groups with respect to body mass, fork length, condition factor, SMR, RMR, maximum metabolic rate (MMRT or MMRS), aerobic scope (AST or ASS), CTmax, Ucrit, Uopt, and COTmin. All data presented in the text, figures, and tables are means ± s.e.m. The level of statistical significance for all tests was P < 0.05, but differences at the P < 0.10 level are also noted in the tables.
Results
Metabolic rate and critical thermal maximum
Routine metabolic rate for the 8 °C-acclimated cod was significantly lower than the RMR for 12 °C-acclimated cod by 25.2% (P = 0.046; Table 1), but not different from the RMR of 12 °C-acclimated haddock (P = 0.240). There was also no difference in RMR between the species at 12 °C (P = 0.174) (Table 1). Except for the first 1 °C increase for the 8 °C-acclimated cod and 12 °C-acclimated haddock, oxygen uptake increased at a relatively constant rate in all groups until MMRT was reached at 18.9 ± 0.4, 20.3 ± 0.7, and 21.7 ± 0.5 °C for 8 °C-acclimated cod, 12 °C-acclimated cod, and 12 °C-acclimated haddock, respectively (Fig. 1). The Q10 value for from 8 to 19 °C (i.e. from RMR to MMRT) for 8 °C-acclimated cod was 2.14 ± 0.24, whereas it was 1.97 ± 0.27 from 12 to 20 °C for 12 °C-acclimated cod. These values are slightly higher than the Q10 value from 12 to 22 °C for 12 °C-acclimated haddock (1.87 ± 0.04), but no significant differences were detected in Q10 values between groups (P > 0.05). Close to the fish’s CTmax, for all three groups tended to plateau or decrease slightly (Fig. 1). This plateau just before CTmax was often coincident with struggling, an observation suggesting that the fish were under physiological and/or behavioural stress.

Figure 1: Metabolic rate of cod and haddock during warming.
Metabolic rate ( ; means ± s.e.m.) for cod acclimated to 8 °C (black circles, solid black line; n = 9), cod acclimated to 12 °C (white circles, broken black line; n = 9), and haddock acclimated to 12 °C (grey triangles, solid grey line; n = 8) as measured during 2 °C h−1 warming challenges (i.e. critical thermal maximum, CTmax, tests). Lines are third order polynomials. Numbers next to symbols indicate reduced sample size due to variability in the CTmax measurement or exclusion of individuals exhibiting abnormally high activity levels (i.e. struggling).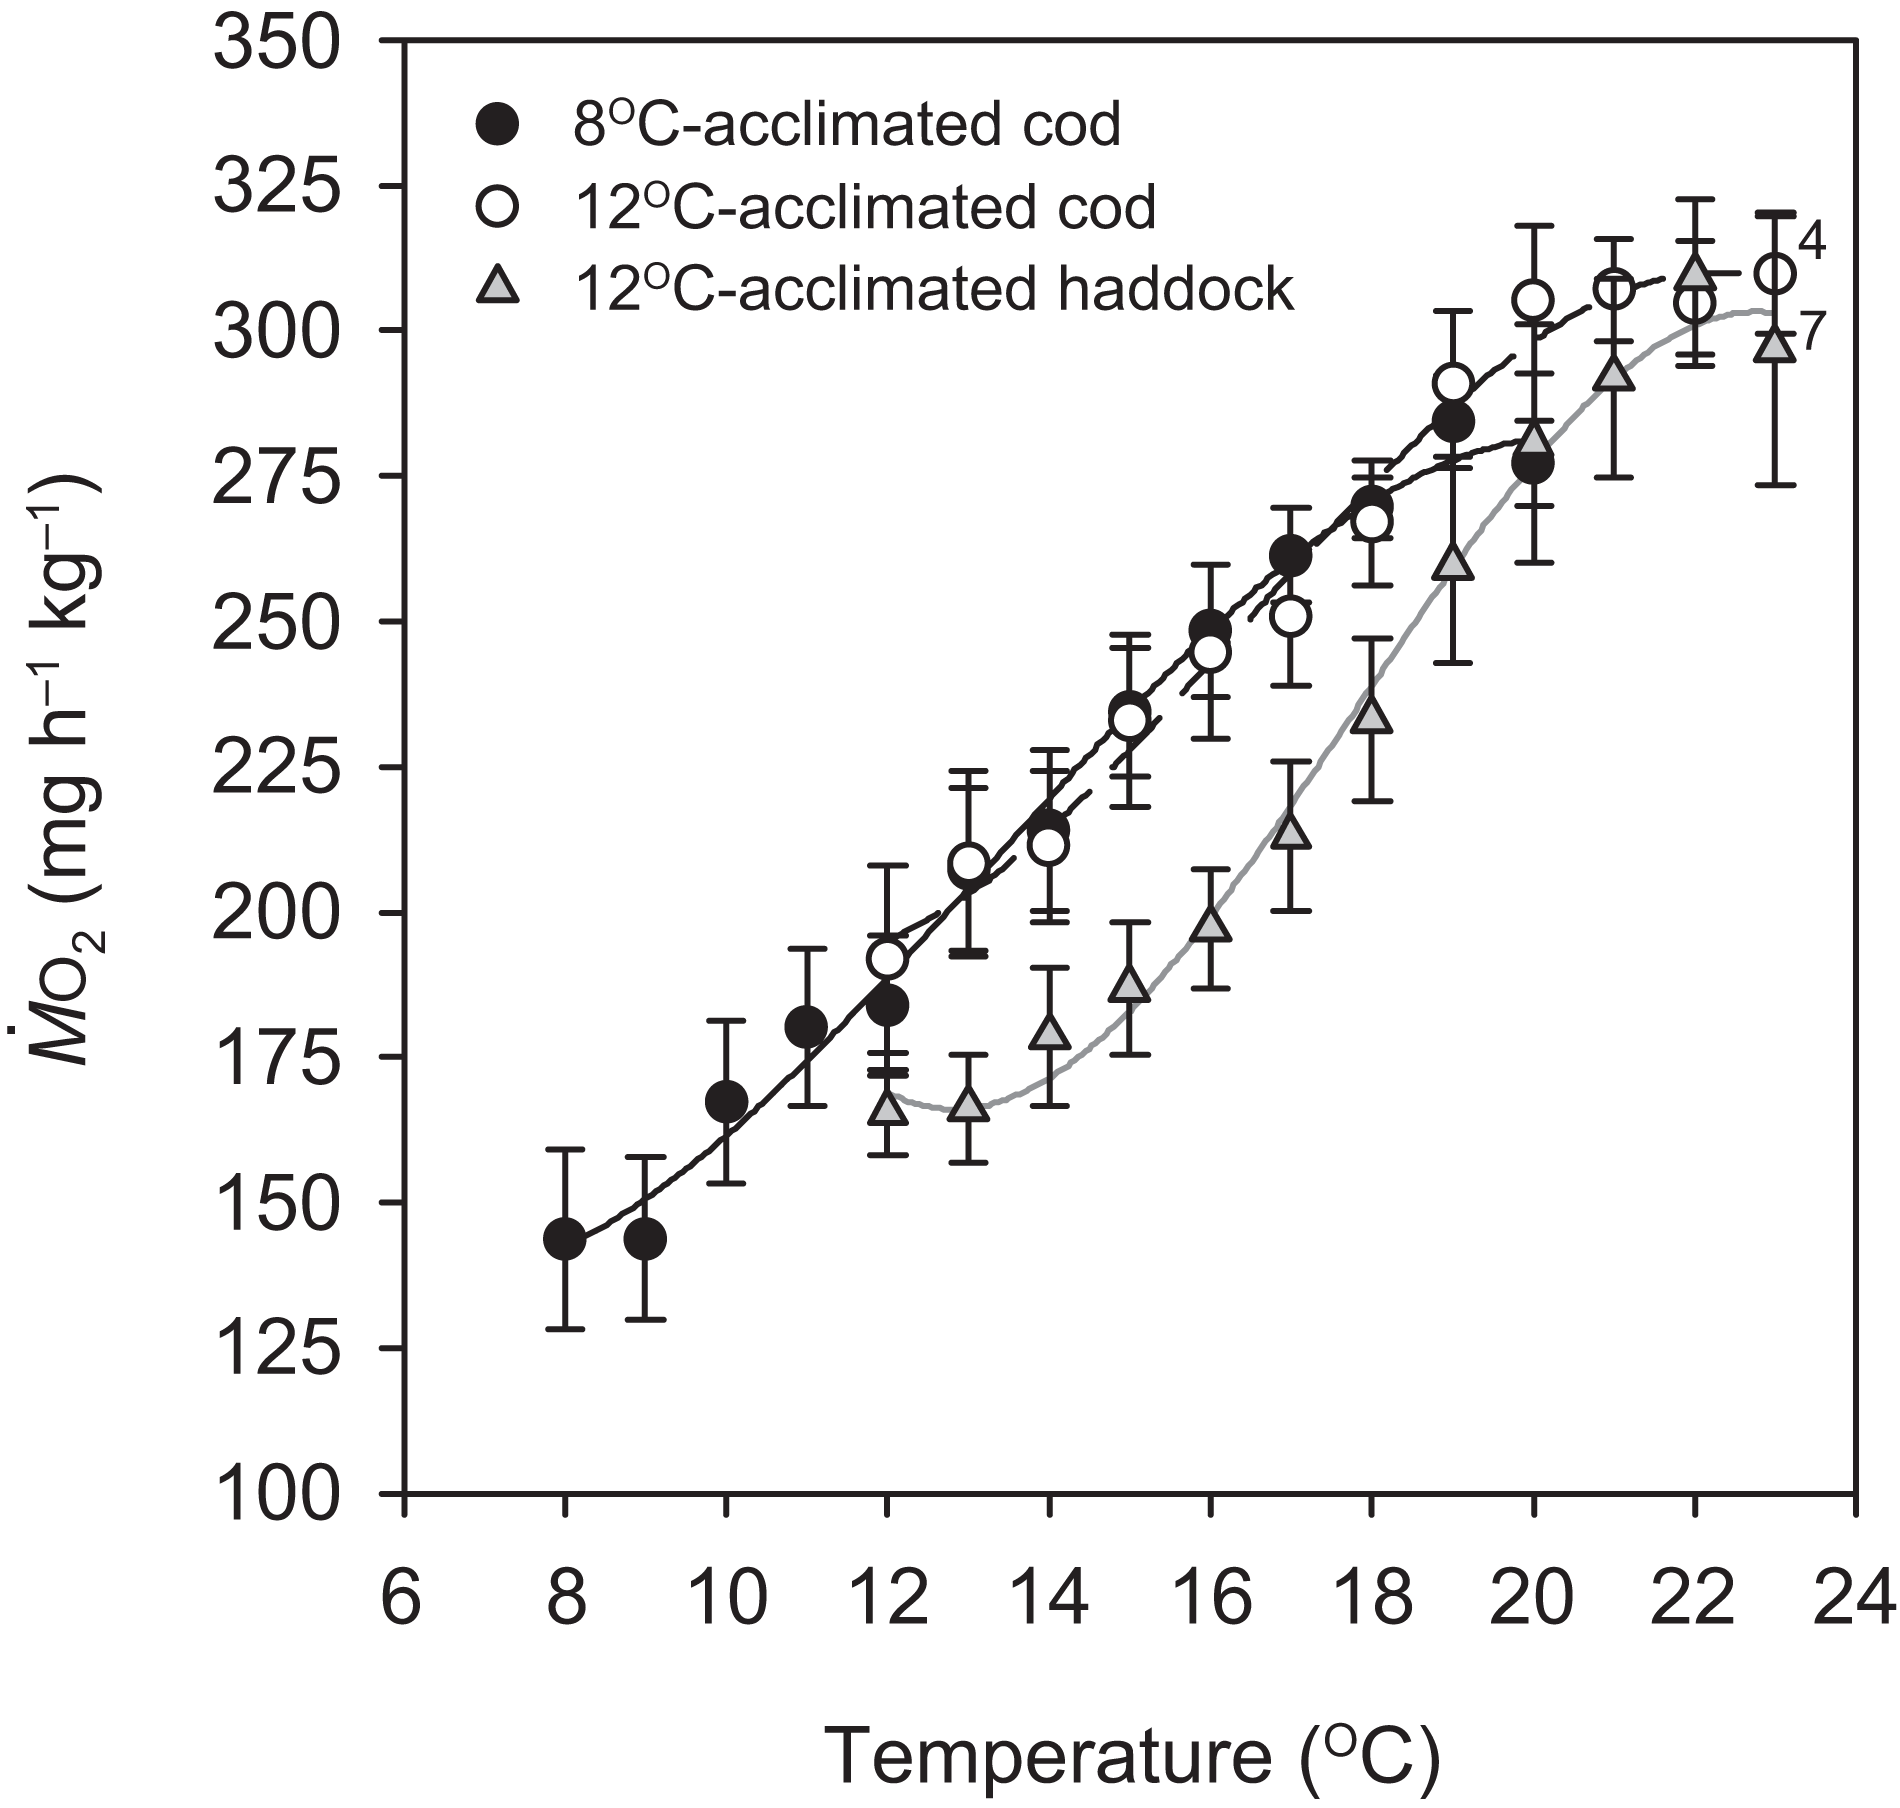
| 8 °C-acclimated cod | 12 °C-acclimated cod | 12 °C-acclimated haddock | |
|---|---|---|---|
| n | 9 | 9 | 8 |
| M (g) | 73.0 ± 1.7a | 64.6 ± 3.6b | 64.4 ± 1.56b |
| L (cm) | 21.6 ± 0.2a | 20.8 ± 0.3b | 18.7 ± 0.2c |
| K | 0.72 ± 0.02a | 0.71 ± 0.03a | 0.99 ± 0.03b |
| RMR (mg O2 h−1 kg−1) | 143.6 ± 15.5a (134.7 ± 14.4(d)) |
191.9 ± 16.2b (175.3 ± 14.6(e)) |
165.5 ± 7.0a,b (151.4 ± 6.5(d,e)) |
| MMRT (mg O2 h−1 kg−1) | 285.5 ± 7.9a (267.9 ± 7.1a) |
315.2 ± 8.4b (290.8 ± 6.9b) |
331.0 ± 6.3b (302.8 ± 4.8b) |
| AST (mg O2 h−1 kg−1) | 141.8 ± 18.3a,b (133.2 ± 17.1(d,e)) |
123.3 ± 16.4a (115.6 ± 16.4(d)) |
168.0 ± 6.1b (151.4 ± 5.6(e)) |
| CTmax (°C) | 21.4 ± 0.3a | 23.0 ± 0.3b | 23.9 ± 0.3c |
Temperature-induced maximum metabolic rate was significantly lower for 8 °C-acclimated cod when compared to both 12 °C-acclimated cod (P = 0.010) and haddock (P < 0.001), whereas the MMRT of 12 °C-acclimated cod and haddock did not differ significantly (P = 0.165) (Table 1). Although neither RMR nor MMRT of the 12 °C-acclimated cod and haddock differed significantly, there was a significant difference in AST between the two groups (P = 0.028), with haddock having a 36.3% larger AST (Table 1). In contrast, AST did not differ significantly between 8- and 12 °C-acclimated cod (P = 0.460) or between 8 °C-acclimated cod and 12 °C-acclimated haddock (P = 0.216).
Critical thermal maximum was 1.6 °C lower for 8- than 12 °C-acclimated cod (P < 0.001) (i.e. 21.4 ± 0.3 vs. 23.0 ± 0.2 °C, respectively) (Table 1), indicating that acclimation temperature had a significant effect on the thermal tolerance of this species. CTmax was also significantly lower for 12 °C-acclimated cod than haddock (P = 0.031) (Table 1), but only by 0.9 °C on average, with values for individual cod ranging from 21.7 to 24.0 °C and those for individual haddock ranging from 22.9 to 25.0 °C. No significant relationships were observed between any of the metabolic rates (RMR, MMRT, or AST) and CTmax within a particular group (linear regressions: P = 0.148–0.816 for RMR, 0.463–0.710 for MMRT, and 0.234–0.624 for AST). However, MMRT (but not RMR or AST) was positively related to CTmax across groups and species (r2 = 0.244, P = 0.010) (Fig. 2).
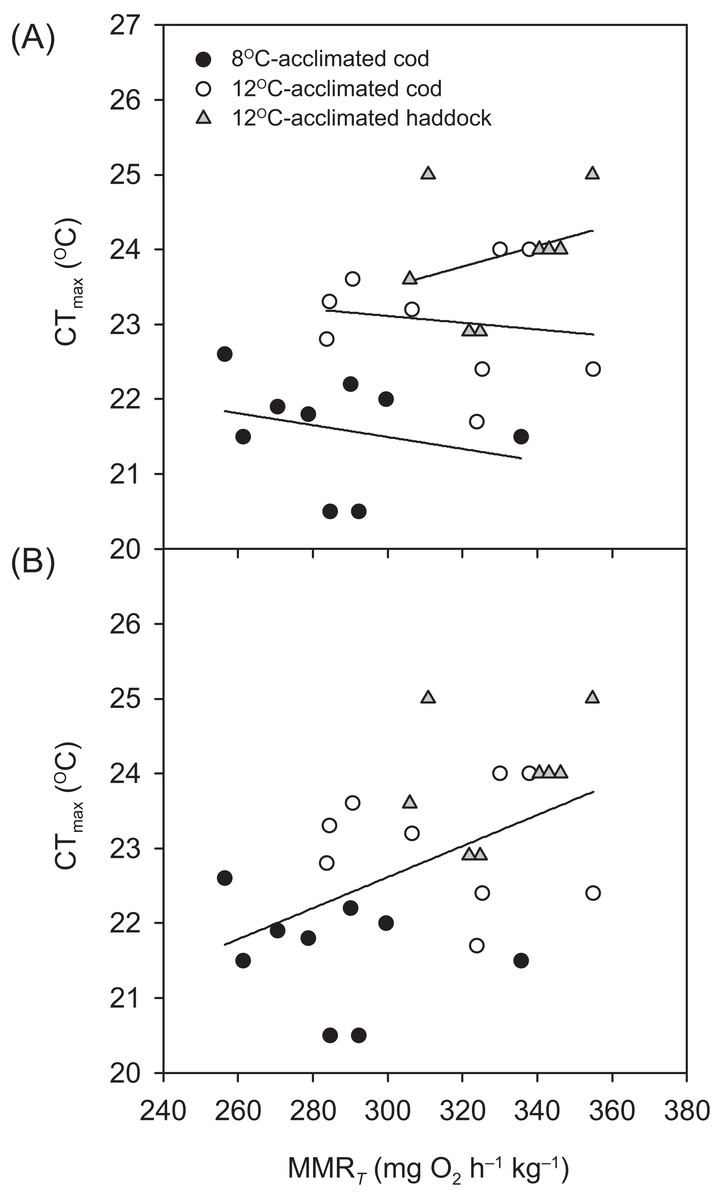
Figure 2: Temperature tolerance of cod and haddock in relation to their maximum metabolic rates.
Critical thermal maxima (CTmax) vs. temperature-induced maximum metabolic rates (MMRT) for individual cod acclimated to 8 °C (black circles; n = 9) or 12 °C (white circles; n = 9), and haddock acclimated to 12 °C (grey triangles; n = 8), as measured during the 2 °C h−1 warming challenges (i.e. CTmax tests). (A) There were no significant relationships between MMRT and CTmax for individual groups (r2 < 0.093, P > 0.463). However, (B) a high MMRT was associated with a high CTmax across groups and species (r2 = 0.244, P = 0.010), but CTmax was not related to either aerobic scope (r2 = 0.050, P = 0.270) or routine metabolic rate (r2 = 0.011, P = 0.610).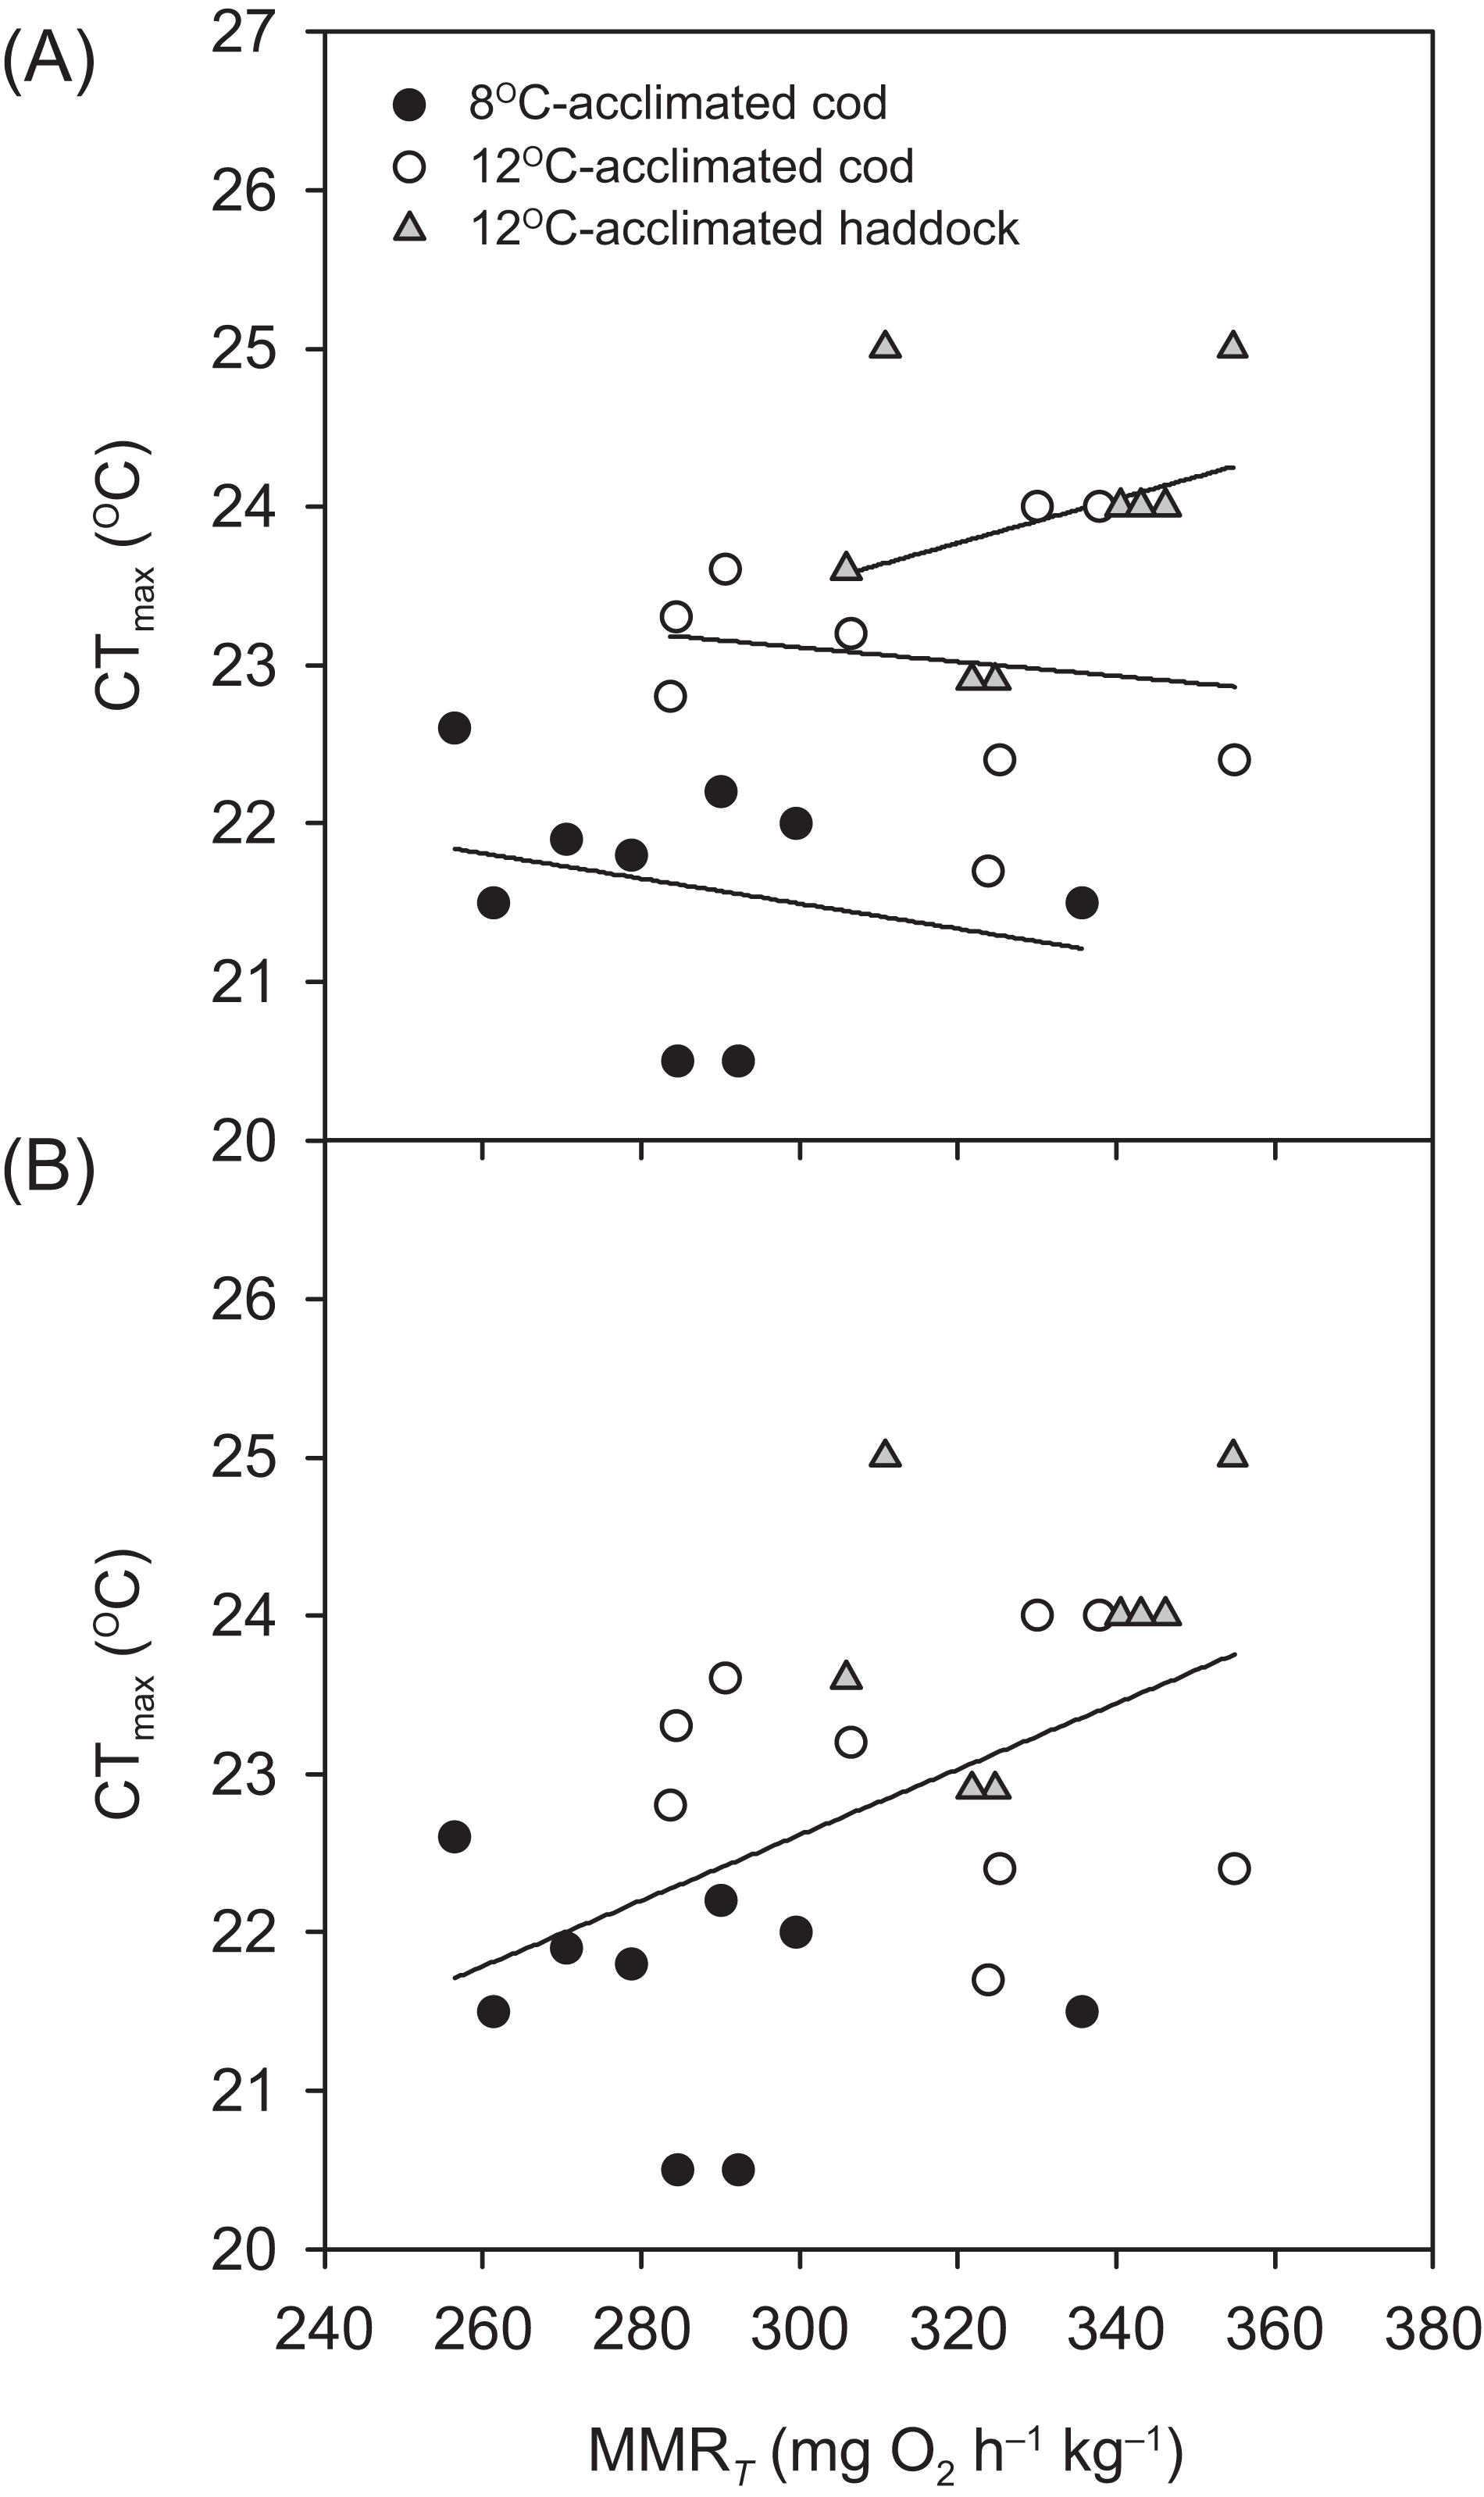
Metabolic rate and swimming performance
Both the SMR and the RMR for the three groups were significantly different (Table 2). The SMR of 12 °C-acclimated cod at 12 °C was higher than the SMR of 12 °C-acclimated haddock at 12 °C by 85.9% (P = 0.003), and the SMR of 12 °C-acclimated cod at 16 °C was higher than the SMR of both 12 °C-acclimated cod (P = 0.003) and haddock (P < 0.001) at 12 °C by 45.2% and 170.0%, respectively. The RMR of 12 °C-acclimated cod at 12 °C was higher than the RMR of 12 °C-acclimated haddock at 12 °C by 54.9% (P = 0.005), and the RMR of 12 °C-acclimated cod at 16 °C was higher than the RMR of both 12 °C-acclimated cod (P = 0.002) and haddock (P < 0.001) at 12 °C by 38.5% and 114.7%, respectively.
| Cod, 12 °C | Cod, 16 °C | Haddock, 12 °C | |
|---|---|---|---|
| n | 8 | 9 | 8 |
| M (g) | 67.6 ± 5.4a | 61.3 ± 2.9a | 63.0 ± 1.8a |
| L (cm) | 20.9 ± 0.6a | 20.9 ± 0.3a | 18.7 ± 0.2b |
| K | 0.73 ± 0.04a | 0.67 ± 0.02a | 0.96 ± 0.02b |
| SMR (mg O2 h−1 kg−1) | 156.7 ± 15.2b (144.0 ± 13.8b) |
227.6 ± 19.4a (205.2 ± 16.0a) |
84.3 ± 4.2c (76.9 ± 4.1c) |
| RMR (mg O2 h−1 kg−1) | 185.0 ± 15.5b (170.0 ± 14.1b) |
256.3 ± 17.8a (231.1 ± 14.4a) |
119.4 ± 7.1c (108.9 ± 6.8c) |
| MMRS (mg O2 h−1 kg−1) | 315.0 ± 13.8a,b,(e) (289.1 ± 9.8a) |
353.3 ± 16.2a,(d) (319.7 ± 14.5a) |
284.9 ± 6.0b,(f) (259.5 ± 4.7b) |
| ASS (mg O2 h−1 kg−1) | 130.0 ± 18.6a,b (119.0 ± 16.6a,b) |
97.0 ± 18.0a (88.5 ± 16.8a) |
165.5 ± 12.3b (150.6 ± 11.0b) |
| Ucrit (cm s−1) | 54.7 ± 1.4a,(d) | 50.6 ± 1.9a,(e) | 56.5 ± 1.4a,(d) |
| Ucrit (BL s−1) | 2.62 ± 0.09a | 2.42 ± 0.08a | 3.02 ± 0.09b |
| Uopt (cm s−1) | 25.1 ± 2.3a | 23.1 ± 1.4a | 21.4 ± 0.7a |
| Uopt (BL s−1) | 1.21 ± 0.12a | 1.11 ± 0.06a | 1.14 ± 0.04a |
| COTmin (mg O2 km−1 kg−1) | 55.4 ± 7.7a | 40.3 ± 10.9a | 52.3 ± 7.0a |
For all groups, the relationship between and swimming speed could be described by a hydrodynamic-based power function, although after 42.5 cm s−1, a slight plateauing of was observed prior to the fish reaching their Ucrit (Fig. 3). Throughout the Ucrit test, the of the three groups was in the order: cod at 16 °C > cod at 12 °C > haddock at 12 °C, and this pattern was reflected in the fish’s COTgross (Fig. 4A). For example, COTgross was 10.4–44.9% lower for haddock than for cod at 12 °C across swimming speeds.

Figure 3: Metabolic rate of cod and haddock during swimming.
Metabolic rate ( ; means ± s.e.m.) vs. swimming speed (U) in either (A) cm per second (cm s−1) or (B) body lengths per second (BL s−1) for cod swimming at 12 °C (white circles, broken black line; n = 8), haddock swimming at 12 °C (grey triangles, solid grey line; n = 8), and cod swimming at 16 °C after an acute increase from 12 °C (black circles, solid black line; n = 9), as measured during the critical swimming speed (Ucrit) tests. Numbers next to symbols indicate reduced sample sizes due to some individuals fatiguing earlier than others at the highest swimming speeds. Although third-order polynomials (solid light grey lines in the background) fitted the data better, three-parameter power functions were used to describe the relationship between and swimming speed as this is the hydro-dynamically most appropriate mathematical form of the relationship (cf., Papadopoulos, 2009; Horodysky et al., 2011; Roche et al., 2013). Equations in (A) are = 180.47 + 0.055U2.01 (r2 = 0.530), = 105.22 + 0.047U2.11 (r2 = 0.887), and = 249.39 + 0.013U2.35 (r2 = 0.389) for cod swimming at 12 °C, haddock swimming at 12 °C, and cod swimming at 16 °C, respectively. Corresponding equations in (B) are = 178.13 + 24.88U2.04 (r2 = 0.614), = 102.98 + 25.98U1.94 (r2 = 0.863), and = 249.18 + 15.64U2.42 (r2 = 0.398), respectively.
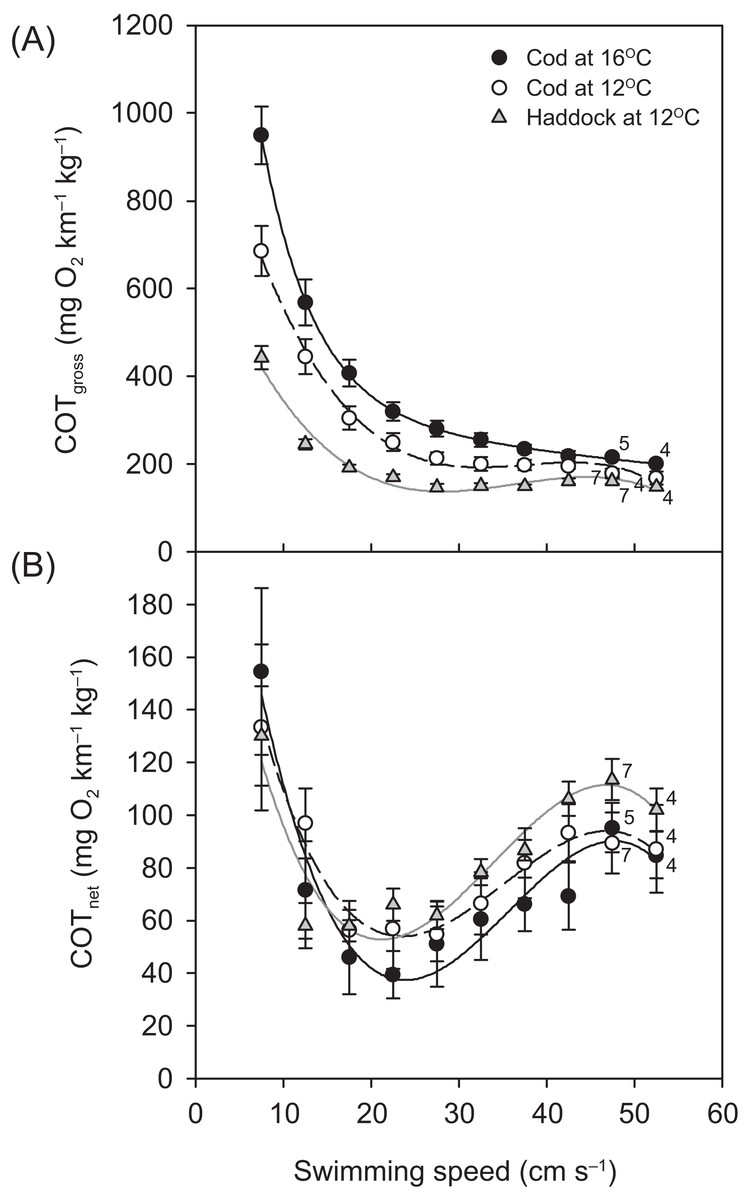
Figure 4: Cost of transport for cod and haddock at different swimming speeds.
Gross (A) and net (B) cost of transport (COT, means ± s.e.m.) for cod swimming at 12 °C (white circles, broken black line; n = 8), haddock swimming at 12 °C (grey triangles, solid grey line; n = 8), and cod swimming at 16 °C after an acute increase from 12 °C (black circles, solid black line; n = 9), as measured during the critical swimming speed (Ucrit) tests. Numbers next to symbols indicate reduced sample sizes due to some individuals fatiguing earlier than others at the highest swimming speeds. Equations in (A) are: COTgross = −0.0199U3 + 2.2186U2 – 80.926U + 1163.9 (r2 = 0.826), COTgross = −0.0152U3 + 1.6427U2 – 56.22U + 757.76 (r2 = 0.875), and COTgross = −0.0275U3 + 3.0753U2 – 112.87U + 1602.8 (r2 = 0.850) for cod swimming at 12 °C, haddock swimming at 12 °C, and cod swimming at 16 °C, respectively. Corresponding equations in (B) are: COTnet = −0.0064U3 + 0.6728U2 – 21.011U + 259.06 (r2 = 0.256), COTnet = −0.0070U3 + 0.7105U2 – 20.713U + 239.02 (r2 = 0.483), and COTnet = −0.0077U3 + 0.8259U2 – 26.197U + 297.88 (r2 = 0.313), respectively.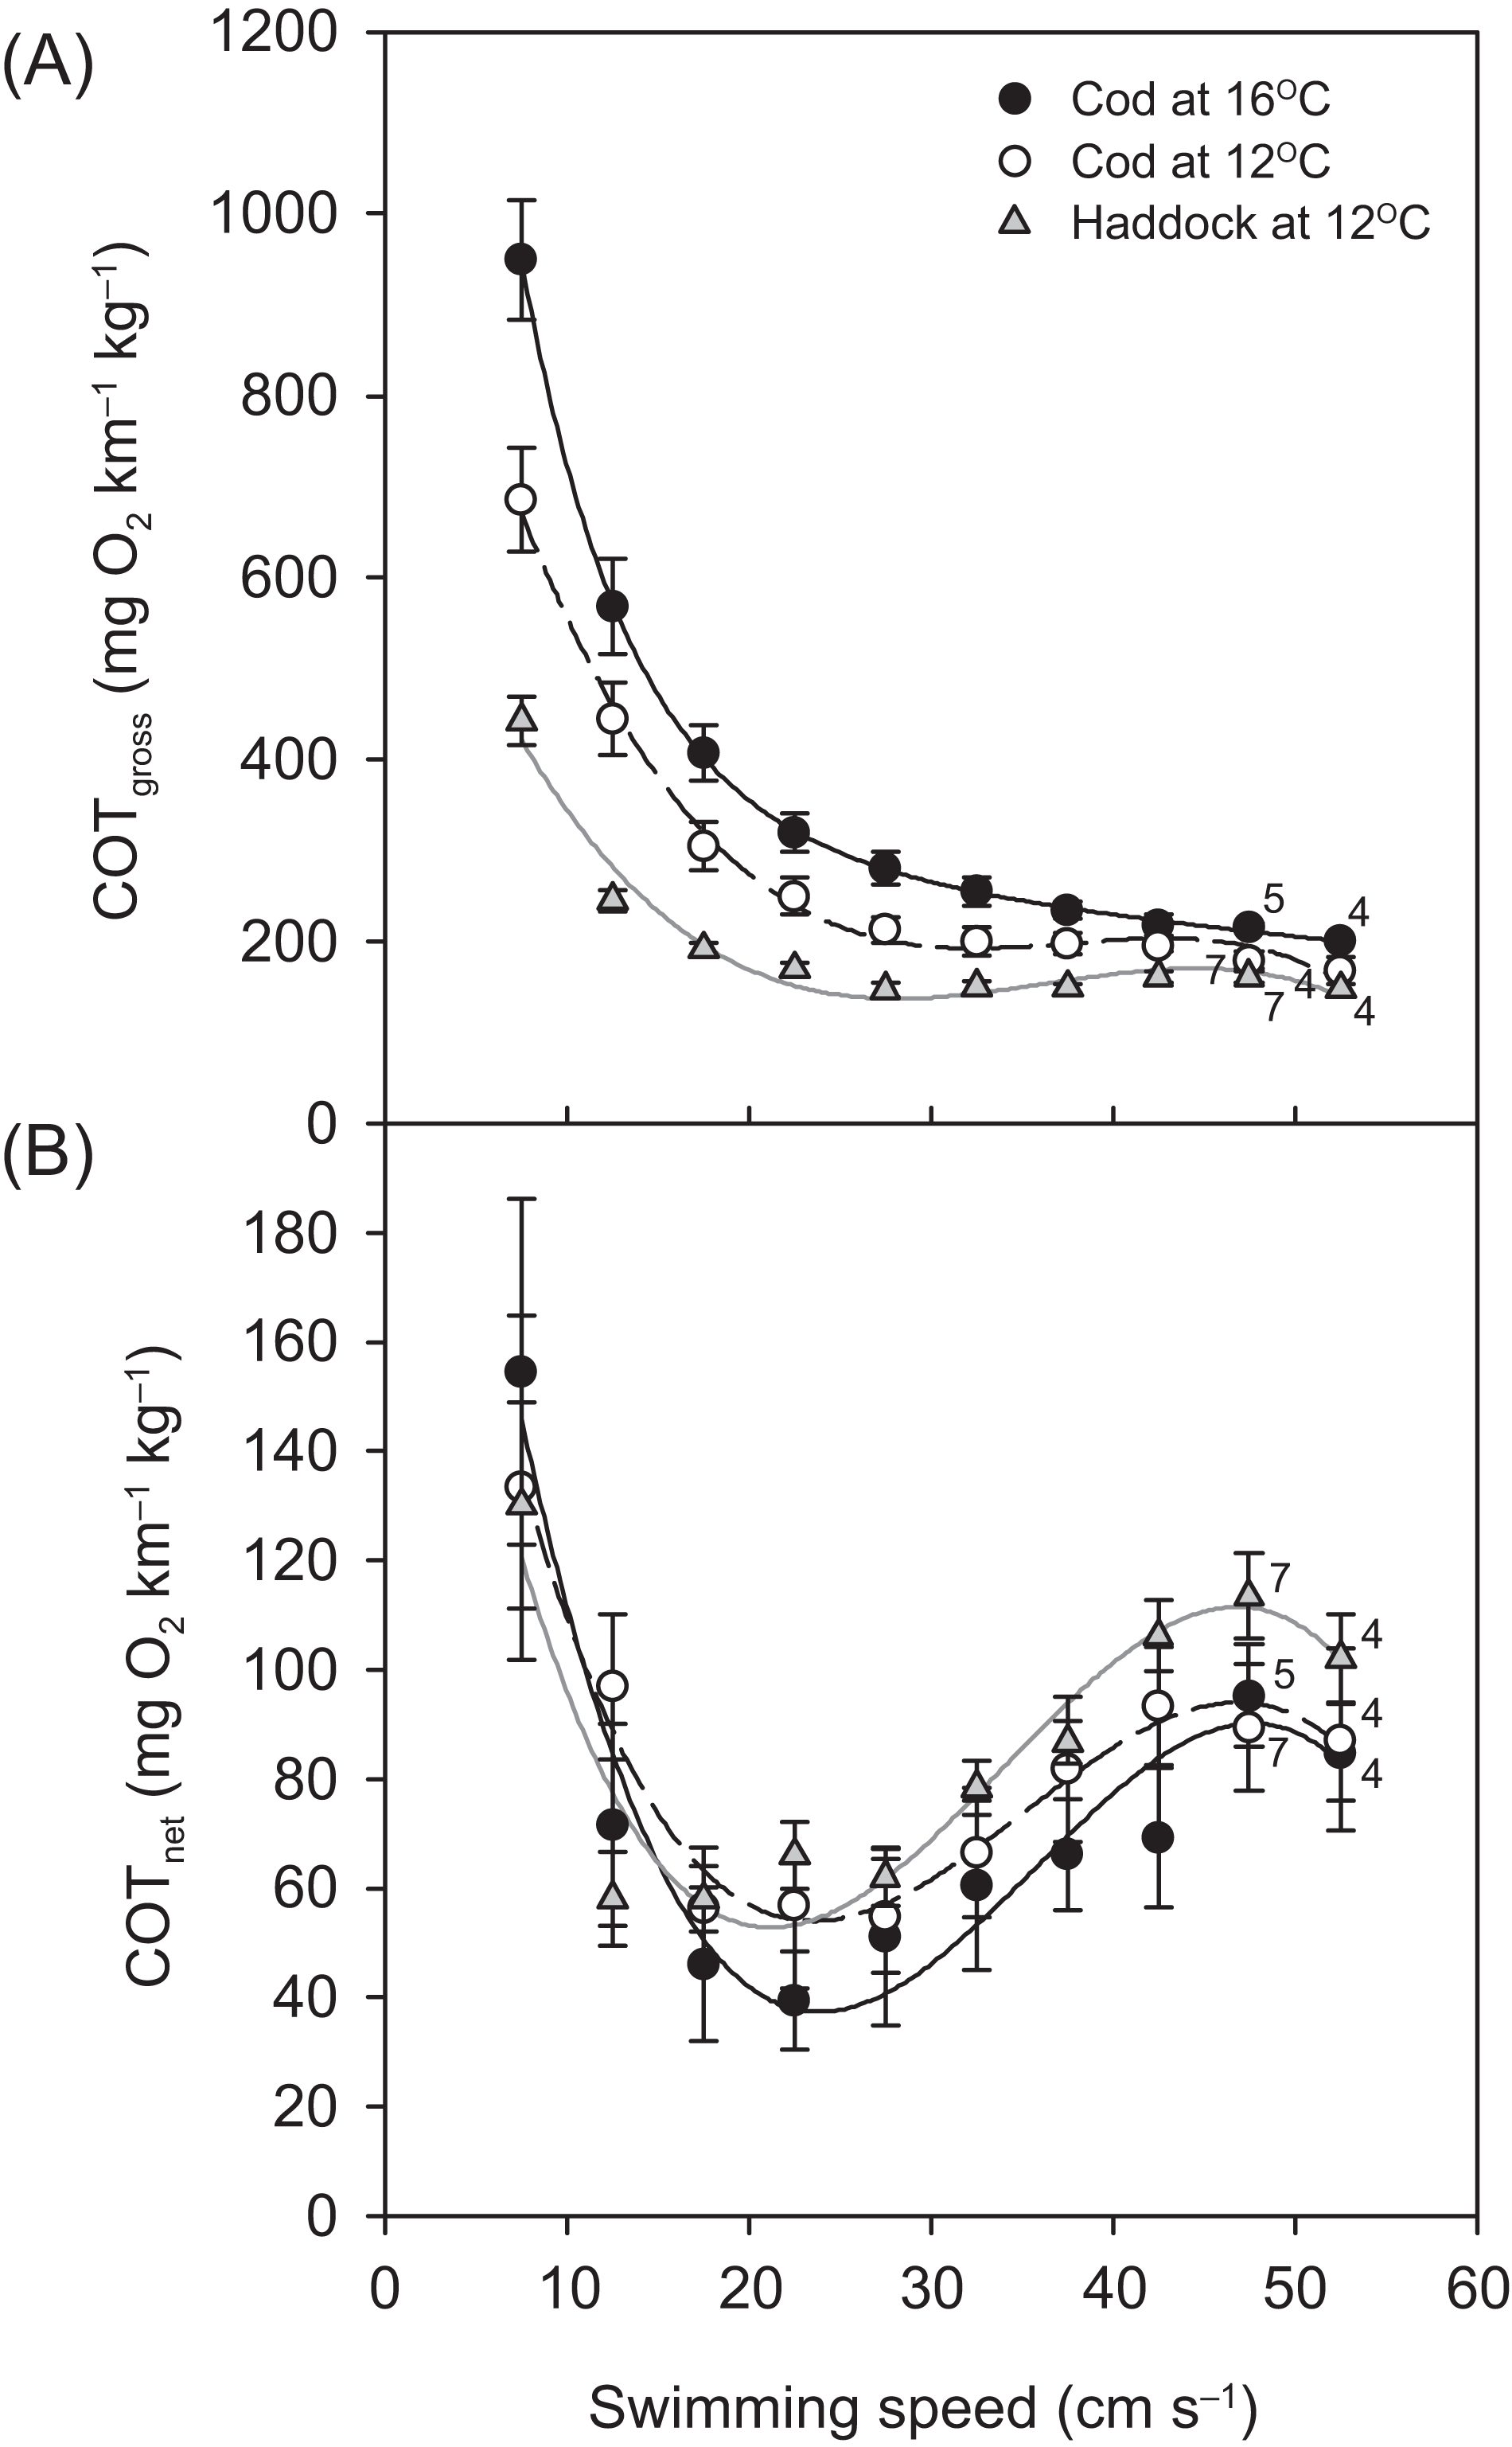
Swimming-induced maximum metabolic rate (MMRS) followed the same general pattern as for RMR and tended to increase from 12 to 16 °C for cod (by 12.2%; P = 0.050) (Table 2). When comparing between species, the MMRS of 12 °C-acclimated cod at 16 °C was significantly higher than the MMRS of 12 °C-acclimated haddock at 12 °C (P = 0.001), while the MMRS of both cod and haddock at 12 °C were the same (P = 0.127). ASS tended to show a reverse pattern, with the ASS of 12 °C-acclimated cod at 16 °C being significantly lower than the ASS of 12 °C-acclimated haddock at 12 °C (P = 0.008), while the other groups did not differ significantly (Table 2). The same statistical differences in ASS between groups were seen when using ASS calculated as MMRS–SMR (results not presented), rather than MMRS–RMR, with ASS being, on average, 17.5%, 17.9%, and 22.8% lower for 12 °C-acclimated haddock at 12 °C, 12 °C-acclimated cod at 12 °C, and 12 °C-acclimated cod at 16 °C, respectively, when calculated using RMR instead of SMR.
Although Ucrit was slightly higher for cod at 12 °C when compared to cod at 16 °C, these values were not significantly different (P = 0.114) (Table 2). However, the haddock’s Ucrit was significantly higher than that for cod at either 12 or 16 °C, but only when expressed as relative (BL s−1) swimming speed. This statistical discrepancy between relative vs. absolute Ucrit was not surprising since the haddock were slightly shorter than the cod (Table 2).
Although COTgross was consistently lower for the haddock as compared to the cod at 12 °C, and especially when compared to cod at 16 °C (Fig. 4A), COTnet (Fig. 4B) tended to show the opposite pattern. However, neither the Uopt nor the COTmin differed significantly between the three groups (P > 0.284) (Table 2).
Discussion
The main goals of this study were to: (1) assess the effect of acclimation temperature (8 vs. 12 °C) on Atlantic cod thermal tolerance (CTmax); (2) determine the effect of an acute increase in temperature (from 12 to 16 °C) on cod swimming and metabolic performance; and (3) compare all of these metrics between cod and haddock acclimated to the same temperature (12 °C).
As expected, the temperature to which the cod were exposed to prior to experiments had an important influence on their thermal tolerance; acclimation to a 4 °C higher temperature shifted the upper thermal limits upwards so that the mean CTmax observed for cod acclimated to 12 °C was 23.0 °C, which was 1.6 °C higher than for cod acclimated to 8 °C (CTmax = 21.4 °C) (Table 1). Bøhle (1974) found similar results for cod, with the lethal upper thermal limit for 50% of the fish (LT50) increasing from 19.5–20.0 °C for cod acclimated to 9 °C to 20.5 °C for cod acclimated to 16 °C. In addition, the 9 °C-acclimated cod had a mean mortality rate of approximately 5.8% min−1 when kept at 21 °C vs. a mortality rate of approximately 0.1% min−1 for the 16 °C-acclimated cod when exposed to the same temperature (Bøhle, 1974), emphasising that thermal history has an important effect on survival at extreme temperatures. The cod CTmax values from the present study also correspond well with those from Zanuzzo et al. (2019), where CTmax was 22.5 °C for 10 °C-acclimated cod experiencing the same rate of warming (2 °C h−1). Beitinger & Bennett (2000) compared 21 species of temperate fish and found that lethal temperatures increased with an increase in acclimation temperature at a rate of 0.5 °C per 1 °C increase in acclimation temperature. Most of the data from that study were based on freshwater species, which often show a larger window of thermal tolerance as compared to marine species. However, particularly in Northern hemisphere species such as the Atlantic cod, there is an ability to acclimatise and shift upper tolerance thresholds between seasons and in a latitudinal cline (Pörtner, 2002), and the CTmax results from the present study are in line with the thermal polygon proposed by Beitinger & Bennett (2000); i.e. a 4 °C difference in the cod’s acclimation temperature resulted in a 1.6 °C difference in CTmax.
When evaluating differences between cod and haddock acclimated to the same temperature (12 °C), the results show that haddock are slightly (yet significantly) more tolerant of high temperatures; they had a mean CTmax that was 0.9 °C higher than for cod (23.9 vs. 23.0 °C, respectively). As critical temperatures differ between species depending on latitude or seasonal temperature acclimatisation, and are therefore related to geographical distribution (Wang & Overgaard, 2007; Beitinger, Bennett & McCauley, 2000; Pörtner, 2001), these results were somewhat expected. The upper limit of the temperature range at which haddock are usually found is 13 °C, and this is 2 °C higher than the upper temperature determining cod distribution (~11 °C; Brander, 1995; Dutil & Brander, 2003). The slight difference in heat tolerance is also supported by the effect of temperature on metabolic rate, as cod tended to show a plateau in oxygen uptake rate around 20 °C, whereas haddock did not show signs of impaired function until 22 °C (Fig. 1). These results suggest that haddock may be able to tolerate a 1–2 °C higher acute increase in temperature, as compared to cod, before experiencing significant thermal stress.
The concept of ‘oxygen- and capacity-limited thermal tolerance’ proposes that AS plays a key role in setting the thermal performance of ectothermic animals such as fishes, with performance (and resulting fitness) optimised at the temperature where AS is highest (Farrell, 2016; Pörtner & Farrell, 2008; Pörtner, Bock & Mark, 2017; Pörtner, 2010; Eliason et al., 2011), although concern has been expressed about the universality of this concept (summarised in Jutfelt et al. (2018)). Along the same principles, upper thermal tolerance has been proposed to be constrained by a failure of the cardiorespiratory system to support increases in maximum oxygen uptake (i.e. MMR) at high temperatures, thereby reducing AS (Pörtner & Farrell, 2008; Eliason et al., 2011; Farrell et al., 2009). Based on the observed thermal distribution of wild cod (Dutil & Brander, 2003)—as well as bioenergetic models that take into account metabolic rate, life history, and behaviour (Holt & Jørgensen, 2015)—the temperature where performance and fitness is optimised for adult Atlantic cod is believed to be around 10 °C. The present study shows that cod swimming at 16 °C (i.e. well above that ‘optimal’ temperature), after an acute increase in temperature from 12 °C, tended to have a lower ASS than cod swimming at 12 °C (i.e. closer to the optimal temperature). However, the difference in ASS between the two groups was not significant (P = 0.174) and the lower ASS of cod at 16 °C was caused by a proportionally larger increase in RMR, rather than a decrease in MMRS. In fact, the MMRS of cod swimming at 16 °C tended to be higher than the MMRS of cod swimming at 12 °C (P = 0.050; Table 2). A more pronounced increase in the lower (i.e. resting or RMR) compared to the higher (i.e. MMR) end of the metabolic scale has previously been reported for cod acutely exposed to a 4 °C temperature increase (from 7 to 11 °C; Sylvestre et al., 2007), and is also seen in other fish species exposed to warming (Lefevre, 2016; Sandblom et al., 2016; Clark et al., 2011). The cod MMRS values in the present study (315.0–353.3 mg O2 h−1 kg−1 at 12 to 16 °C) are comparable to those reported by Sylvestre et al. (2007) at 11 °C (~338 mg O2 h−1 kg−1 when adjusted for body mass) and are similar to long-term (several months) acclimated cod where MMRS was lowest at 5 °C, higher at 10 °C, and highest (albeit also not significantly) at 15 °C (MMRS values from ~303.6–319.6 mg O2 h−1 kg−1 at 10–15 °C, after adjusting for body mass and temperature; Schurmann & Steffensen, 1997). Taken together, these results suggest that thermal performance of cod at supra-optimal, but sub-lethal, temperatures is not limited by maximum oxygen transport capacity. This conclusion is supported by the lack of a relationship between CTmax and MMRT within species and acclimation groups in the present study (Fig. 2A). Nonetheless, there was a positive relationship between CTmax and MMRT across all groups and species (Fig. 2B), and this does suggest that thermal tolerance and the capacity for maximum oxygen uptake are related. This overall relationship between thermal tolerance and MMRT, combined with similar trends between the three groups of fish in terms of the plateauing (or slight decrease) of as temperatures approach CTmax (Fig. 1), suggests that the physiological processes that determine the critical temperature could be the same. In a study by Pörtner et al. (2001), heat stress in cod was shown to elicit a temperature-dependent decrease in venous, but not arterial, oxygen tensions , which suggests that, in these fish, the capacity for oxygen uptake at the gills may be maximised such that arterial oxygen uptake does not become limiting. However, the drop in venous indicates that increased oxygen uptake from the blood during warming is not fully compensated for by circulatory performance (Pörtner et al., 2001). Sartoris et al. (2003) concluded that circulatory, rather than ventilatory, performance sets the limit of thermal tolerance in cod. Circulatory performance may thus become a limiting factor due to the temperature-dependent decrease in in venous blood and its impact on cardiac performance (Farrell et al., 2009). In addition, haemoglobin oxygen affinity is reduced in cod as temperature increases, and it has been shown that at 20 °C the in vitro oxygen binding capacity of haemoglobin of cod acclimated to 7 °C was no longer enough to achieve maximum saturation, suggesting that decreased blood oxygen carrying capacity influenced thermal limits (Gollock et al., 2006). This relationship is supported by our finding that in the present study did not rise after 20 °C in cod acclimated to 12 °C (Fig. 1). Despite such potential cardio-respiratory oxygen limitations at extreme temperatures, the maintained capacity for maximum oxygen uptake of cod swimming at 16 vs. 12 °C (Table 2; Fig. 3) suggests that oxygen does not become the limiting factor for this species until close to lethal limits, which agrees with recent findings on both cold- and warm-water fishes (Holt & Jørgensen, 2015; Gräns et al., 2014; Norin, Malte & Clark, 2014; Lefevre, 2016). Finally, it is equally possible that the overall relationship between CTmax and MMRT is driven by a loss of nervous function at extreme temperatures, rather than a causal oxygen limitation (Ern et al., 2015; Jutfelt et al., 2019). Such an effect could impair muscle function and reduce tissue oxygen demand, and thus explain the plateauing (or slight decreasing) of as temperatures approach CTmax (Fig. 1).
When comparing the CTmax and swimming experiments from the present study it is evident that 12 °C-acclimated cod reached the same MMR, and had the same AS, regardless of the method employed (i.e. temperature- and swimming-induced MMR were the same; Tables 1 and 2). These data support the findings of previous studies on Atlantic cod (e.g. Gollock et al., 2006 vs. Petersen & Gamperl, 2010, and Powell & Gamperl, 2016 show that AST is within 10–20% of ASS), and suggest that the physiological mechanisms responsible for increasing oxygen uptake to meet rising demands are similar during warming and physical activity in this species. The 12 °C-acclimated haddock, on the other hand, had a significantly lower RMR and MMR in the swimming experiment compared to the CTmax experiment, but maintained the same AS. The reason for these differences in RMR and MMR between the two haddock experiments, but not the cod experiments, is not known. However, they could potentially be related to the pre-experiment exercise protocol where the fish were ‘trained’ to swim against a constant current (~1 BL s−1) in their holding tank prior to introduction to the experimental swim flume respirometer. Since the cod is believed to be the inferior swimmer of the two species (see below) it is possible that exercise training improved the swimming efficiency of haddock (thereby lowering their at a constant swimming speed), but not of cod trained at ~1 BL s−1. Such an influence of training on may be related to muscle fibre dynamics, lowered levels of stress hormones, lowered energetically costly behavioural interactions (e.g. lowered aggressiveness) caused by schooling, as well as energetic savings from RAM ventilation (Farrell & Steffensen, 1987; Davidson, 1997, and references within). Regardless of the exact reasons behind the observed effect, both the RMR (119.4 ± 7.1 mg O2 h−1 kg−1) and MMRS (284.9 ± 6.0 mg O2 h−1 kg−1) of the haddock from the swimming experiment are comparable to earlier studies on this species: Perez-Casanova, Lall & Gamperl (2010) report values for RMR of 103.6–107.0 mg O2 h−1 kg−1 for ~40 g haddock at 11 °C, and Tytler (1969) report MMRS values at 10 °C of 276 ± 14 mg O2 h−1 kg−1 for ~156 g haddock.
The observed differences in metabolic rate between cod swimming at 12 and 16 °C were not directly reflected in their Ucrit, as Ucrit did not differ significantly between fish at 12 °C (2.62 ± 0.08 BL s−1) and 16 °C (2.42 ± 0.08 BL s−1). The lack of observed differences in Ucrit when cod are exposed to moderate to relatively high temperatures is in agreement with earlier studies on this species; although Schurmann & Steffensen (1997) and Sylvestre et al. (2007) used larger fishes (~30–48 cm), the relative Ucrit recorded in those studies showed the same pattern with temperature (1.7 vs. 1.9 BL s−1 at 10 vs. 15 °C in Schurmann & Steffensen (1997) and ~1.6 BL s−1 at both 7 and 11 °C in Sylvestre et al. (2007)). It should be noted, however, that the apparent thermal insensitivity of Ucrit over this temperature range (i.e. 7–15 °C) does not extend to lower temperatures, as both 5 °C-acclimated cod swimming at 5 °C (Schurmann & Steffensen, 1997) and 7 °C-acclimated cod swimming at 3 °C (Sylvestre et al., 2007) had significantly lower Ucrit values than reported at the above-mentioned warmer temperatures in those studies. Although Ucrit and maximum oxygen transport capacity (MMRS) in the present experiment did not differ significantly between the 12 °C-acclimated cod at 12 °C and those acutely exposed to 16 °C, the cod at 16 °C did show signs of struggling at the highest swimming speeds. This is evident from the greater variability in the data and the earlier reduction in the number of fish that were capable of swimming at speeds of 47.5 cm s−1 (2.28 BL s−1) and 52.5 cm s−1 (2.52 BL s−1) when compared to cod swimming at 12 °C (Fig. 3). That 16 °C is stressful for cod is also supported by studies which found increased plasma cortisol at this temperature (compared to 14 °C and lower) during both acute (Perez-Casanova et al., 2008a) and chronic (Perez-Casanova et al., 2008b) warming.
When observing the fish in the swim-tunnel, it appeared that the haddock was the superior swimmer of the two species, and this is reflected by the data. The haddock swimming at 12 °C had a higher Ucrit than cod swimming at either 12 or 16 °C (Table 2; Fig. 3), and the swimming speed vs. metabolic rate relationships were clearly distinct between the two species (Fig. 3), as was the RMR (and MMRS at P < 0.10). This conclusion is consistent with previous studies where cod were reported as being reluctant to swim inside a flume respirometer (Soofiani & Priede, 1985), whereas haddock swim strongly and uniformly in the same kind of swim tunnel (Tytler, 1969). The swimming speeds obtained for haddock in the present study also compare well to the maximum sustainable swimming speeds reported in the literature. Breen et al. (2004) reported that ~18 cm haddock at 9.9 °C could swim up to ~50.3 cm s−1 (or 2.8 BL s−1; mean of fish 25, 27, and 31 in their Table 1), although their results were obtained using a large annular tank in which haddock were stimulated to swim using a moving light pattern that was meant to mimic the mesh of an approaching fishing net. Tytler (1969) swam haddock in a Blažka swim flume respirometer, similar to the respirometer used in the present study, and found Ucrit to be 52.1 cm s−1 (2.1 BL s−1) for 24.8 cm haddock swimming at 10 °C. In addition, Tytler (1978) compared the swimming performance of haddock to that of cod at 10 °C and found that cod fatigued earlier, below 1.5 BL s−1 (compared to 2.1 BL s−1 for the haddock). These data all support the conclusion that haddock are better swimmers than Atlantic cod. The inherent differences in swimming performance between haddock and cod could, among other things, be related to differences in body morphology (haddock being closer to the optimal shape for reduced drag; i.e. closer to a fineness ratio of ~4.5) (Webb, 1974; Videler, 1993; Martinez et al., 2003), muscle biochemistry (Martinez et al., 2003; Kolok, 1992), and cardiac function (Gamperl & Farrell, 2004; Claireaux et al., 2005). Due to the pre-experiment training protocol employed, differences in swimming performance could also be related to differences in trainability between species (Davidson, 1997).
In conclusion, the data from the present study show that, for cod, an acute increase in temperature from 12 to 16 °C (i.e. beyond the species’ optimal temperature; Cheung, Watson & Pauly, 2013; Holt & Jørgensen, 2015), does not have a negative effect on maximum oxygen transport capacity, but signs of impaired swimming (struggling) become evident at 16 °C; albeit without a significant reduction in Ucrit. Since cod are reported to utilise habitats that are not only warmer than what is considered optimal (Neat & Righton, 2007; Righton et al., 2010), but also hypoxic (Neuenfeldt, Andersen & Hinrichsen, 2009), it is apparent that cod may be faced with physiological trade-offs on a daily basis. Compared to cod, haddock reach a significantly higher relative swimming speed (Ucrit) at a relatively lower MMRS and can be considered a more efficient swimmer; something that is also evident from their overall lower COTgross. For the size class of fish used in the present experiment, this could indicate that undersized haddock may be better than cod at escaping fishing gear, as a positive relationship between swimming speed and escapability has been demonstrated (He, 1993).