
Genome-wide analysis of the Catalpa bungei caffeic acid O-methyltransferase (COMT) gene family: identification and expression profiles in normal, tension, and opposite wood
- Published
- Accepted
- Received
- Academic Editor
- Axel Tiessen
- Subject Areas
- Agricultural Science, Forestry
- Keywords
- Tension wood, Catalpa bungei, Genome-wide, COMTs
- Copyright
- © 2019 Lu et al.
- Licence
- This is an open access article distributed under the terms of the Creative Commons Attribution License, which permits unrestricted use, distribution, reproduction and adaptation in any medium and for any purpose provided that it is properly attributed. For attribution, the original author(s), title, publication source (PeerJ) and either DOI or URL of the article must be cited.
- Cite this article
- 2019. Genome-wide analysis of the Catalpa bungei caffeic acid O-methyltransferase (COMT) gene family: identification and expression profiles in normal, tension, and opposite wood. PeerJ 7:e6520 https://doi.org/10.7717/peerj.6520
Abstract
Caffeic acid O-methyltransferase (COMT) is an important protein that participates in lignin synthesis and is associated with the ratio of G-/S-type lignin in plants. COMTs are associated with the wood properties of forest trees; however, little known about the COMT family in Catalpa bungei, a valuable timber tree species in China . We performed a comprehensive analysis of COMT genes in the C. bungei genome by describing the gene structure and phylogenetic relationships of each family member using bioinformatics-based methods. A total of 23 putative COMT genes were identified using the conserved domain sequences and amino acid sequences of COMTs from Arabidopsis thaliana and Populus trichocarpa as probes. Phylogenetic analysis showed that 23 CbuCOMTs can be divided into three groups based on their structural characteristics; five conserved domains were found in the COMT family. Promoter analysis indicated that the CbuCOMT promoters included various cis-acting elements related to growth and development. Real-time quantitative polymerase chain reaction (PCR) analysis showed differential expression among CbuCOMTs. CbuCOMT2, 7, 8, 9, 10, 12, 13, 14, 21, and 23 were mainly expressed in xylem. Only CbuCOMT23 was significantly downregulated in tension wood and upregulated in opposite wood compared to normal wood. Our study provides new information about the CbuCOMT gene family and will facilitate functional characterisation in further research.
Introduction
Caffeic acid O-methyltransferase (COMT, EC:2.1.1.68) is a lignin monomer-specific enzyme that catalyses O-methylation of the C5 hydroxyl moiety of suitably hydroxylated phenolic rings of monolignols, leading to preferential formation of syringyl subunits associated with syringyl (S) lignin monomer synthesis. Trees often have their specific S/G ratio (S-type to G-type lignin monomers) in xylem (Cai et al., 2016); this ratio may be related to the mechanical properties of wood due to the different molecular structures of the monomers (Ozparpucu et al., 2018). Higher G-unit content causes lignin to be more condensed due to larger proportions of biphenyl, phenylcoumaran, and other carbon–carbon linked units because the C5 position on their aromatic rings is available for radical coupling reactions. In contrast, S-units are usually linked by ether bonds at their available 4-hydroxy position and eventually yield linear, chemically labile lignin polymers (Ozparpucu et al., 2018). In lignin, a proper S/G ratio is beneficial for application in various wood materials as well as for plant resilience (Li et al., 2016; Wang et al., 2018a; Wang et al., 2018b). Some recent studies have focused on the effects of altering the S/G lignin ratio using genetic engineering modification methods or oversuppression of COMT gene expression in plants such as Arabidopsis (Vanholme et al., 2010), wheat (Wang et al., 2018a; Wang et al., 2018b), Miscanthus sinensis (Yoo et al., 2018) and switchgrass (DeBruyn et al., 2017; Li et al., 2017).
The COMT gene was first cloned in aspen in 1991 (Li et al., 2015a); since then, several studies have identified COMT family genes and their expressional profiles in plants for their great potential in molecular breeding, especially among important forest timber species (Xu et al., 2009; Myburg et al., 2014; Shi et al., 2010; Carocha et al., 2015). The results have suggested that the COMT gene family comprises multiple members. For example, there are seven COMT genes in Eucalyptus grandis (EgrCOMT1, EgrCOMT2, EgrCOMT3, EgrCOMT4, EgrCOMT5, EgrCOMT6, and EgrCOMT7; Carocha et al., 2015), 25 in Populus trichocarpa (PtrCOMT1–25; Shi et al., 2010), and 14 and 42 in Arabidopsis and Brassica napus, respectively (Li et al., 2016). Within these species, differential COMT gene expression is observed among different tissues. For example, in Eucalyptus grandis, EgrCOMT1 was dramatically expressed in xylem compared to the other six COMTs, but exhibited low expression in the fruit capsule, flower buds, and shoot tips, whereas EgrCOMT2, 3, 4, and 5 were highly expressed in flowers and fruits, but showed low expression in xylem and phloem (Carocha et al., 2015). Specific spatiotemporal expression patterns may be due to their different functions.
Catalpa bungei belongs to the Bignoniaceae family and is a valuable timber forest tree native to China. Wood products of C. bungei exhibit excellent mechanical properties that make it ideal for construction and the manufacture of upmarket wooden products (Jing et al., 2015; Shi et al., 2017; Zheng et al., 2017). COMT genes are associated with wood mechanical properties (Li, Wu & Southerton, 2011; Liu et al., 2015; Wang et al., 2018a; Wang et al., 2018b); therefore, an understanding of the COMT gene family members and their expression profiles in C. bungei would lay a foundation toward future improvement of wood properties; however, this work has not yet been conducted. In this study, we identified possible members of the COMT gene family in C. bungei and investigated their evolutionary divergence and conserved domains. Previous studies have demonstrated that tension wood (TW) and opposite wood (OW) developed under tension or compression stress generally possess physical properties that differ from those of normal wood (NW), possibly due to differences in the composition and structure of polymers that comprised of the cell wall (Chen, Chen & Zhang, 2015). Tension wood usually forms on the upper side of the bent stems and was induced by gravistimulation and has been used as a model system for the study of carbon partitioning between lignin and cellulose in trees (Zinkgraf et al., 2018). Compared to NW, TW usually has less lignin, mannose and xylose, but more glucose and cellulose (Guedes et al., 2017). To select CbuCOMT genes associated with wood properties, the expression of 23 CbuCOMT genes in tension, normal, and opposite wood was detected by quantitative reverse-transcription polymerase chain reaction (qRT-PCR) analysis. The results of this study will provide a foundation for future functional studies of CbuCOMT genes.
Materials and Methods
CbuCOMT gene identification
To identify COMT homologue genes in C. bungei, amino acid sequences of the COMT conserved domain SAM_MT_COMT (PS51588) motifs (Li et al., 2016) and 14 Arabidopsis COMTs genes (Tair, https://www.arabidopsis.org (Li et al., 2016)) and 25 Populus trichocarpa COMTs (http://genome.jgi-psf.org/Poptr1_1/; Shi et al., 2010) were used as queries to perform a BLASTP search against the protein sequences of C. bungei data that annotated according to the C. bungei genome data(the entire C. bungei genome has been sequenced by our research group; the related paper is in preparation) using a cut-off E value of 1 × 10⁻⁵. We then reorganised and merged the highly matched sequences and used the InterProScan (http://www.ebi.ac.uk/Tools/pfa/iprscan5/) and SMART (http://smart.embl-heidelberg.de/) web tools to scan the protein domain for further verification of the selected putative CbuCOMT genes. COMT members from the genomes of Zea mays PH207 (Phytozome, https://phytozome.jgi.doe.gov/pz/portal.html), Mimulus guttatus (Phytozome, https://phytozome.jgi.doe.gov/pz/portal.html), Solanum lycopersicum (Phytozome, https://phytozome.jgi.doe.gov/pz/portal.html), Solanum tuberosum (Phytozome, https://phytozome.jgi.doe.gov/pz/portal.html), Utricularia gibba (CoGe, https://genomevolution.org/CoGe/), Sesamum indicum (Sinbase, http://ocri-genomics.org/Sinbase/), Salvia miltiorrhiza (National Data Center of Traditional Chinese Medicine of China, http://www.ndctcm.org/shujukujieshao/2015-04-23/27.html), Capsicum baccatum (Pepper Genome, http://peppergenome.snu.ac.kr/), and Petunia axillaris (Sol Genomics Network, https://solgenomics.net/organism/Petunia_axillaris/genome) were identified using the same methods.
Pairwise identity and similarity scores of the identified CbuCOMTs were calculated using the MatGAT v2.0 software. The theoretical isoelectric point (pI) and molecular weight (MW) of the COMT family genes in C. bungei were determined using the Expert Protein Analysis System (ExPASy, http://cn.expasy.org/).
Plant materials
Leaves, current-growth stem (hereafter, stem), bark, developing xylem (hereafter, xylem), phloem, and flowers were sampled from three 8-year-old C. bungei clone “9-1” individuals on April 20, 2018, in a trial field located in Luoyang, China (112.55°N, 34.71°E). All plant samples were immediately frozen in liquid nitrogen and stored at −80 °C for later analysis.
We selected 1-year-old field-grown C. bungei clone “9-1” trees (height: 3–3.5 m, diameter at breast height (DBH): 2–2.5 cm) for the induction of TW and OW by bending and fixing the stems using nylon ropes to maintain the breast height (ca. 1.5 m) point of the stem at an angle of ca. 45°. Bending treatment was applied from April 19 to July 20 (the sample collection date) in 2017, during active cambial growth. Stem pieces were isolated at the bending point using lopping shears. TW (upper side) and OW (lower side) were collected from the same stem section using a sharp chisel after removing the bark, phloem, and cambium following the method of Li, Yang & Wu (2013). The breast height points of upstanding trees were selected to represent NW and sampled simultaneously. All samples were collected in the morning, cut to ca. 2 × 1 ×4 mm, and then immediately stored in liquid nitrogen.
Sequence alignment, phylogenetic analyses and gene structure determination
Multiple sequence alignment was conducted using the DNAMAN software v. 6.0 (Lynnon Biosoft, Quebec, QC, Canada). Phylogenetic trees were constructed using the MEGA7.0 software. The phylogenetic trees were constructed using maximum likelihood (ML) method with the following parameters: and a bootstrap test with 1,000 replications, Poisson model, uniform rates, partial deletion of gaps and nearest neighbor interchange (Kumar, Stecher & Tamura, 2016). Full-length amino acid sequences of these genes were aligned using the ClustalW program under the default settings. We aligned the coding sequences to their corresponding genomic sequences to obtain the exon–intron structures of the COMT genes. A graph of the exon–intron structures was prepared using the online Gene Structure Display Server (GSDS, http://gsds.cbi.pku.edu.ch; Hu et al., 2015). The MEME web tool (http://meme-suite.org/) was used to search for motifs among all CbuCOMT genes. The number of motifs was set to eight (Kasirajan & Aruchamy, 2015).
Analysis of regulatory elements in the promoter regions of CbuCOMT genes
The elements in the promoter fragments of the CbuCOMT genes (1,500 bp upstream of the translation initiation sites) were identified using the online program PlantCARE (http://bioinformatics.psb.ugent.be/webtools/plantcare/html/).
RNA isolation and qRT-PCR
Total RNA was extracted using the RNeasy Plant Mini Kit (Tiangen) according to the manufacturer’s instructions. First-strand cDNA synthesis was performed using ca. 2 µg RNA using the PrimeScript II 1st Strand cDNA Synthesis Kit (TaKaRa, Kyoto, Japan) according to the manufacturer’s protocol. Gene-specific primers (Table S1) with melting temperatures of 58–62 °C and amplification lengths of 150–260 bp were designed using the Primer 5.0 software (Applied Biosystems, Life Technologies, New York, NY, USA). qRT-PCR was performed as follows: initial denaturation at 95 °C for 30 s, followed by 40 cycles of 5 s at 95 °C and 30 s at 60 °C, then one cycle of 5 s at 95 °C, 60 s at 60 °C, and a final stage at 95 °C (acquisition mode: continuous; five acquisitions per °C). RT-qPCR was performed using a Roche LightCycler 480 System (Roche, Basel, Switzerland) using the SYBR Premix Ex Taq Kit (TaKaRa) and an internal control (actin) primer pairs (Table S1) were selected (Jing et al., 2015). All reactions were conducted with four technical replicates and three biological replicates. Results obtained for different tissues were standardised to the levels of actin using the 2−ΔΔCT method. The data were statistically analysed by one-way ANOVA using SPSS 19.0 (SPSS Inc., Chicago, IL, USA). For the gene expression differences between OW, NW and TW, we employed a fold change not less than 2 as significant differential expressed genes.
Results
Genome-wide identification of the COMT gene family in C. bungei
To identify COMT genes in C. bungei, we performed a BLASTP search against the C. bungei protein database using COMT conserved domain sequences and amino acid sequences from Arabidopsis and Populus trichocarpa. After removing sequences lacking the functional domain using InterProScan and SMART, a total of 23 genes encoding putative COMT proteins were identified and named as CbuCOMT1 to CbuCOMT23 (Table 1).
| Gene name | Gene length (bp) | CDS length (bp) | Amino acids length (aa) | Theoretical Mw (kDa) | Theoretical PI |
|---|---|---|---|---|---|
| CbuCOMT1 | 2,117 | 1,083 | 360 | 40.66 | 5.54 |
| CbuCOMT2 | 1,523 | 672 | 223 | 25.34 | 6.37 |
| CbuCOMT3 | 3,700 | 1,107 | 368 | 40.26 | 5.47 |
| CbuCOMT4 | 2,196 | 1,029 | 342 | 37.90 | 5.31 |
| CbuCOMT5 | 3,797 | 1,482 | 493 | 54.14 | 6.28 |
| CbuCOMT6 | 2,004 | 963 | 320 | 35.38 | 5.40 |
| CbuCOMT7 | 1,132 | 579 | 192 | 21.57 | 7.12 |
| CbuCOMT8 | 2,389 | 771 | 256 | 28.08 | 5.45 |
| CbuCOMT9 | 5,736 | 918 | 305 | 33.79 | 6.00 |
| CbuCOMT10 | 3,589 | 1,065 | 354 | 39.20 | 5.70 |
| CbuCOMT11 | 3,977 | 1,062 | 353 | 39.00 | 5.47 |
| CbuCOMT12 | 2,009 | 1,038 | 345 | 38.06 | 5.23 |
| CbuCOMT13 | 1,915 | 1,038 | 345 | 37.70 | 5.27 |
| CbuCOMT14 | 4,316 | 750 | 249 | 27.24 | 5.18 |
| CbuCOMT15 | 1,410 | 1,059 | 352 | 38.62 | 6.27 |
| CbuCOMT16 | 1,649 | 1,071 | 356 | 38.95 | 6.06 |
| CbuCOMT17 | 1,918 | 1,038 | 345 | 38.17 | 5.27 |
| CbuCOMT18 | 2,584 | 1,149 | 382 | 42.35 | 5.83 |
| CbuCOMT19 | 1,790 | 897 | 298 | 33.28 | 6.20 |
| CbuCOMT20 | 1,858 | 1,053 | 350 | 38.57 | 5.32 |
| CbuCOMT21 | 2,957 | 969 | 322 | 35.53 | 5.50 |
| CbuCOMT22 | 5,870 | 1,095 | 364 | 39.87 | 6.21 |
| CbuCOMT23 | 1,587 | 978 | 325 | 35.71 | 5.23 |
Sequence features and sequence similarities among CbuCOMTs
Sequence feature analysis of COMT genes suggested that CbuCOMT gene lengths varied from 1,132 bp (CbuCOMT7) to 5,870 bp (CbuCOMT22) and the lengths of open reading frames (ORFs) ranged from 579 bp (CbuCOMT7) to 1,482 bp (CbuCOMT22), with deduced amino acid sequence lengths varying from 193aa to 493aa (Table 1). Phylogenetic analysis of the 23 CbuCOMTs indicated that the CbuCOMT genes could be classified into three groups: group I was composed of 12 CbuCOMT proteins; CbuCOMT1, CbuCOMT2, and CbuCOMT19 belonged to an independent branch, group II; the remaining CbuCOMT genes comprised group III (Fig. 1). A matrix of amino acid sequence similarity for the CbuCOMT gene family is presented in File S1. A high percentage of amino acid identity and similarity was observed between CbuCOMT5 and CbuCOMT21 (91.3 and 94.9%, respectively), CbuCOMT14 and CbuCOMT22 (88.4 and 92.8%, respectively), CbuCOMT4 and CbuCOMT15 (94.1 and 97.2%, respectively), and between CbuCOMT18 and CbuCOMT19 (83.6 and 92.1%, respectively). However, most CbuCOMT pairs showed low amino acid sequence identity and similarity (<80%).
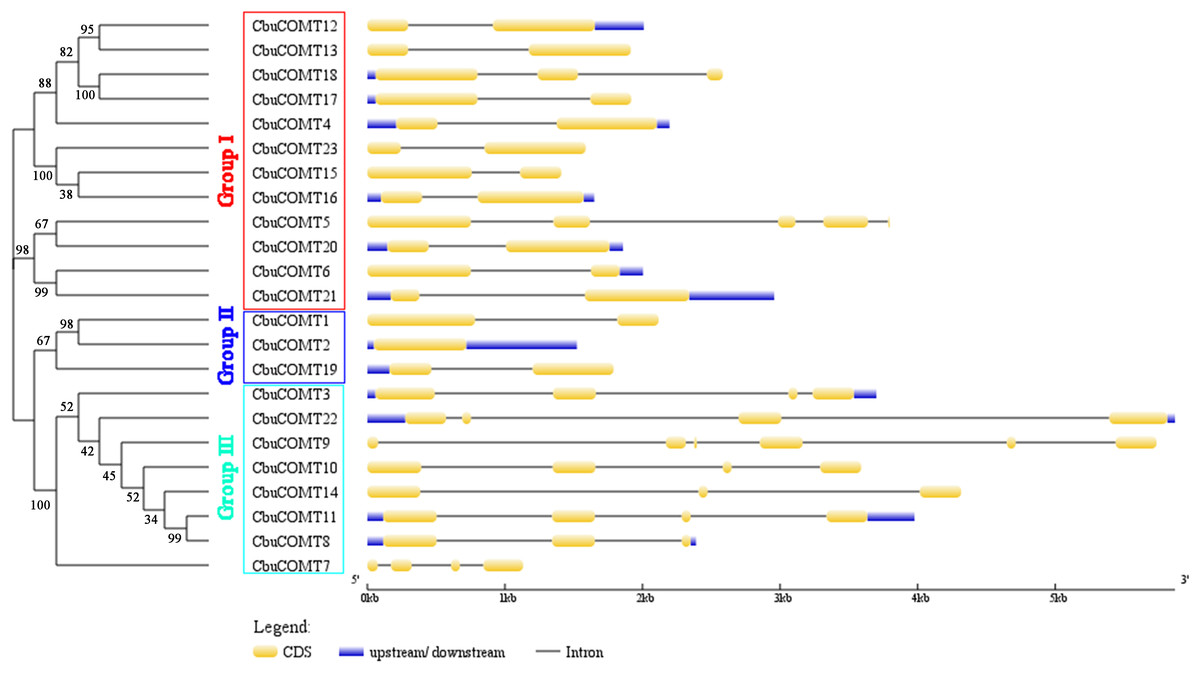
Figure 1: Phylogenetic analysis of CbuCOMT proteins and exon-intron structure of the corresponding genes.
Exons and introns are respectively indicated by yellow boxes and black lines connecting two exons and the numbers on the branches were Bootstrap values.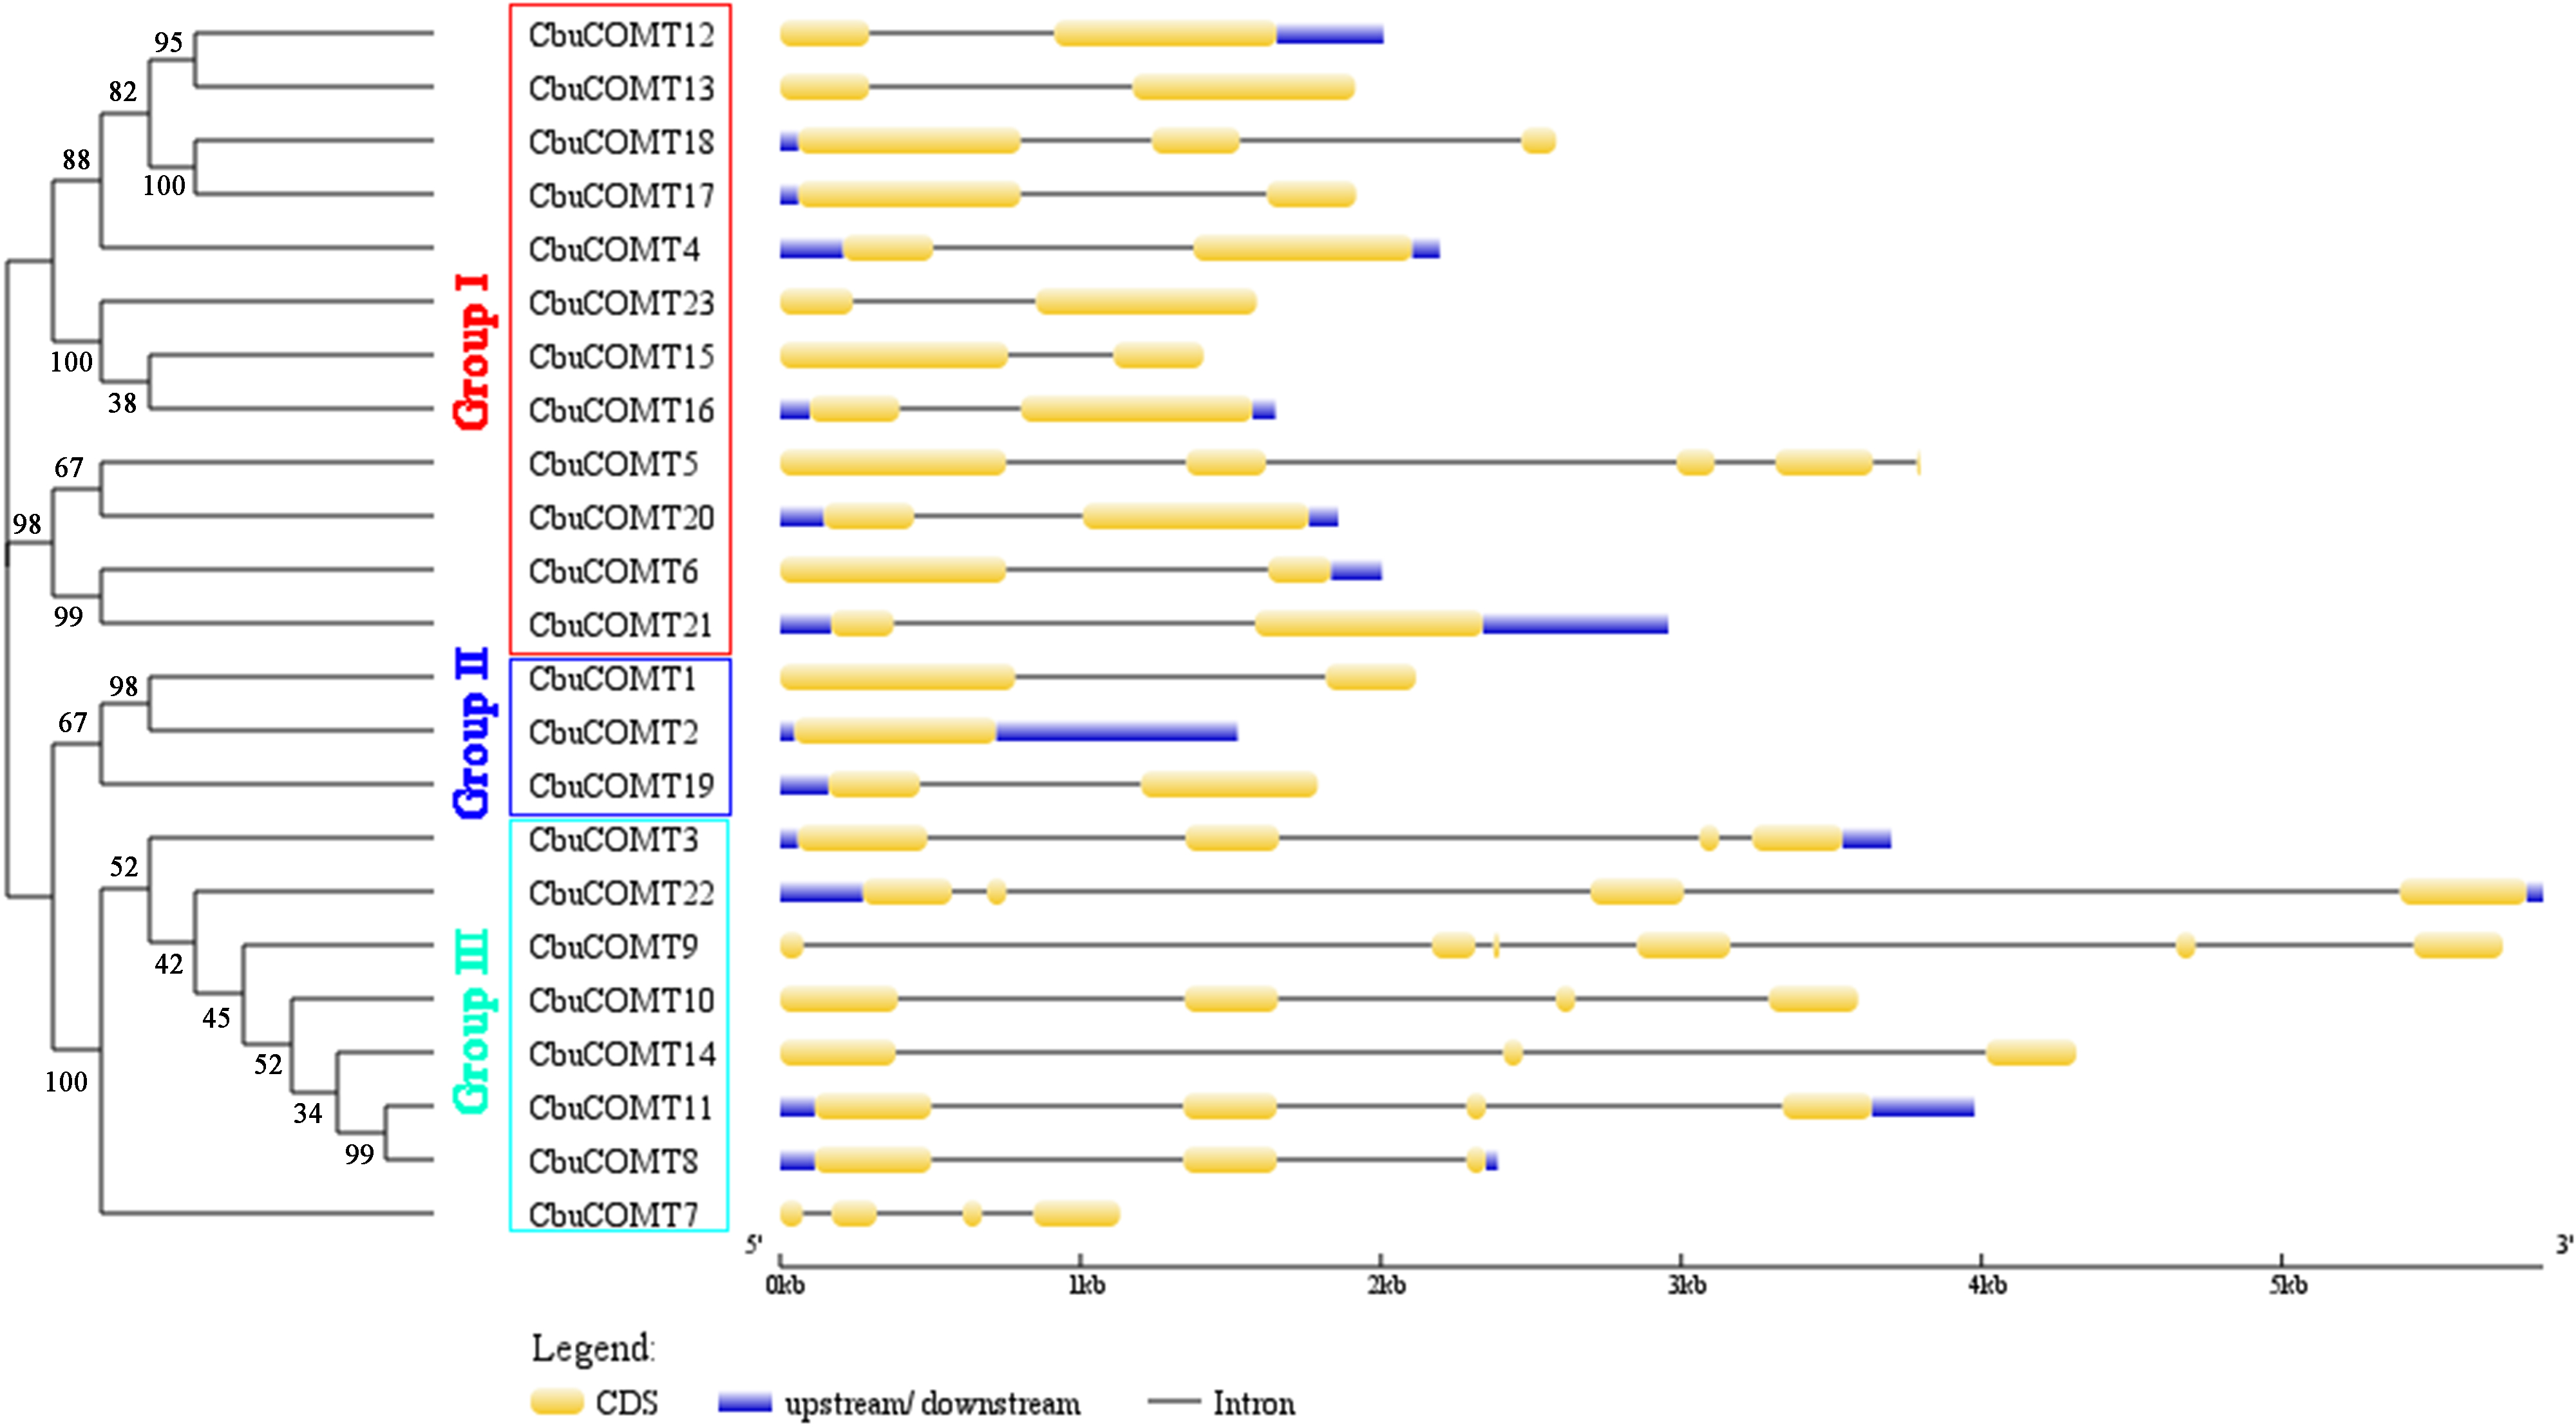
Phylogenetic analysis of CbuCOMTs
To investigate the evolutionary relationships among COMT proteins, we first generated a phylogenetic tree using full-length protein sequences of the 23 CbuCOMTs, 25 P. trichocarpa COMTs (PtCOMT s), 8 Z. mays COMTs (ZmCOMTs) and 14 A. thaliana COMTs (AtCOMT s). As shown in Fig. 2, the COMTs of these three species were distinctly classified into five groups (I, II, III, IV, and V). The CbuCOMTs were mainly distributed in groups I and III, whereas only three CbuCOMTs belonged to group II (CbuCOMT1, CbuCOMT2, and CbuCOMT19), in accordance with the previous phylogenetic tree (Fig. 1). The CbuCOMTs in group III were orthologs of At5G54160.1, whereas CbuCOMTs in group I were possible orthologs of PtrCOMT15.
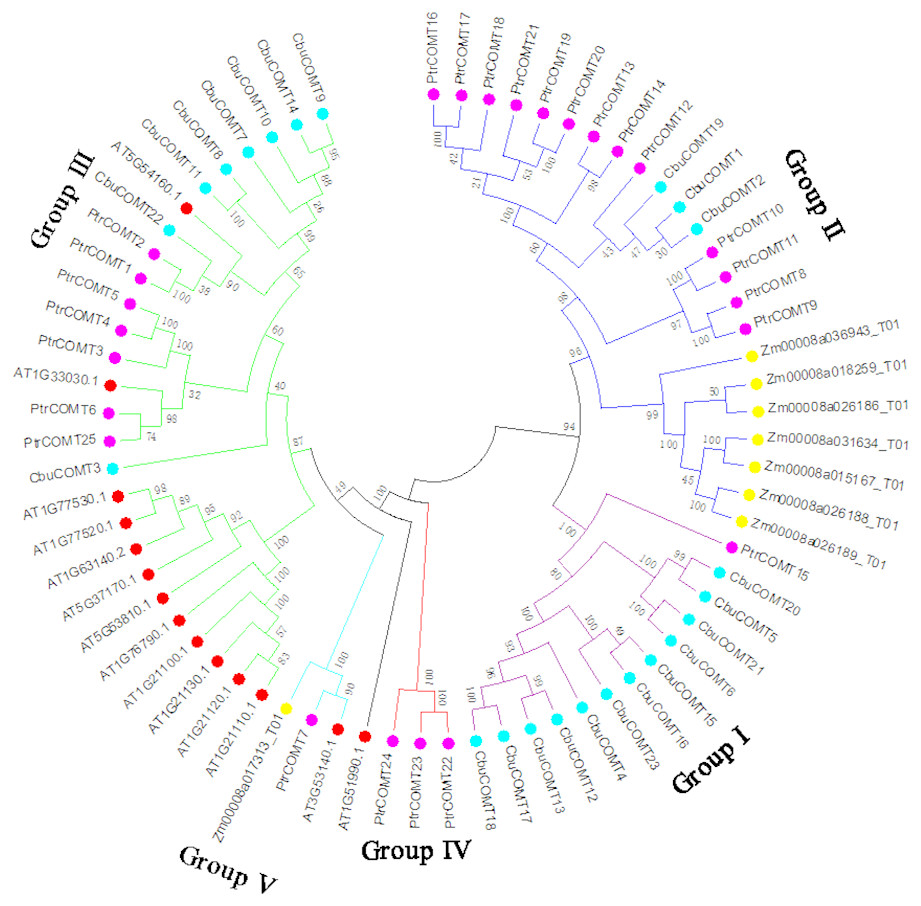
Figure 2: Phylogenetic analysis of CbuCOMT and COMT genes from Arabidopsis thaliana, Populus trichocarpa and Zea mays by MEGA 7.0.
The 5 groups were distinguished in different colors and the numbers on the branches were Bootstrap values.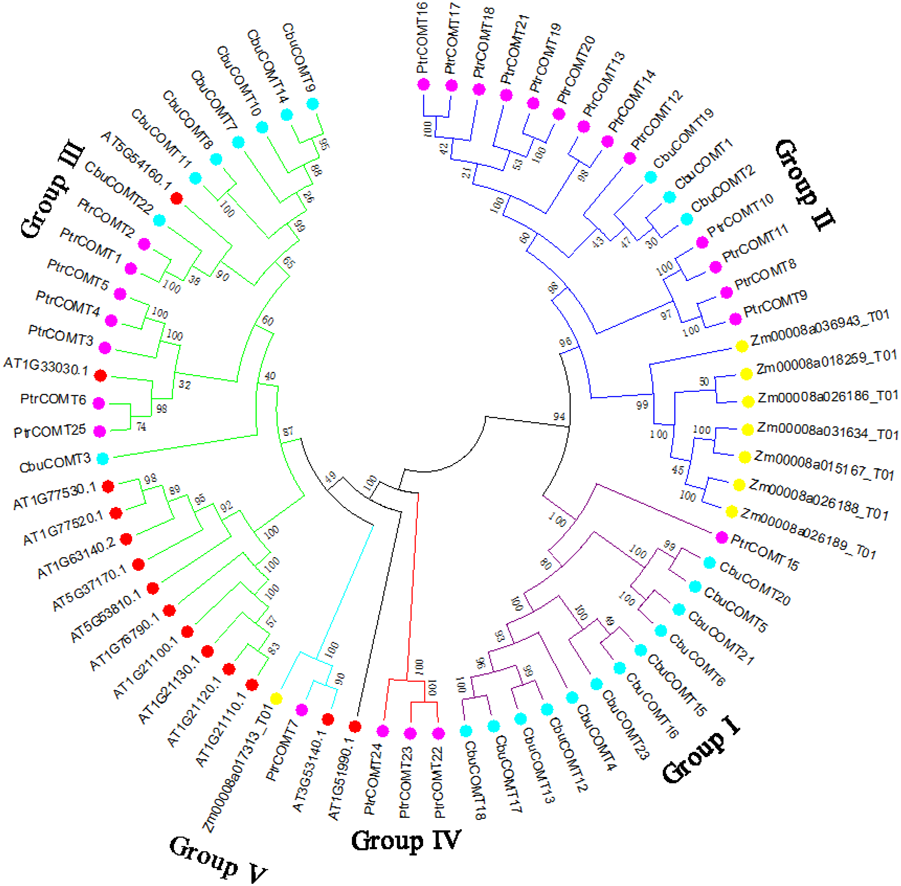
We then constructed another phylogenetic tree using 164 possible COMT proteins from C. bungei and eight other Tubiflorae plants (Table S2) including C. bungei (23), Mimulus guttatus (11), Solanum lycopersicum (17), Solanum tuberosum (34), Utricularia gibba (10), Sesamum indicum (32), Salvia miltiorrhiza (10), Capsicum baccatum (19) and Petunia axillaris (8). The results indicated a grouping into five sub-families (Fig. 3) and provided information about the evolution of the CbuCOMT gene family. CbuCOMT s belonged to groups I, II, and III. The clustering results for CbuCOMT proteins in Tubiflorae plants were the same as those for AtCOMT and PtCOMT proteins, with CbuCOMT4, 5, 6, 12, 13, 15, 16, 17, 18, 20, 21 and 23clustered in group I, CbuCOMT1, 2, and 19 clustered in group II, and CbuCOMT3, 7, 8, 9, 10, 11, 14 and 22 clustered in group III. The phylogenetic tree showed that CbuCOMT s were distributed most closely to COMTs from Sesamum indicum and Salvia miltiorrhiza, suggesting that C. bungei, Sesamum indicum, and Salvia miltiorrhiza have a close genetic relationship.
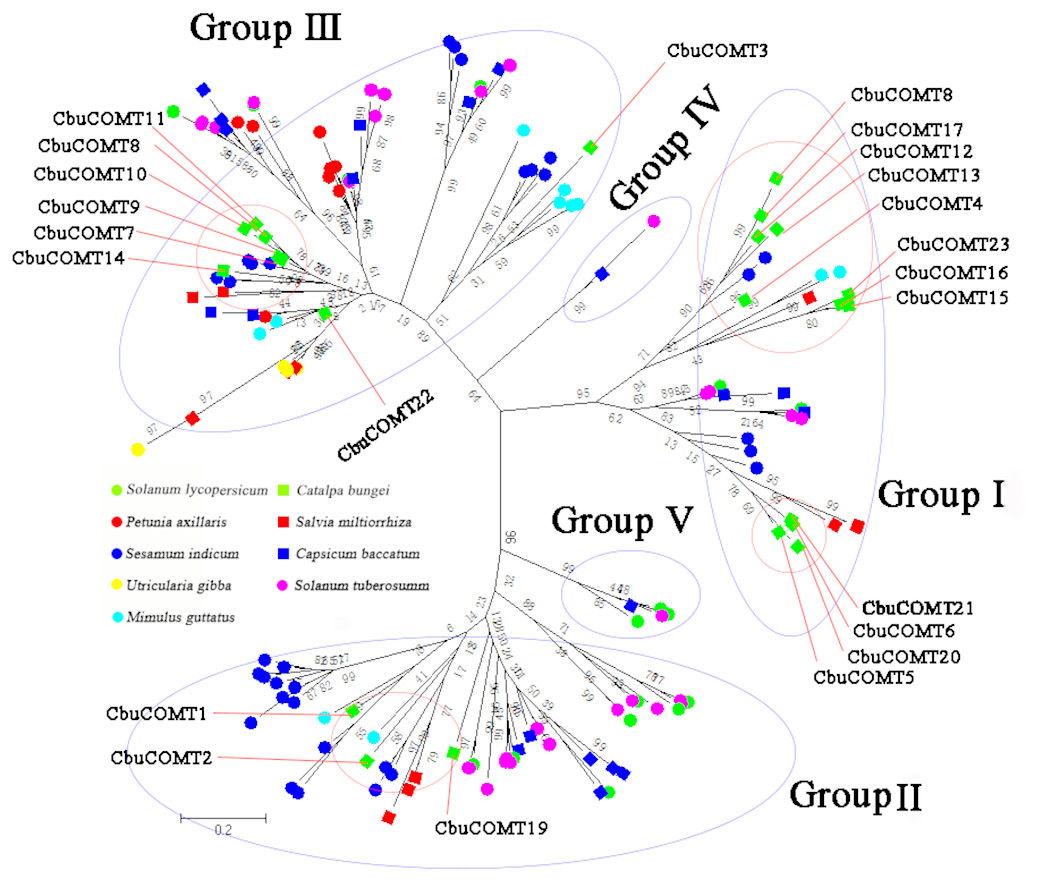
Figure 3: Phylogenetic analysis of CbuCOMTs and other COMT gene family members.
The numbers in the brackets indicated the number of genes we used to construct the evolutionary tree and the numbers on the branches were Bootstrap values.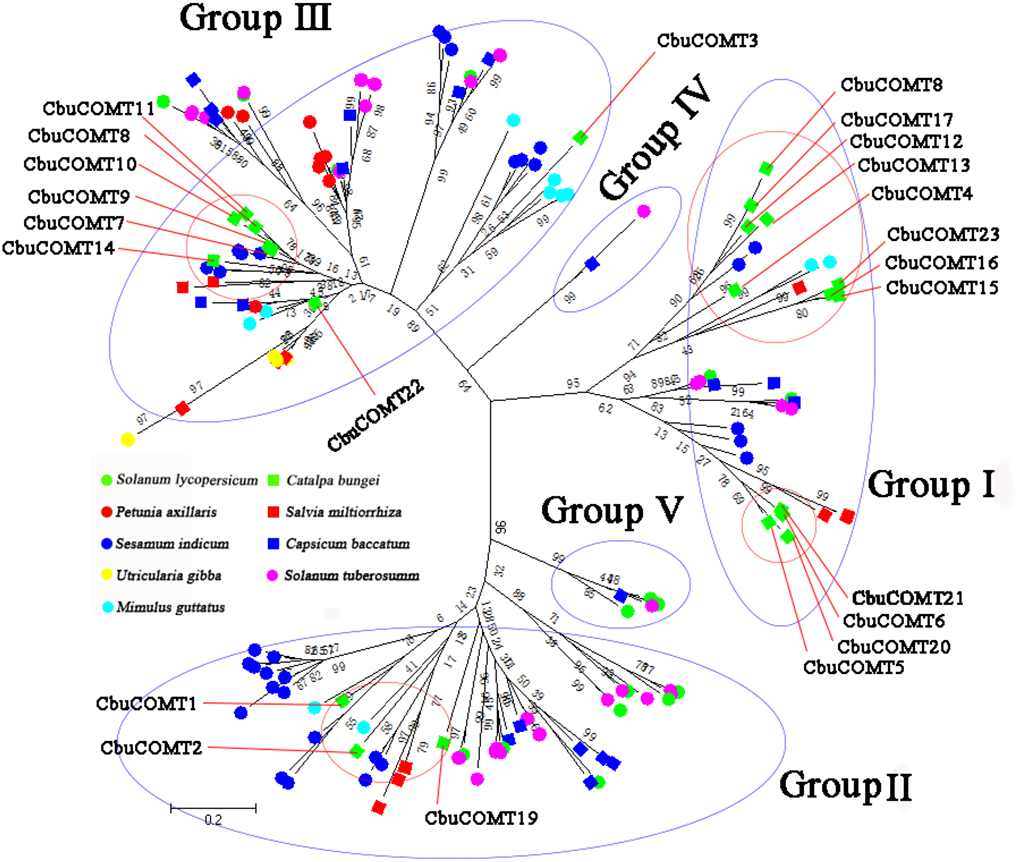
Sequence alignment and structural analysis of CbuCOMT genes
The deduced amino acid sequences of 11 CbuCOMTs (CbuCOMT1, 3, 4, 6, 10, 11, 15, 18, 19, 20 and 22) were randomly selected (make sure at least one CbuCOMT protein form the three groups were included), together with12 other COMTs from A. thaliana (AT1G211001.1), Salvia miltiorrhiza (EVM.MODEL.SCAFFOLD6088.4), Utricularia gibba (SCF00334.G14222.T1), Pinus taeda (PITA_000018291), Sesamum indicum (SIN_1009243), Solanum tuberosum (PGSC0003DMT400001512), Populus trichocarpa (ACC63884.1), Picea abies (MA_76956G0010), Eucalyptus grandis (EUCGR.E03875.1), Mimulus guttatus (MIGUT.F00144.1), and Solanum melongena (SME2.5_02030.1_G00001.1) were aligned to determine COMT structures (Fig. 3). Through a comparison of COMT amino acid sequences from different plant species, Ibrahim, Bruneau & Bantignies (1998) found that COMT proteins had five conserved sequences: I (LVDVGGGxG), II (GINFDLPHV), III (EHVGGDMF), IV (NGKVI), and V (GGKERT) (Ibrahim, Bruneau & Bantignies, 1998). Very similar results were obtained in our study; however, some amino acid variations were observed in the conserved domain; for example, conserved sequence I in CbuCOMT3 was IVNVGGGxG. Conserved sequences IV and V also exhibited amino acid variation (Fig. 4).
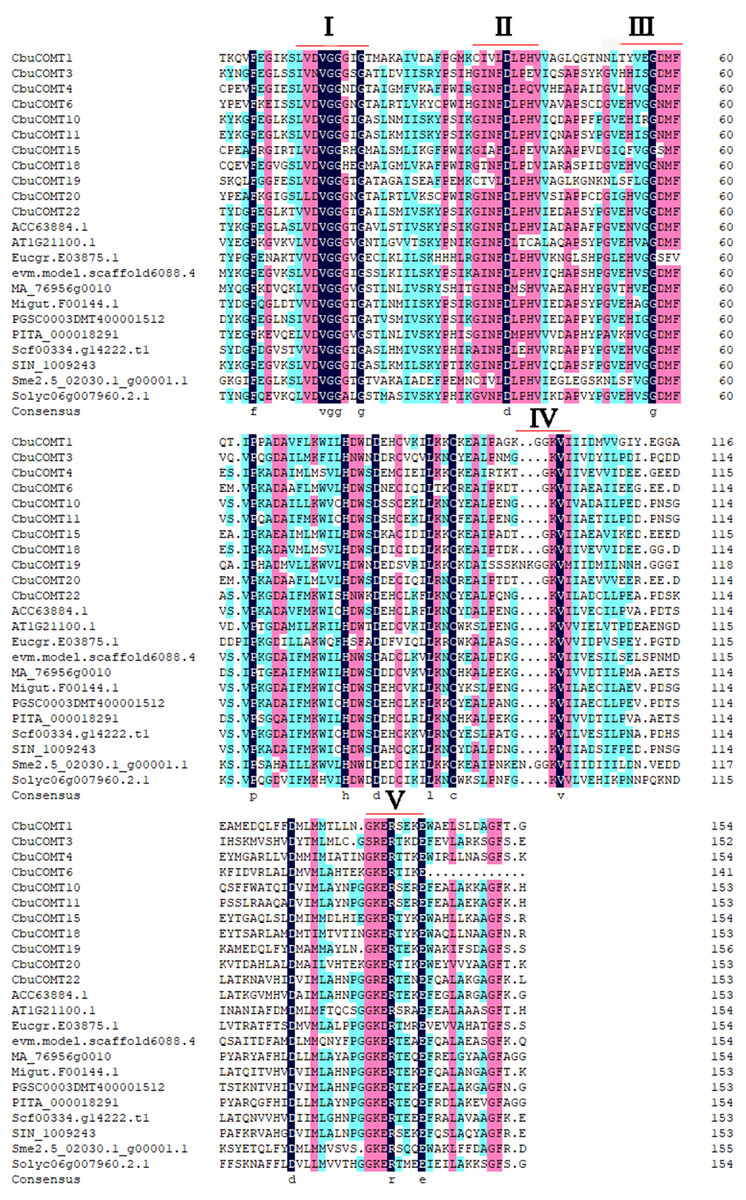
Figure 4: Multiple sequence alignment of the conserved domains of the COMT proteins.
Five conserved sequences: I: LVDVGGGxG, II: GINFDLPHV, III: EHVGGDMF, IV: NGKVI and V: GGKERT were marked by black lines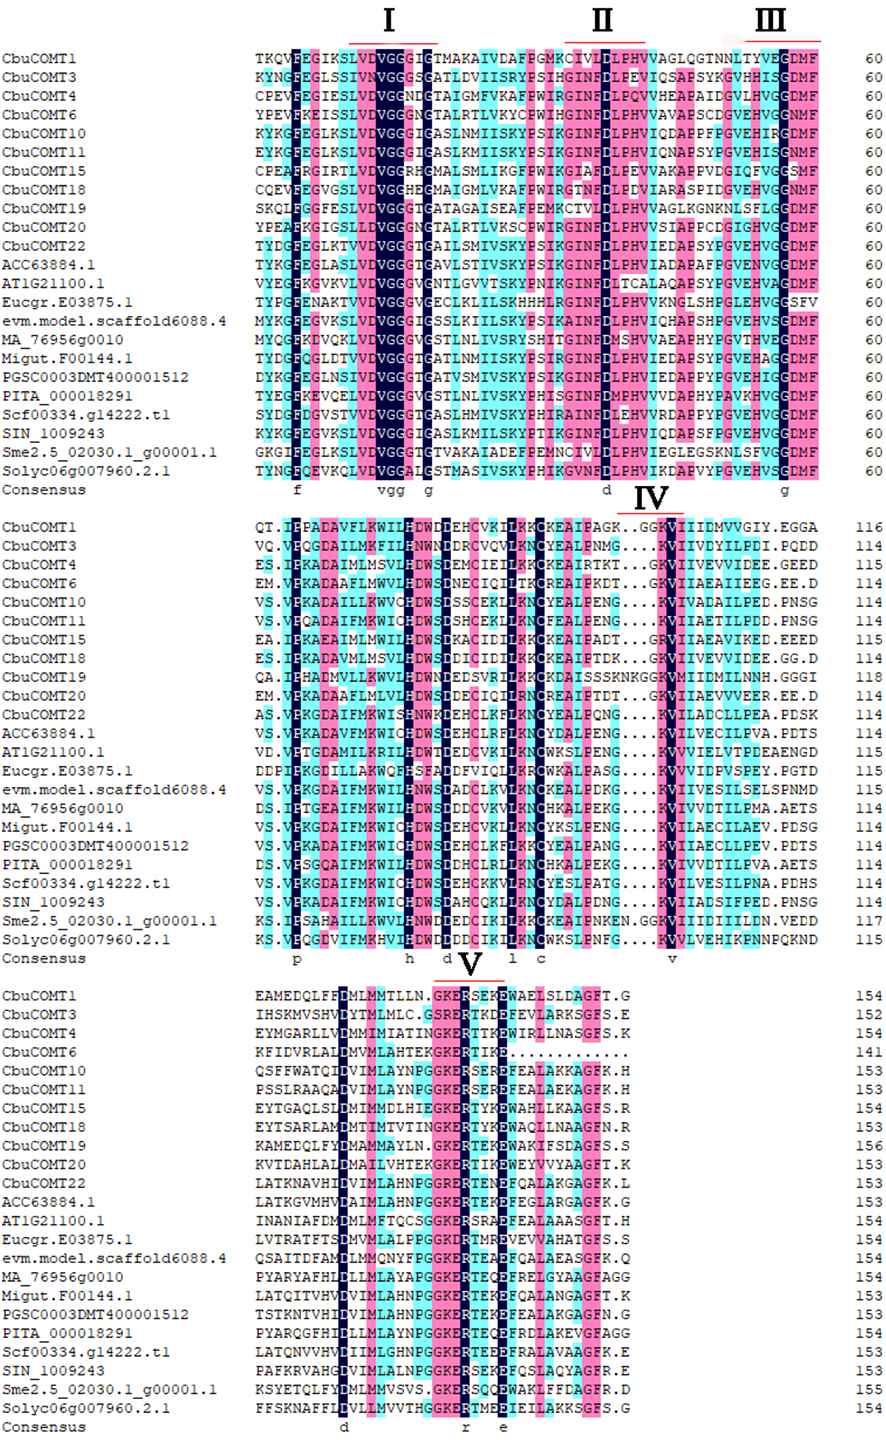
To gain further insight into the structural diversity of CbuCOMT genes, full-length cDNA sequences were compared with the corresponding genomic DNA sequences to determine the numbers and positions of exons and introns within the genomic DNA (Fig. 1). The number of introns fluctuated markedly from zero to five. CbuCOMT2 contained no introns, whereas CbuCOMT9 had five, indicating that gene structure may not be conserved among CbuCOMT family members (Fig. 1).
Motifs and cis-regulatory elements in the promoter regions of CbuCOMT
After performing a search using the MEME motif search tool, eight consensus motifs were detected among the CbuCOMTs (Fig. 5). Most CbuCOMTs possessed motifs 1, 2, and 3. Notably, all five conserved domains were totally or partly contained within the five motifs; for example, conserved domain I (LVDVGGGxG), which is an S-adenocyl-L-methionine (SAM) binding domain, was included in motif 2 and found in many COMT genes. In addition, three COMT-specific catalytic residues were found in motifs 1 (histidine, H), 4 (glutamic acid, E), and 8 (glutamic acid, E) (Li et al., 2015b).
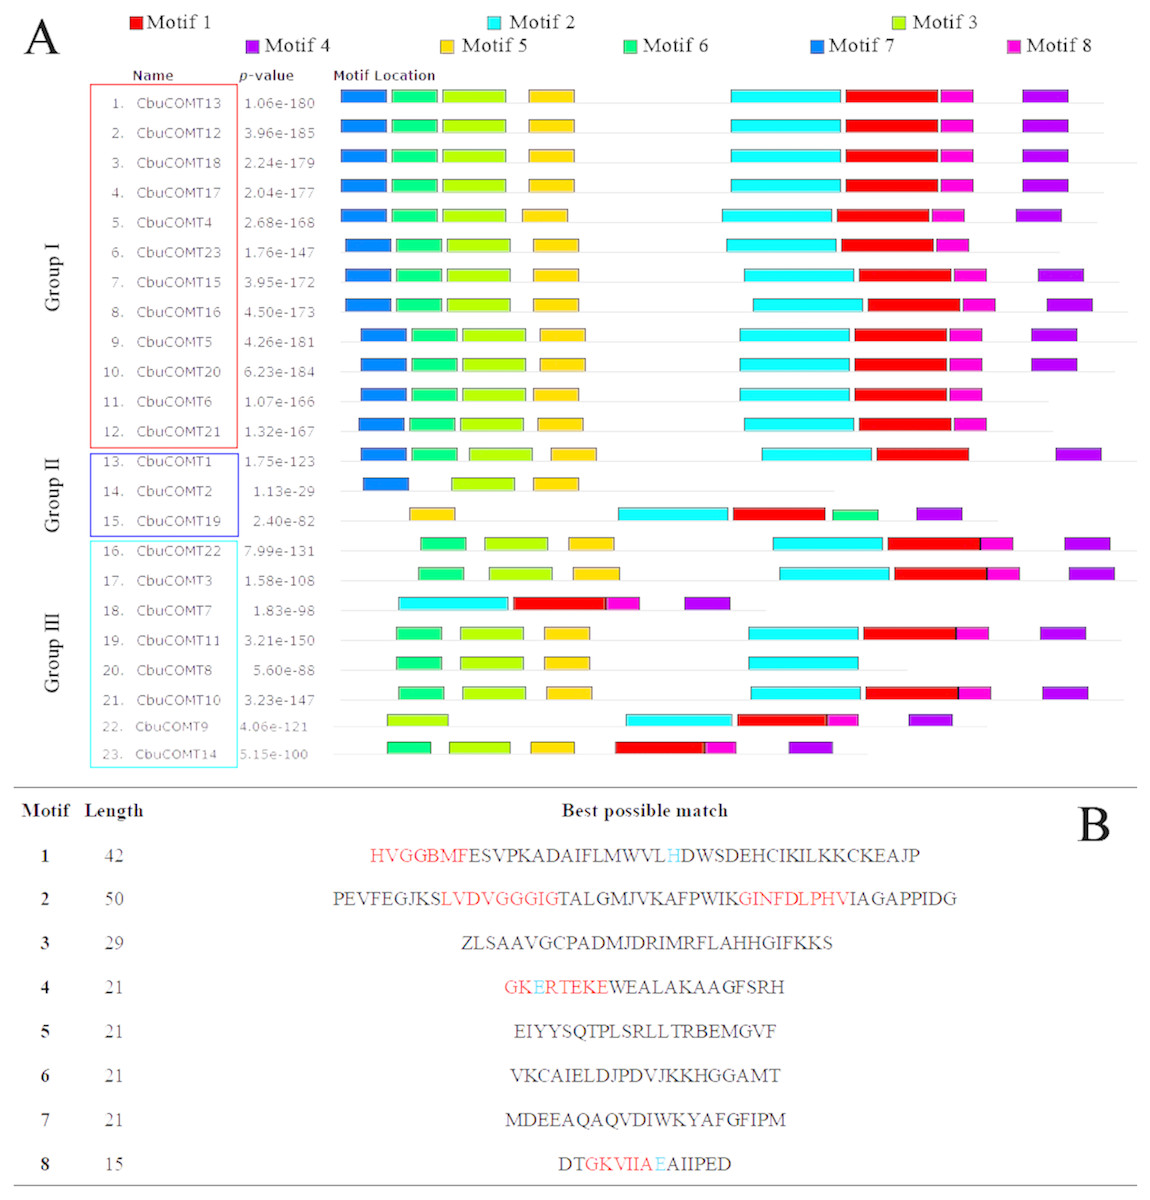
Figure 5: Distribution of motifs in the COMT proteins.
(A) The motifs were identified by MEME. Different motifs are indicated by different colored numbers 1–8. (B) The detail motif sequences. Five conserved domain sequences were marked by red color, and catalytic residues were marked by arrows.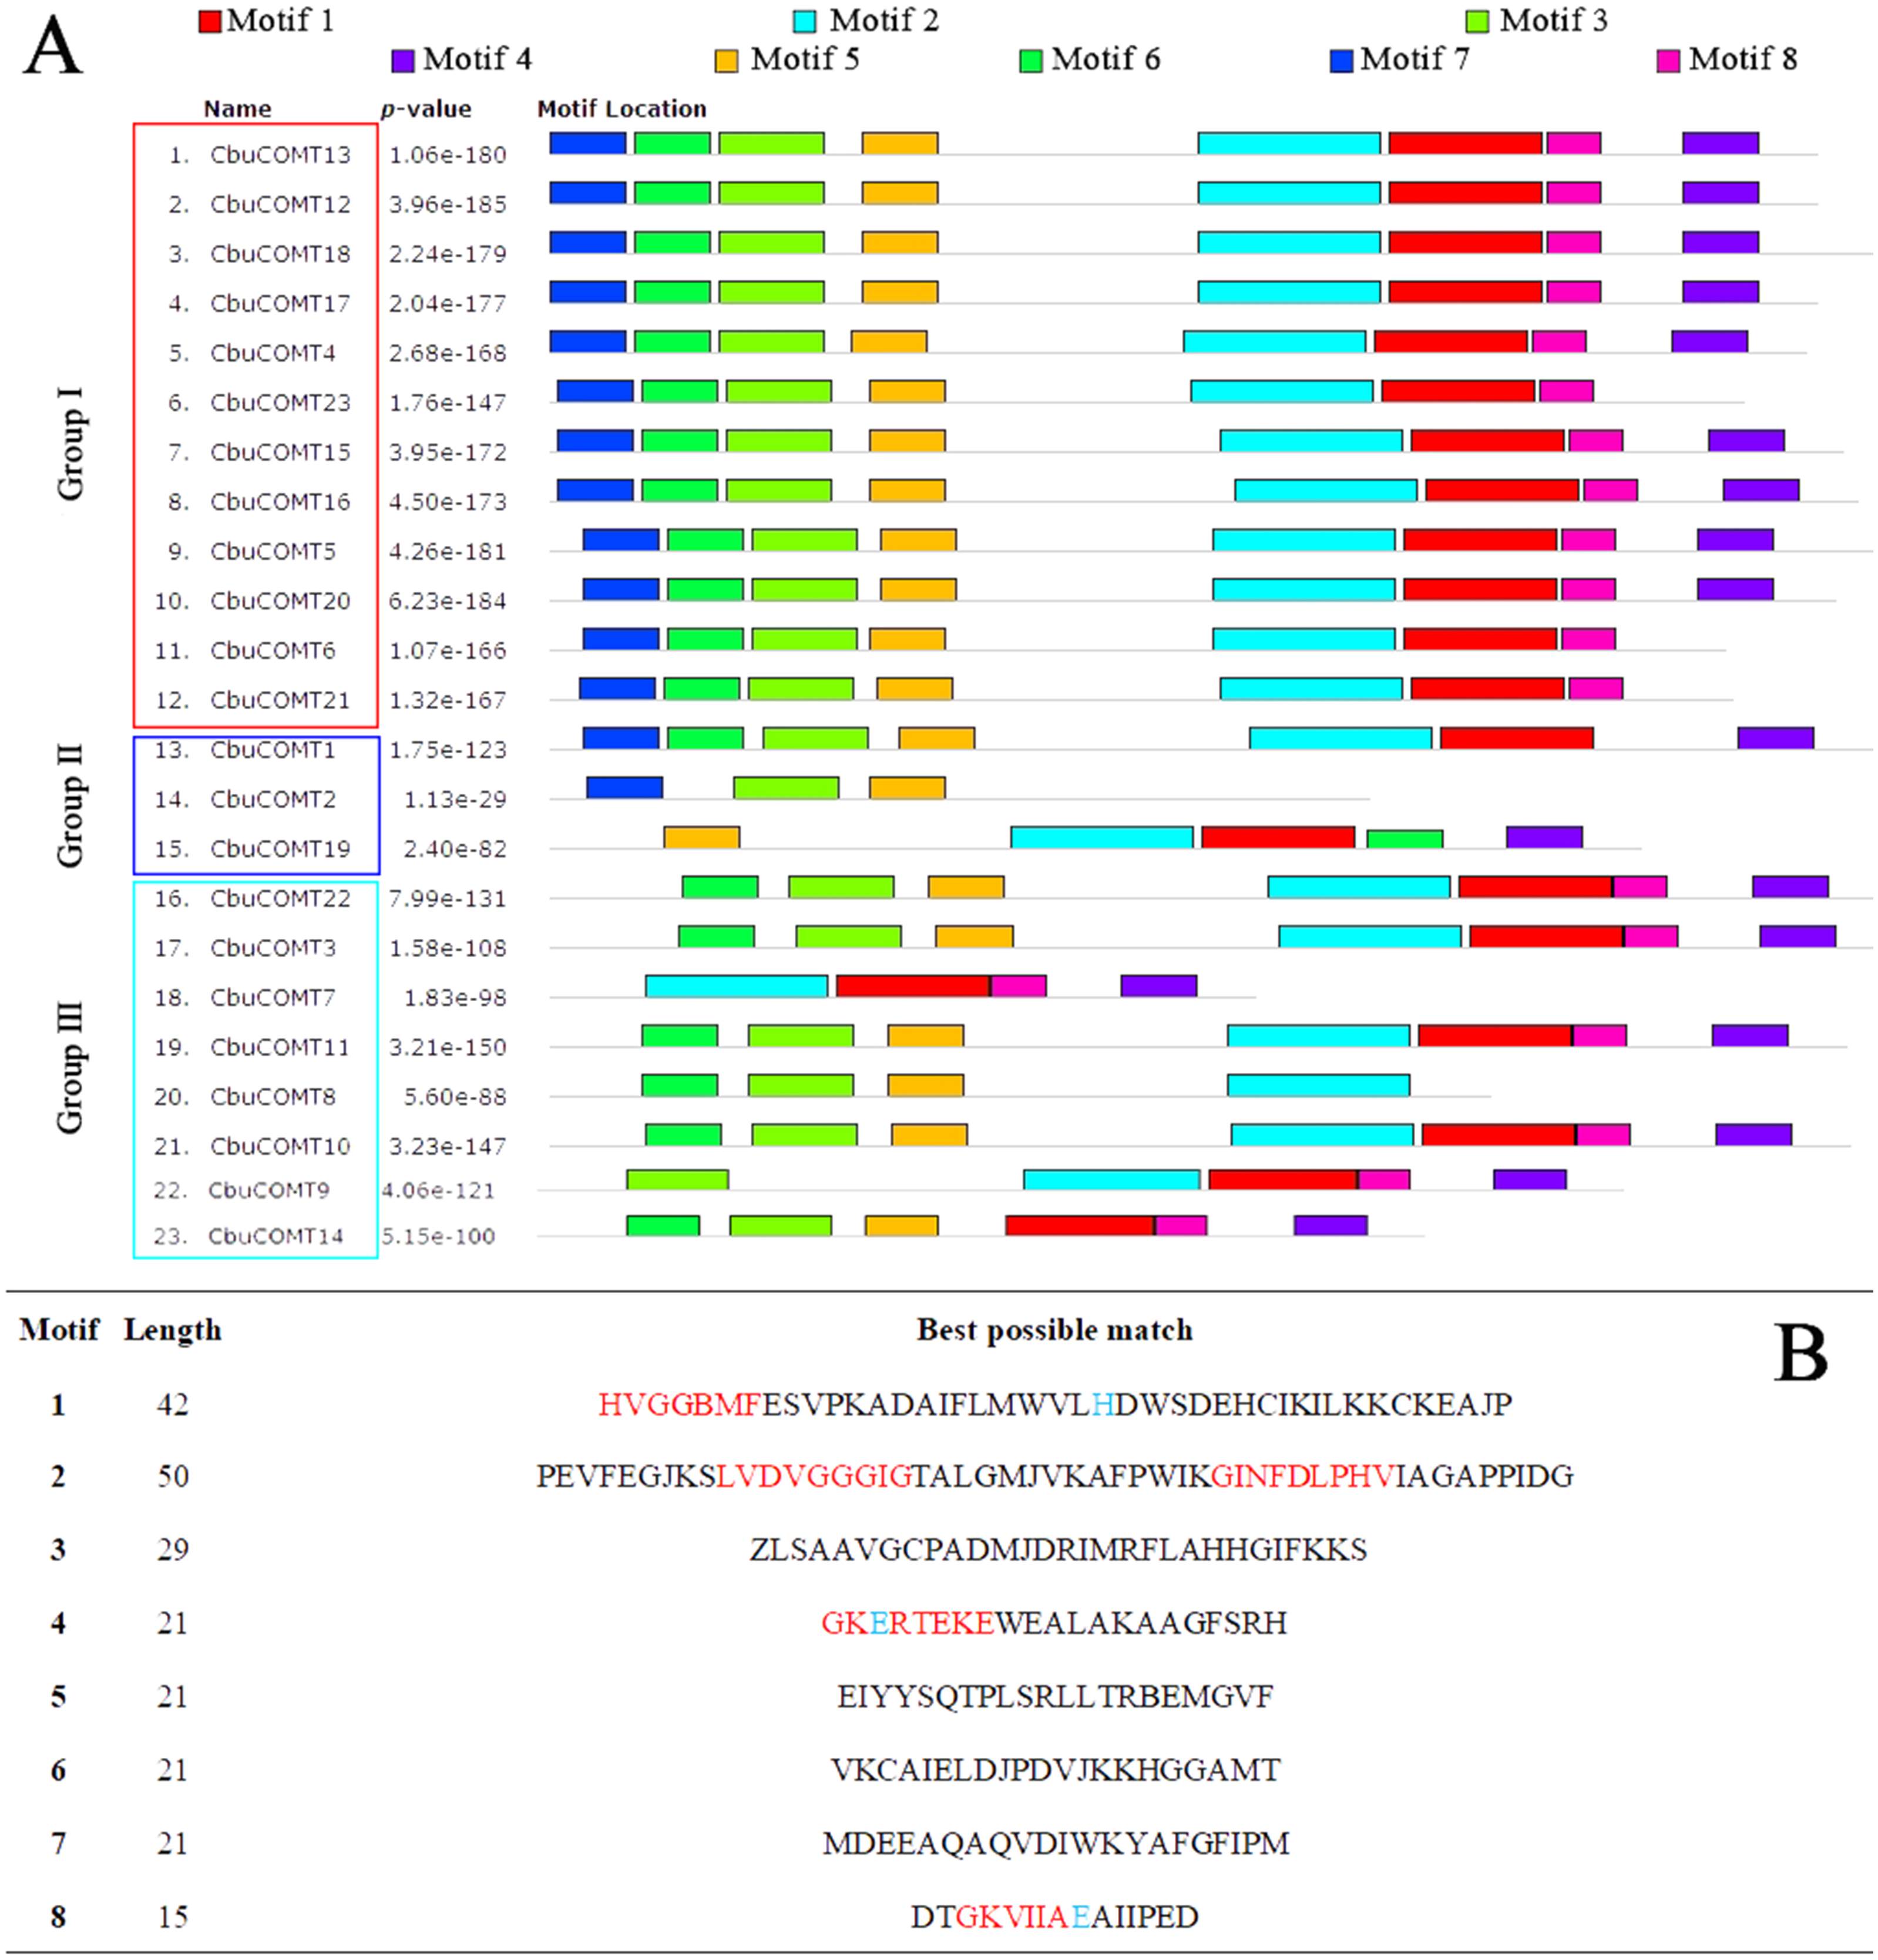
| Gene ID | Motifs related to growth and development | Motifs related to light response | Motifs related to stress response | Motifs related to hormone response |
|---|---|---|---|---|
| CbuCOMT1 | GCN4_motif, Skn-1_motif, circadian | Box 4, Box I, G-Box, GT1-motif, Sp1, Box 2, as-2-box, TCT-motif | ARE, BOX-W1, MBS, TC-rich repeats | ABRE, TCA-element |
| CbuCOMT2 | O2-site | AT1-motif, ATCT-motif, Box 4, Box 1, CATT-motif, G-Box, GA-motif, GT1-motif, MRE, TCT-motif | ARE, TC-rich repeats | ABRE |
| CbuCOMT3 | Skn-1_motif | BOX 4, BOX 1, G-BOX, CATT-motif, GATA-motif, GT1-motif | ARE, TC-rich repeats | ABRE, TATC-box, TGA-box |
| CbuCOMT4 | CAT-box, Skn-1_motif, circadian | Box 4, Box 1, ATCC-motif, ATCT-motif, CATT-motif, G-Box, GAG-motif, I-box, chs-CMA2a | ARE, HSE | ABRE, TCA-element |
| CbuCOMT5 | Circadian, GCN4_motif, Skn-1_motif | ACE, BOX 4, BOX 1, G-BOX, GA-motif, G1-motif, Sp1, TCT- motif, BOX 2, chs-CMA1a, chs-CMA2a | ARE, BOX-W1, HSE, MBS, TC-rich repeats | ERE |
| CbuCOMT6 | CAT-box, GC-motif, GCN4_motif, O2-site, Skn-1_motif, circadian | AT1-motif, ATCC-motif, Box 4, Box 1, G-Box, GATA-motif, GT1-motif, Gap-box, I-box, TCT-motif | HSE, MBS, TC-rich repeats | ABRE, ERE, GARE-motif, P-box, TGA-box |
| CbuCOMT7 | Circadian, CAT-BOX, GCN4_motif, Skn-1_motif, O2-site, GC-motif | BOX 1, BOX4, G-BOX, I-box, GATA-motif, ACE, AE-box, CATT-motif, GT1-motif, L-box, TGG-motif, as-2-box | HSE, MBS | ABRE, GARE-motif, TCA-element, ERE |
| CbuCOMT8 | Skn-1_motif | BOX 1, I-box, G-BOX, BOX4, ACA-motif, GATA-motif, TCT-motif | ARE, TC-rich repeats, BOX-W1, HSE | |
| CbuCOMT9 | MSA-like, O2-site | TCT- motif, BOX I, G-BOX, chs-CMA1a, AAAC-motif, ATCT-motif, MRE, TCT-motif | ARE, MBS | ABRE, GARE-motif, TGA-box |
| CbuCOMT10 | Skn-1_motif | BOX 1, G-BOX, ATCT-motif, I-box, GT1-motif, LAMP-element | ARE, BOX-W1, HSE, LTR, MBS | GARE-motif, TGA-box |
| CbuCOMT11 | Skn-1_motif | BOX 4, BOX 1, G-BOX, GATA-motif, TCT- motif, 3-AF1 binding site, ACA-motif, I-box | ARE, BOX-W1, HSE, TC-rich repeats | |
| CbuCOMT12 | circadian, Skn-1_motif | Box 4, Box 1, Box 2, GAG-motif, GT1-motif, G-Box, MNF1 | ARE, TC-rich repeats, HSE, MBS | ABRE, ERE, P-box |
| CbuCOMT13 | CAT-box, GCN4_motif, O2-site, Skn-1_motif, circadian | ACE, Box 4, G-Box, GATA-motif, CATT-motif, I-box, LAMP-element, Sp1, MNF1, TCT-motif | HSE, MBS, TC-rich repeats | ABRE, TATC-box, TCA-element, |
| CbuCOMT14 | O2-site, Skn-1_motif | Box 4, Box 1, GT1-motif, ATC-motif, GAG-motif, GT1-motif, I-box, Sp1, as-2-box | HSE, BOX-W1, MRE | ERE, TCA-element |
| CbuCOMT15 | O2-site, Skn-1_motif, circadian | ACE, ATCT-motif, Box 4, Box 1, G-Box, GA-motif, GT1-motif, I-box, Sp1, TCT-motif, chs-CMA2a, BOX 2 | HSE, TC-rich repeats | ABRE, TCA-element |
| CbuCOMT16 | Circadian, GCN4_motif | Box 4, BOX-W1 | LTR | TCA-element, GARE-motif |
| CbuCOMT17 | Circadian, Skn-1_motif | ATCT-motif, Box 4, Box 1, BOX-W1, G-Box, GAG-motif, GT1-motif, chs-CMA2a, Gap-box, MNF1 | ARE, MBS, HSE, P-Box | TGA-box, ABRE, TCA-element |
| CbuCOMT18 | Circadian, Skn-1_motif | ATCT-motif, Box 4, Box 1, GAG-motif, GT1-motif, chs-CMA2a, MRE, Sp1, as-2-box, chs-Unit 1 ml, GATA-motif | ARE, LTR, MBS, TC-rich repeats | TGA-box, ABRE, ERE, TCA-element, P-Box |
| CbuCOMT19 | Skn-1_motif, circadian | Box 4, Box 1, CATT-motif, GAG-motif, GT1-motif | MBS, MBSII, TC-rich repeatst | TCA-element |
| CbuCOMT20 | GC-motif, GCN4_motif, Skn-1_motif | G-Box, CATT-motif, I-box, GT1-motif, ACE | ARE, BOX-W1, HSE, TC-rich repeats | |
| CbuCOMT21 | O2-site, Skn-1_motif, circadian | Box 4, Box 1, G-Box, I-box, Sp1, CATT-motif, as-2-box, MRE | ARE, TC-rich repeats | ABRE, TATC-box, TGA-box |
| CbuCOMT22 | CAT-box, GCN4_motif, O2-site, Skn-1_motif, | ATCT-motif, Box 4, Box 1, CATT-motif, G-Box, LAMP-element, MNF1, TCT-motif | ARE, BOX-W1, HSE, MBS, TC-rich repeats | ERE |
| CbuCOMT23 | Skn-1_motif, circadian | Box 4, Box 1, GT1-motif, I-box, MNF1, as-2-box | ARE, BOX-W1 | TCA-element, TGA-box |
To identify the likely cis-regulatory elements (CREs) of CbuCOMTs, the promoter regions of the CbuCOMT genes were used to search the PlantCARE database; the results are listed in Table 2. A series of CREs involved in developmental processes such as circadian motifs and the Skn-1 and GCN4 motifs found in the promoters of the CbuCOMT14, 20, and 8 genes. Additionally, Box I, Box 4, the ATCT motif and other light response-related motifs were also found among the promoters of CbuCOMT genes, indicating that the expression of CbuCOMT genes may be regulated by light. Notably, several hormone response motifs were also identified. For example, ABRE (abscisic acid [ABA]-responsive element), GARE-motif, P-box, and TATC-box (gibberellic acid-responsive elements), ERE (ethylene-responsive element), and TCA (salicylic acid-responsive element), and TGA (auxin-responsive element) were found among the promoters. In addition, several CREs related to abiotic stress responses were found in the promoters of CbuCOMT genes; for example, HSE was present in the promoters of 14 CbuCOMT genes. The anaerobic induction element (ARE), defence and stress-responsive element (TC rich), and MYB binding sites involved in drought inducibility (MBS) were found in 15, 14, and 13 CbuCOMT gene promoters, respectively.
Expression profiles of CbuCOMT genes in various tissues
To identify the expression patterns of CbuCOMTs, qRT-PCR was performed on the 23 CbuCOMTs in six different tissues, the leaves, bark, xylem, phloem, branches and flowers of 8-year-old C. bungei plants. To verify the specificity of each primer for qRT-PCR, the primers were checked using BLAST against the genome sequence of C. bungei, and qRT-PCR products were sequenced. The qRT-PCR results are shown in File S2. COMT genes exhibited markedly different expressional profiles; for example, CbuCOMT10, and 23 were highly expressed in xylem, but low expression was observed among the other five tissues, whereas CbuCOMT17 and 18 were more highly expressed in leaves, young stems, and phloem, but showed very little expression in flowers and bark. Among the 23 CbuCOMTs, CbuCOMT1, 3, 6, 7, 8, 13, 14, 16, 19 showed extremely low expression in all six tissues, possibly due to spatially or temporally specific expression. Expression levels of CbuCOMT1 and 20 were much higher in flowers than in other tissues.
Expression profiles of CbuCOMTs in TW, NW, and OW
The relative expression levels of the 23 CbuCOMT genes in TW, NW, and OW are shown in Table 3. The qRT-PCR results showed that CbuCOMT3, 6, 13, 16, 19, and 22 were not expressed in xylem (TW, NW, and OW), and CbuCOMT11 was not expressed in TW. Although the expression levels of most CbuCOMT genes changed following the bending treatment, only CbuCOMT10 and 23 showed significant differences (—log2FC— ≤1). The expression levels of CbuCOMT10 and 23 decreased significantly in TW compared to NW (log2FC (TW/NW) = −1.22 and −1.27, respectively); however, the expression levels of these two genes showed an opposite trend in OW such that CbuCOMT23 increased markedly in xylem under compression stress (log2FC = 1.35), whereas CbuCOMT10 showed a downward trend in expression (log2FC = −0.43).
| ID | TW | NW | OW | log2FC (TW/NW) | log2FC (OW/NW) |
|---|---|---|---|---|---|
| CbuCOMT1 | 2.22 ± 0.56 | 2.37 ± 0.94 | 2.59 ± 0.27 | −0.15 | 0.22 |
| CbuCOMT2 | 2.69 ± 0.19 | 3.48 ± 0.28 | 3.38 ± 0.22 | −0.79 | −0.10 |
| CbuCOMT3 | – | – | – | – | – |
| CbuCOMT4 | 1.06 ± 0.05 | 1.78 ± 0.13 | 1.77 ± 0.38 | −0.72 | −0.01 |
| CbuCOMT5 | 3.22 ± 0.64 | 3.01 ± 0.47 | 2.85 ± 0.59 | 0.21 | −0.16 |
| CbuCOMT6 | – | – | – | – | – |
| CbuCOMT7 | 0.77 ± 0.23 | 0.80 ± 0.15 | 1.36 ± 0.56 | −0.03 | 0.56 |
| CbuCOMT8 | 0.88 ± 0.12 | 0.84 ± 0.22 | 0.78 ± 0.11 | 0.04 | −0.08 |
| CbuCOMT9 | 2.20 ± 0.32 | 3.01 ± 0.26 | 3.50 ± 0.45 | −0.81 | 0.49 |
| CbuCOMT10 | 3.65 ± 1.01 | 4.87 ± 1.20 | 4.44 ± 0.88 | −1.22 | −0.43 |
| CbuCOMT11 | – | 0.11 ± 0.01 | 0.10 ± 0.02 | – | −0.01 |
| CbuCOMT12 | 2.08 ± 0.25 | 2.31 ± 0.11 | 2.58 ± 0.36 | −0.23 | 0.27 |
| CbuCOMT13 | – | – | – | – | – |
| CbuCOMT14 | 0.58 ± 0.06 | 0.44 ± 0.04 | 1.16 ± 0.18 | 0.14 | 0.72 |
| CbuCOMT15 | 0.66 ± 0.08 | 0.98 ± 0.12 | 0.59 ± 0.09 | −0.32 | −0.39 |
| CbuCOMT16 | – | – | – | – | – |
| CbuCOMT17 | 0.24 ± 0.02 | 0.24 ± 0.01 | 0.54 ± 0.13 | 0 | 0.30 |
| CbuCOMT18 | 5.25 ± 1.11 | 5.21 ± 1.32 | 4.26 ± 1.54 | 0.04 | −0.95 |
| CbuCOMT19 | – | – | – | – | – |
| CbuCOMT20 | 0.41 ± 0.05 | 0.30 ± 0.02 | 0.64 ± 0.07 | 0.11 | 0.34 |
| CbuCOMT21 | 3.03 ± 0.76 | 3.24 ± 0.68 | 4.12 ± 1.09 | −0.21 | 0.88 |
| CbuCOMT22 | – | – | – | – | – |
| CbuCOMT23 | 9.96 ± 0.88 | 11.23 ± 1.25 | 12.58 ± 1.58 | −1.27 | 1.35 |
Notes:
Discussion
COMT family genes are ubiquitous among plant species and have been surveyed at the whole-genome level in several species including A. thaliana, Brassica napus, Brachypodium distachyon, Oryza sativa, Populus trichocarpa , and others. In this study, a total of 23 COMT genes were identified based on the Catalpa bungei genome and named as CbuCOMT1 to CbuCOMT 23. Genomic DNA, CDS lengths, and deduced amino acid sequences were variable among these genes (Table 1), which led to changes in the theoretical MW and pI of CbuCOMT members. The structure of the phylogenetic tree obtained from the alignment of AtCOMT s, PtCOMT s, and CbuCOMTs indicates that COMT genes can be divided into five major groups, as reported in a previous study (Li et al., 2016). The functions of COMTs have been identified, and they play vital roles in S-type lignin production; however, to date, their roles in C. bungi have remained unclear. Therefore, we preliminarily predicted the functions of CbuCOMTs based on the homology of other COMTs. According to the phylogenetic tree, AT5G54160.1 belonged to group III and was closely related to CbuCOMT3, 7, 8, 9, 10, 11, 14, and 22, indicating that CbuCOMTs belonging to group III may have similar functions. AT5G54160.1 encodes a caffeic acid O-methyltransferase that participates in S-lignin synthesis (Moinuddin et al., 2010; Vanholme et al., 2010) and melatonin synthesis by catalysing N-acetylserotonin methylation in Arabidopsis ((Byeon et al., 2014)). It has been reported that some COMT genes are involved in lignin biosynthesis and other processes such as glucosinolate metabolism. At1g21100, At1g21110, At1g21120, At1g21130, and At1g76790 mainly participate in glucosinolate metabolism and other processes (Li et al., 2016). These genes clustered together with CbuCOMTs in group III, indicating that CbuCOMTs in this group may also participate in glucosinolate metabolism. Except for CbuCOMT3, CbuCOMTs in group III also clustered with PtrCOMT2, of which protein abundance and COMT total activity gradually and continuously increased during the lignification of Populus early stems, indicating that PtrCOMT 2 may participate in the lignification of Populus stems (Liu et al., 2015). In our study, CbuCOMT7, 9, and 10 from group III were more highly expressed in xylem than in the other five organs, suggesting that they may be involved in the lignification of xylem in C. bungei.
CbuCOMTs in groups I and II clustered with PtrCOMT s. The downregulation of COMT expression in poplar has been explored by several researchers. Jouanin et al. (2000) found a COMT downregulated transgenic poplar line with almost no COMT activity. In this line, the lignin level was reduced by 17% and lignin structure was strongly altered, with a 200% increase in condensed bond content and a nearly complete lack of S-lignin. In Populus trichocarpa, 25 COMT genes were identified by Shi et al. (2010); the expression profiles of 25 PtrCOMT differed significantly from each other. PtrCOMT 2 was highly expressed in leaves, shoots, phloem, and xylem, whereas PtrCOMT 19 had only slight or no expression in these organs, indicating that, although these genes belong to the same family, they may have different functions . This finding is also supported by a study of the AT4G35160.1 gene, which was identified as a COMT gene based on functional domain analysis, but was later shown to mainly participate in melatonin synthesis with very little caffeic acid O-methyltransferase activity in Arabidopsis (Lee et al., 2014). Notably, CbuCOMT23 expression was dramatically higher than that of the other 22 CbuCOMTs in NW (xylem), indicating that CbuCOMT23 may have important functions in xylem. TW usually contains more cellulose and less hemicellulose and lignin than does NW, whereas OW has greater lignin content. Thus, many researches have conducted microarray analysis of artificially bent trunks to identify genes that participate in the synthesis of lignin, phytohormone, cellulose, and many other components (Chen, Chen & Zhang, 2015). In our study, CbuCOMT23 expression decreased under tension stress (TW) and increased in OW, implying that CbuCOMT23 gene may be involved in lignin synthesis in xylem, and associated with C. bungei wood properties. The expression of CbuCOMT10 showed significantly reduce in TW, suggesting CbuCOMT10 may be involved in the declined lignification of TW. However, these hypotheses must be verified through further experiments. In addition, the expression of genes were normalized by a reference gene, not absolute quantification, which is just a relative quantification. In later study, we will further quantify the COMT genes using RNA-seq or absolute quantification.
Fewer COMTs were identified in C. bungei (23, genome size: 740 M) than in Sesamum indicum (34, genome size: 274 M), P. trichocarpa (25, genome size: 480 M), and Solanum tuberosum (34, genome size: 844 M), but more than in A. thaliana (14, genome size: 125 M), Mimulus guttatus (11, genome size: 430 M), Solanum lycopersicum (17, genome size: 900 M), Utricularia gibba (10, genome size: 82 M), Salvia miltiorrhiza (10, genome size: 641 M), Petunia axillaris (8, genome size: 1.4 Gb), and Capsicum baccatum (19, genome size: 3.48 Gb). The number of COMTs did not increase with the enlargement of the genomes, possibly due to the unusual expansion and contraction history of the COMT gene family in these species. The phylogenetic tree indicated that C. bungei may have a closer genetic evolutionary relationship with Sesamum indicum than with the other plants investigated in this study; this result was similar to those of our studies on other genes (unpublished data, the relevant paper is under preparation now).
In our study, most CbuCOMTs had one to three introns, and within the same phylogenetic group, members generally had similar exon–intron structures. For example, CbuCOMTs in group II had one intron or none, whereas CbuCOMTs in group III had two or more introns, indicating that the evolution of the COMT gene family may be closely related to the diversification of gene structures. Similar results have been obtained in other gene families (Song et al., 2017). It has been reported that genes with lower intron densities are rapidly expressed after induction because introns may affect expression efficiency through at least three possible mechanisms, delaying transcript production by (1) splicing, (2) additional length of the nascent transcript, or (3) increased energetic cost due to increased transcript length (Jeffares, Penkett & Bähler, 2008). In our study, most CbuCOMTs clustered in groups I and II had fewer introns than CbuCOMTs from group III, suggesting a possible faster response to induction, however, it still needs to be further demonstrated.
The regulation of gene transcription is a complex process involving various proteins bound in a sequence-specific manner to cis-regulatory elements present in the promoter regions. In our study, numerous cis-regulatory elements related to light response were found; among these, GATA-motifs (Argüello-Astorga & Herrera-Estrella, 2018), I-box (Donald & Cashmore, 1990), GT1-motif (Gao et al., 2004), and G-box (Giuliano et al., 1988) are essential for light-mediated transcriptional activity. The results of our study suggest that CbuCOMT genes may regulate S-type lignin synthesis by interacting with light-inducible proteins and that 14 CbuCOMT gene promoters also contained motifs for circadian cycles. In higher plants, the expression of a large number of genes is under circadian regulation, including genes associated with photosynthesis, starch mobilising enzymes, and some metabolic pathways. Hormones are key regulators of plant growth and development. ABA-, auxin-, ethylene-, GA-, and salicylic acid-responsive elements were found in the promoters of CbuCOMT genes, indicating a potential role for hormones in the regulation of CbuCOMT genes, in agreement with Kim et al. (2013), who demonstrated that the expression of a COMT gene from kenaf (Hibiscus cannabinus) increased after 6 h of treatment with salicylic acid. They also found that the COMT gene could be induced by cold, H2O2, and salt (Kim et al., 2013), which indicated that the transcription of COMT genes may be induced by both hormones and some abiotic stresses. Li et al. (2016) found that some COMT family genes in Brassica napus had higher expression levels under drought treatment than under non-stressed conditions (Li et al., 2016). Similarly, Li et al. (2015a) demonstrated that the expression of a COMT gene in Ligusticum could be significantly induced by cold and drought, but not salt (Li et al., 2015a). In our study, motifs related to stress, such as ARE, LTR, and MBS were present in some COMT promoter sequences, indicating that these COMT genes may responsible for sensing environmental stresses. Heat-responsive cis-acting regulatory elements were found in some CbuCOMT gene promoters, suggesting their possible roles in heat stress response and MBS-conferred drought response in plants (Asif et al., 2014; Table 2). Other CREs such as Box-W1, TC-rich repeats, ARE, and LTR are also involved in stress response (Zhang et al., 2015). Our results indicate that CbuCOMT gene expression may be induced by abiotic stresses; however, this finding must be further studied.
Conclusion
A relatively complete basic analysis of COMT gene family members in C. bungei was performed in this study. We identified 23 genes as putative CbuCOMT genes and their expression levels in six different C. bungei tissue types were assessed using qRT-PCR. Distinctly different expression profiles among members of the CbuCOMT gene family suggest that these genes may play different roles in development. Our results provide a foundation for elucidating the functions of CbuCOMT family genes; however, further study of each family member using genetic modification is essential to resolve their specific functions.
Supplemental Information
The information of possible COMT genes in other Tubiflorae plants
Expression levels of the members of the CbuCOMT gene family in different organs detected by qRT-PCR
Data with the same letter are not significantly different ( P = 0.05) according to Duncan’s multiple range test. The error bar refers to standard deviation.