
Structure, dynamics and predicted functional role of the gut microbiota of the blue (Haliotis fulgens) and yellow (H. corrugata) abalone from Baja California Sur, Mexico
- Published
- Accepted
- Received
- Academic Editor
- Hauke Smidt
- Subject Areas
- Bioinformatics, Microbiology, Molecular Biology
- Keywords
- Haliotis fulgens and H. corrugata microbiota composition, Bacterial interaction, Ecological function predictions., 454 Pyrosequencing
- Copyright
- © 2018 Cicala et al.
- Licence
- This is an open access article distributed under the terms of the Creative Commons Attribution License, which permits unrestricted use, distribution, reproduction and adaptation in any medium and for any purpose provided that it is properly attributed. For attribution, the original author(s), title, publication source (PeerJ) and either DOI or URL of the article must be cited.
- Cite this article
- 2018. Structure, dynamics and predicted functional role of the gut microbiota of the blue (Haliotis fulgens) and yellow (H. corrugata) abalone from Baja California Sur, Mexico. PeerJ 6:e5830 https://doi.org/10.7717/peerj.5830
Abstract
The GI microbiota of abalone contains a highly complex bacterial assemblage playing an essential role in the overall health of these gastropods. The gut bacterial communities of abalone species characterized so far reveal considerable interspecific variability, likely resulting from bacterial interactions and constrained by the ecology of their abalone host species; however, they remain poorly investigated. Additionally, the extent to which structural changes in the microbiota entail functional shifts in metabolic pathways of bacterial communities remains unexplored. In order to address these questions, we characterized the gut microbiota of the northeast Pacific blue (Haliotis fulgens or HF) and yellow (Haliotis corrugata or HC) abalone by 16S rRNA gene pyrosequencing to shed light on: (i) their gut microbiota structure; (ii) how bacteria may interact among them; and (iii) predicted shifts in bacterial metabolic functions associated with the observed structural changes. Our findings revealed that Mycoplasma dominated the GI microbiome in both species. However, the structure of the bacterial communities differed significantly in spite of considerable intraspecific variation. This resulted from changes in predominant species composition in each GI microbiota, suggesting host-specific adaptation of bacterial lineages to these sympatric abalone. We hypothesize that the presence of exclusive OTUs in each microbiota may relate to host-specific differences in competitive pressure. Significant differences in bacterial diversity were found between species for the explored metabolic pathways despite their functional overlap. A more diverse array of bacteria contributed to each function in HC, whereas a single or much fewer OTUs were generally observed in HF. The structural and functional analyses allowed us to describe a significant taxonomic split and functional overlap between the microbiota of HF and HC abalone.
Background
The gastro-intestinal tract (or GI) of metazoans may be considered a highly complex ecosystem inhabited by a large number of bacteria (Backhed, 2005). For instance, the commensal microbiota harbored by the human GI far exceeds the total number of cells in the entire human body, and their collective genome (microbiome) is orders of magnitude larger than our own (Backhed, 2005; Bates et al., 2006). Moreover, the GI microbiome has been associated with essential physiological activities such as food digestion, nutrient assimilation, and defense against invasion of foreign bacterial species; which in turn may prevent epidemiologic outbreaks (Ten Doeschate & Coyne, 2008; Zhao et al., 2012; Blaut & Clavel, 2007). Also, functional studies have revealed that the relationship between the gut microbiome and its host may be so close that bacteria may be directly involved in the maturation of the GI tract of the hosts species (Bates et al., 2006; Bry et al., 1996; Bano et al., 2007).
Abalone (or Haliotis spp.) are worldwide gastropods that play essential ecological roles. Adult abalone are considered ecosystem engineers, as they graze macro and micro-algae at species-specific depths, which maintains open habitat exploited by other benthic organisms (Crosson & Friedman, 2017; Cox, 1962). Several abalone species support valuable fisheries and aquaculture production in many countries around the world (Crosson & Friedman, 2017). For example, the peninsula of Baja California harbors seven exploitable abalone species (Morales-Bojórquez, Muciño Díaz & Vélez-Barajas, 2008), two of which, the blue abalone Haliotis fulgens (HF, henceforth) and the yellow abalone Haliotis corrugata (HC, henceforth), sustain the high-valued fishery in the NW Mexican Pacific coast (Morales-Bojórquez, Muciño Díaz & Vélez-Barajas, 2008; SAGARPA, 2009).
As documented by cultured and uncultured approaches, the composition of the abalone gut microbiota may be influenced by a variety of factors such as diet, environmental conditions and ontogenetic stages (Ten Doeschate & Coyne, 2008; Zhao et al., 2012; Meryandini, Junior & Rusmana, 2015; Sawabe et al., 2003; Tanaka et al., 2003; Pang, Xiao & Bao, 2006). Also, the use of probiotics has revealed that interspecific bacterial relationships may shape the final gut microbiome composition of several marine invertebrates, including abalone (Meryandini, Junior & Rusmana, 2015; Sawabe et al., 2003; Tanaka et al., 2003). Overall, these factors may explain the consistent differences in the gut microbiome of abalone species studied so far. In this context, the most abundant bacteria in homogenate samples of the entire GI of H. discus hannai were fermenter Gammaproteobacteria, such as Vibrio halioticoli as well as other Vibrio species, Alphaproteobacteria, Mollicutes and Fusobacteria (Tanaka et al., 2003; Tanaka et al., 2004). Moreover, the intestinal microbiota (from stomach to anus) of H. diversicolor was dominated by Mollicutes, Flammeovirga, as well as Alpha-, Beta-, Gamma- and Delta- proteobacteria (Huang et al., 2010). In contrast, the bacterial composition of H. gigantea (from homogenate samples of the entire GI) appears less complex with a preponderance of Gammaproteobacteria and Mollicutes (Iehata et al., 2014).
Despite the importance of the GI microbiomes for the survival of blue and yellow abalone, no efforts have been made to characterize them. Furthermore, it is equally uncertain which factors may shape their final composition as well as the functional roles played by the most representative bacterial groups. Accordingly, we hypothesize that the composition of GI microbiomes harbored by HF and HC abalone may reflect species-specific ecological adaptations; for example, they may change in response to the distinct bathymetric distribution of these species (3–4 m in the shallow HF and as deep as 25 m for HC). To analyze the structure and variability of the GI microbiota of wild-caught specimens of HC and HF, we collected post esophageal tissues of both abalone species and sequenced 16S rRNA gene amplicons using 454 pyrosequencing (Roche). Profiling of detected OTUs was used to characterize bacterial communities according to qualitative (e.g., presence/absence) and quantitative (e.g., read abundance) analyses. Additionally, the phylogenetic distance among microbial communities was assessed using unweighted UniFrac metrics. Finally, we analyzed the functional consequences of structural changes using a predictive metagenomic analysis.
Materials and Methods
Sample collection and genetic analyses
Wild abalone (n = 31 HF, n = 35 HC) were collected from the commercial harvest along the Pacific coast Baja California (Mexico) from Isla Natividad (27°53′33″N 115° 13′19″W) to Punta Abreojos (26°42′52″N 113°34′20″W), during two field expeditions organized in April and November 2012 (Table S1). In the field, approximately 30 mg of post esophageal tissue were dissected from visually healthy animals bearing no signs of the withering syndrome (Friedman, 2012), and immediately transferred to sterile 1.5 ml microcentrifuge tubes containing molecular grade ethanol, until further analysis. Total DNA was extracted and purified from preserved tissues using DNeasy blood & tissue kit (Qiagen, Valencia, CA, USA) following manufacturer’s protocols.
A fragment of the bacterial ribosomal 16S rRNA spanning V1–V3 regions was PCR amplified using universal eubacterial primers 28F: 5′-GAGTTTGATCNTGGCTCAG- 3′ (Ludwig, Mittenhuber & Friedrich, 1993) and 519R: 5′-GTNTTACNGCGGCKGCTG - 3′ (Ruff-Roberts, Kuenen & Ward, 1994). PCR reactions (20 µl) contained: 1X PCR Buffer (Kapa Biosystems, Woburn, MA, USA), 1.5 mM magnesium chloride (Kapa Biosystems, Woburn, MA, USA), 0.2 mM dNTPs (New England Biolabs, Beverly, MA, USA), 0.5 µM each primer, 0.4 mM bovine serum albumin (New England Biolabs, Beverly, MA, USA), 1U Taq polymerase (Kapa Biosystems, Woburn, MA, USA), and 100 ng purified DNA. Thermal cycling consisted of an initial incubation at 94 °C for 4 min, followed by 40 cycles of: 94 °C for 1 min; 62 °C for 30 s and 72 °C for 30 s, and a final incubation of 8 min at 72 °C. Confirmation of amplification was carried out by 1.5% agarose gel electrophoresis. Amplicons were subsequently tagged using Roche 454 adaptors and multiplex identifier (MID) tags for each organism, following the bacterial tag-encoded FLX amplicon pyrosequencing (bTEFAP) approach of Dowd et al. (2008). Following normalization, Roche 454 pyrosequencing was carried out in a GS FLX Titanium platform by Research and Testing Laboratory (Lubbock, TX, USA).
Finally, given that different DNA extraction and/or purification methods may introduce bias against either gram positive or negative bacteria in purified DNA (Yuan et al., 2012; Gill et al., 2016), we evaluated the introduction of such bias in our samples. We tested in a random subset of eight DNA samples (four from each species) their suitability for amplifying gram negative and gram positive DNA using gram-specific forward primers (16S_68d for gram negative and 16S_143 for gram positive) (Klausegger et al., 1999). PCR reactions (15 µl) contained: 1× PCR Buffer (Kapa Biosystems, Woburn, MA, USA), 1 mM magnesium chloride (Kapa Biosystems, Woburn, MA, USA), 0.4 mM dNTPs (New England Biolabs), 0.4 µM each primer, 1U Taq polymerase (Kapa Biosystems, Woburn, MA, USA), and 90 ng purified DNA. The same thermal cycling conditions were used as described for universal eubacterial primers, except that the annealing temperatures were 55 and 60 °C for gram positive and negative specific primers, respectively. Confirmation of amplification was carried out by 1.5% agarose gel electrophoresis.
Bioinformatic analyses
The 16S rRNA reads were analyzed using Quantitative Insights Into Microbial Ecology (QIIME) software version 1.9.1 (Caporaso et al., 2010b). The first step consisted in demultiplexing; subsequently, reads were filtered according to Phred quality scores obtained from the 454 pyrosequencing. Acceptance quality criteria consisted of: (i) minimum and maximum lengths of 250 and 550 bp, respectively; (ii) default minimum quality Phred score of 25; (iii) maximum homopolymer length of 6 bp.
Sequences that met quality criteria were initially filtered using USEARCH (Edgar, 2010) to detect and remove chimeras as implemented in QIIME pipeline (Caporaso et al., 2010b) and then clustered in operational taxonomic units (OTUs) at 97% sequence similarity using the UCLUST algorithm (Edgar, 2010). Taxonomic assignment was carried out using the longest sequence from each OTU and SILVA 128 database (Released: 28.09.2016 containing 646,151 sequences; http://www.arb-silva.de/). OTUs with total read number <20 were discarded; remaining OTUs were then aligned using Python Nearest Alignment Space Termination (PyNAST) algorithm (Caporaso et al., 2010a). The alignment was filtered to remove gaps and outliers (e.g., sequences dissimilar to the alignment consensus) using default QIIME parameters.
Additionally, to evaluate the potential bacterial origin of DNA of Unassigned OTUs (with no match in SILVA database), we aligned them with bona fide representative 16S rDNA sequences of Eubacteria, chloroplasts and Archean species from GenBank and reconstructed a Neighbor-joining (NJ) tree using MEGA 6 (Tamura et al., 2013). OTUs that fell outside of the Eubacterial lineage were removed from the PyNAST alignment before further analyses.
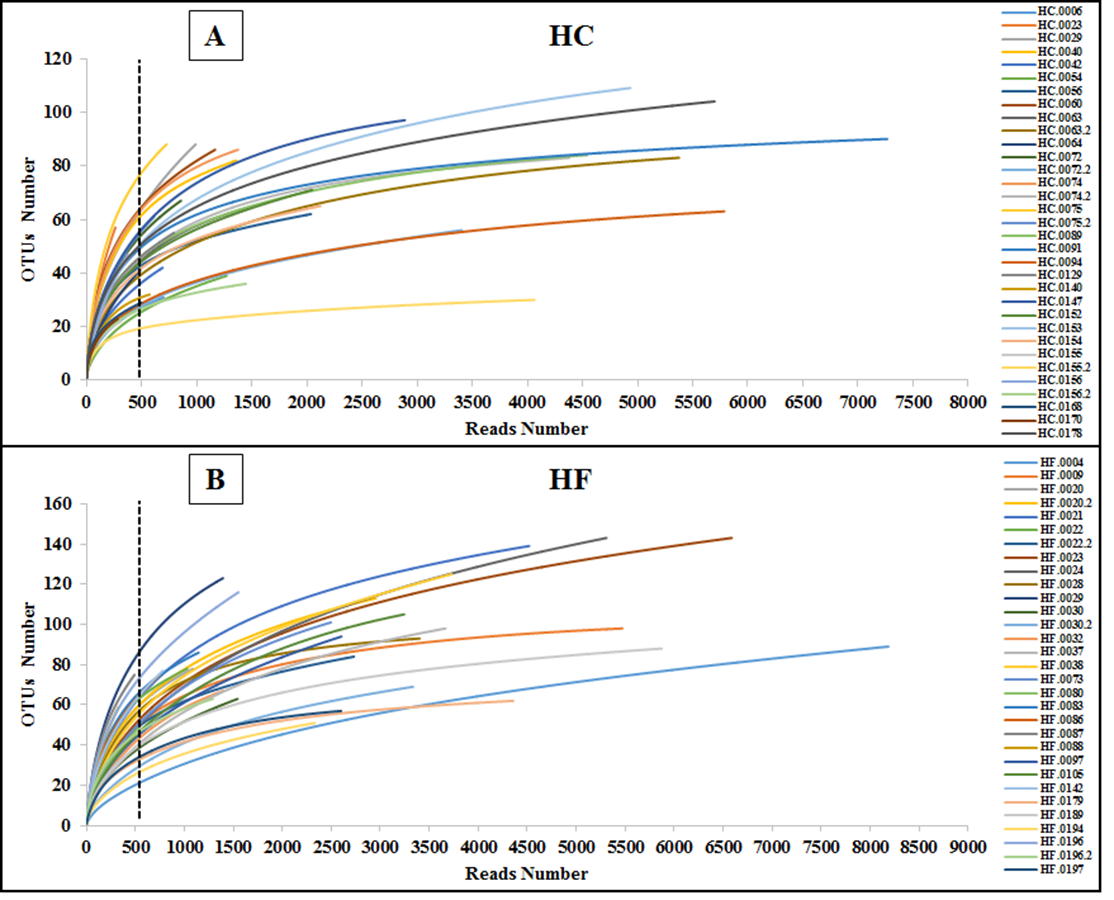
The number of reads of each abalone was normalized using the rarefication method (Weiss et al., 2017). Normalization was achieved by randomly subsampling 500 reads per abalone; we selected a sample size as close as possible to the asymptotic plateau of rarefaction curves in most abalone (Fig. S1).
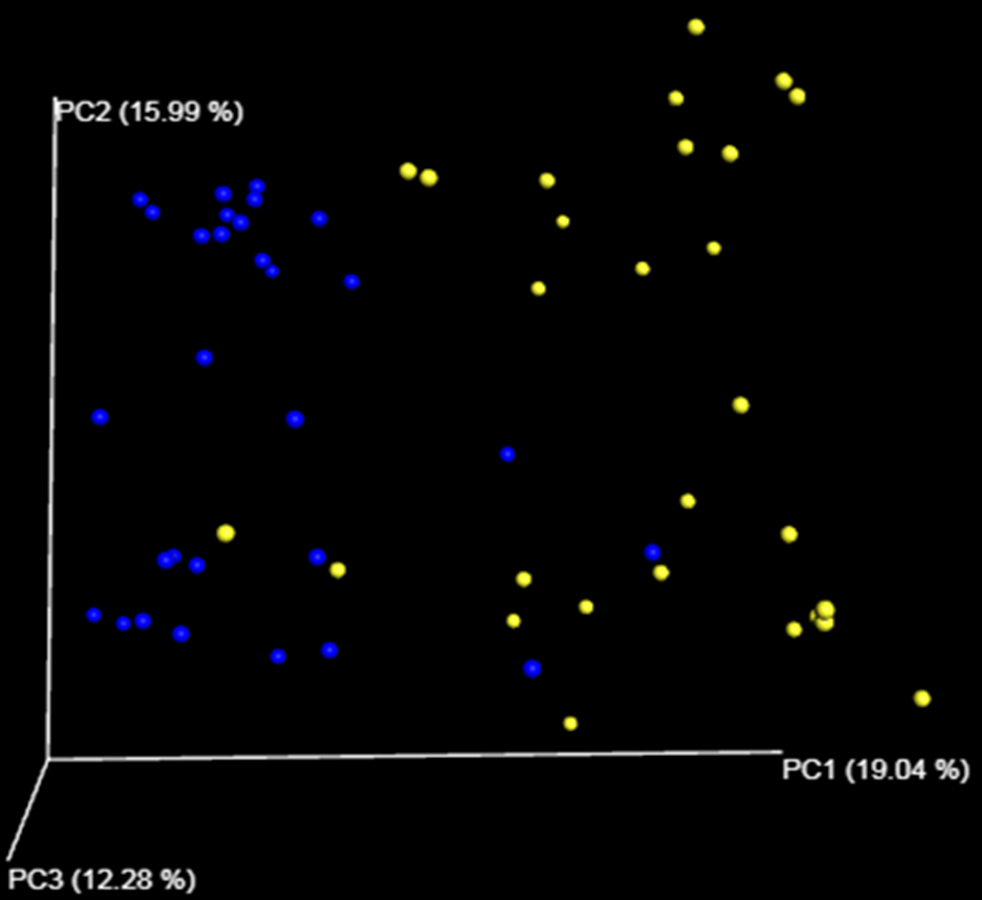
Principal coordinate analysis (PCoA) based on unweighted unique fraction metric (or UniFrac) distance was performed to compare the microbiota among HF and HC abalone species from an ecological-phylogenetic framework. Results were visualized using EMPeror (Vázquez-Baeza et al., 2013). Briefly, unweighted UniFrac is a qualitative β diversity analysis measuring the distance between two or more communities, as the fraction of the branch length in a phylogenetic tree that leads to descendants from either one community, but not both (Lozupone et al., 2007; Lozupone & Knight, 2005). Accordingly, this measure may reflect essential microbial adaptations to one environment (Lozupone & Knight, 2005). Statistical evaluation of UniFrac results was carried out using ANOSIM as implemented in QIIME (Caporaso et al., 2010b).
Ecological analysis
The normalized number of reads was used as abundance proxy to estimate diversity and structure of the abalone gut microbiota. Differences in the bacterial composition between abalone species were evaluated by a linear discriminant analysis (LDA) effect size (LEfSe) (Segata et al., 2011).
To assess how exhaustively bacterial communities of both abalone species were sampled, rarefaction curves of discovered OTUs were generated for increasing numbers of sampled abalone (Fig. 1). Also, OTU abundance was used to compute the non-parametric species richness estimator Chao 1 (Chao, 1984). Rarefaction curves were obtained using the EstimateS V.9.0.1 program (Colwell, 2013).
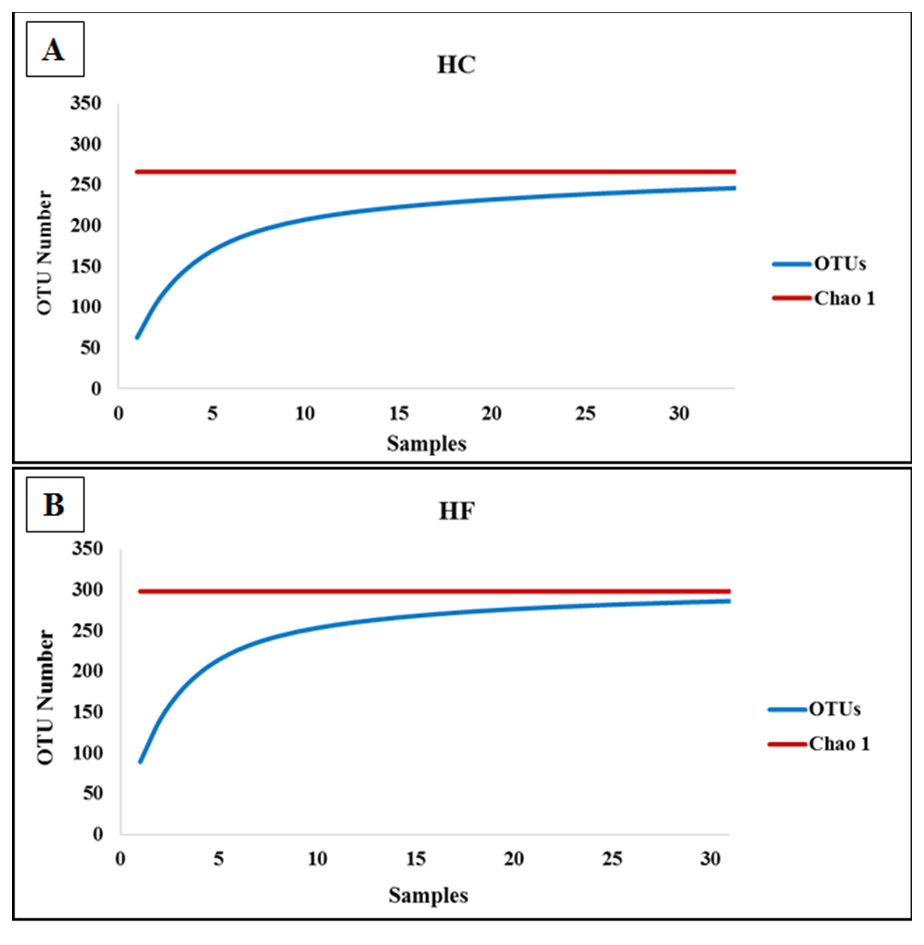
Figure 1: Diversity as function of sample size.
Rarefaction curves of the cumulative number of observed OTUs with increasing number of samples (individual abalone) and Chao 1 estimation of total OTU richness in microbiomes of (A) H. corrugata (HC) and (B) Haliotis fulgens (HF).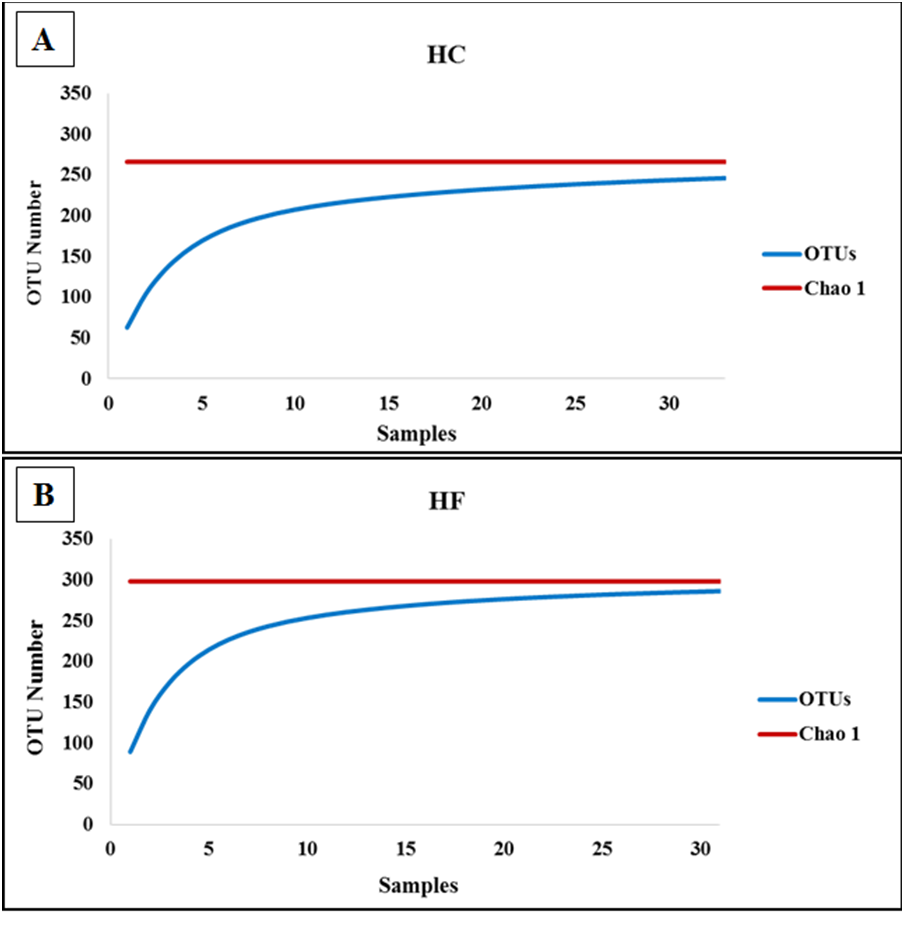
Microbiome community structure was evaluated using non-parametric multidimensional scaling (MDS) analyses using Bray–Curtis and Sorensen similarity indices based on read abundance and on presence/absence, respectively, as implemented in PRIMER V.6 (Clarke & Warwick, 2001). The statistical comparison of MDS results was performed with ANOSIM as implemented in Past V. 2.17c (Hammer, Harper & Ryan, 2001) using OTUs assigned to bacterial taxa matching SILVA database. To determine which OTUs were primarily responsible for the dissimilarity between HF and HC, a SIMPER analysis (Table S2) with square root transformed data was performed using PRIMER V.6 (Clarke & Warwick, 2001). In order to increase the number of OTUs used in the characterization of microbiomes, we repeated the analyses also including SILVA unassigned OTUs that were phylogenetically identified as bacteria, as described above.
Bacterial interactions in the microbiomes of both abalone species were estimated using Jaccard distance (Jd) as implemented in PRIMER V.6 (Clarke & Warwick, 2001). Jd is a measure of dissimilarity for all pairwise combinations of a data set (Dowd et al., 2008) and was calculated using OTUs presence/absence. Jd values close to 0 (from 0 to 0.33) were interpreted as co-occurrence (or putative mutualistic relationships) and values close to 1 (from 0.68 to 1) as interactions leading to exclusion (or putative competitive) (Rahel, 2000); whereas intermediate values were considered as neutral relationships.
Functional prediction of predominant bacterial species
A phylogenetic investigation of communities by reconstruction of unobserved states (PICRUSt) (Langille et al., 2013) was carried out to predict the functional attributes of metabolic genes from HF and HC GI microbiotas. Briefly, PICRUSt is a bioinformatic approach that uses information from a genetic marker, such as the 16S rRNA gene, to predict the functional content of a bacterial community characterized by metabarcoding (Langille et al., 2013; De Voogd et al., 2015). Functional predictions are obtained by matching 16S rRNA gene sequences against a genomic KEGG database, previous normalization of read numbers (Langille et al., 2013; De Voogd et al., 2015). The central result of PICRUSt consists of a table of the functional gene frequencies known as KEGG Orthologs (or KOs). KOs are hierarchically organized in sets of homologous sequences with known function and assigned to biological pathways. We analyzed the data using the raw KOs counts as well as categorizing them by biological pathway. PICRUSt analyses use Greengenes (last released in 2013 containing 202,421 bacterial and archaeal sequences, http://greengenes.lbl.gov) as taxonomic and functional reference database. To implement quality control, we computed weighted nearest sequenced taxon index (NSTI) values for the metabarcodes of each abalone. NSTI was developed to evaluate the prediction accuracy of PICRUSt, since it reflects the average genetic distance (measured as number of substitutions per site) between an OTU against a reference genome (Langille et al., 2013; De Voogd et al., 2015). Following suggested guidelines (Langille et al., 2013), we eliminated observations with a NSTI higher than 0.17.
In order to assess the contribution of individual OTUs to predicted KO functions, first we focused our analyses on genes involved in metabolic pathways (KEGG IDs from EC:1.1.1 to EC:6.5.1). Next, we categorized the relative importance of KO genes by ranking them according to their counts. These counts were obtained with PICRUSt v.1.1.0 (Langille et al., 2013) and were log transformed to rank their relative abundance (Urbanová & Bárta, 2014). We focused our attention on a chosen subset of KOs with the highest counts (n = 10 selected at random), as a first order analysis to characterize functional differences between these microbiotas. Significance of differences in the contribution of OTUs to these KOs was evaluated non-parametrically using a χ2 test.
Finally, to compare the functionality of individual microbiomes in both species, non-parametric MDS analyses based on Bray–Curtis similarity using fourth root transformation were carried out using the count number of identified KEGG orthologs and the count number of predicted metabolic functions in PRIMER V6 (Clarke & Warwick, 2001).
Results
Pyrosequencing and metabarcoding results
Pyrosequencing yielded 451,095 raw 16S rRNA reads of which 239,125 met quality criteria and were non-chimeric, these were assigned to 1,508 OTUs. A number of these OTUs were removed from subsequent analyses, 1,066 because their read number was <20 and an additional 128 because they were genetically dissimilar from bona fide bacterial 16S rRNA sequences. The remaining 314 OTUs (comprising 157,686 quality reads −66%-) included 58 Unassigned-OTUs (Table S3) whose phylogenetic position fell within the Eubacterial linage (Fig. S2), suggesting they originate from unknown or poorly characterized bacterial taxa.
The most diverse microbial phyla in the gut microbiota of both abalone species were (number and % of OTUs): Tenericutes (230, 73.2%), Fusobacteria (16, 5.1%), and Proteobacteria (9, 2.9%). The most abundant OTUs were assigned to class Mollicutes (order Mycoplasmatales). Notably, LEfSe analysis revealed that 130 of 230 Mollicutes OTUs were exclusive or predominant to either in HC or HF (Table S4). Similar results were observed for other predominant bacterial families such Vibrionaceae (Table S4).
The classes Mollicutes, Fusobacteria, Alfa and Gamma-protobacteira comprised 99% of the identifiable reads. Rarefaction curves suggest that the bacterial communities were sufficiently sampled in both abalone species, given their asymptotic shape and the proximity of the observed number of taxa found in each species to CHAO 1 estimates (Fig. 1). Normalization was achieved by standardizing to a subsampling depth of 500 randomly subsampled reads per abalone, which represents the number of reads close to the asymptote for most organisms (Fig. S1). As a result, five HC and two HF abalone with less than 500 reads were excluded from subsequent analyses.
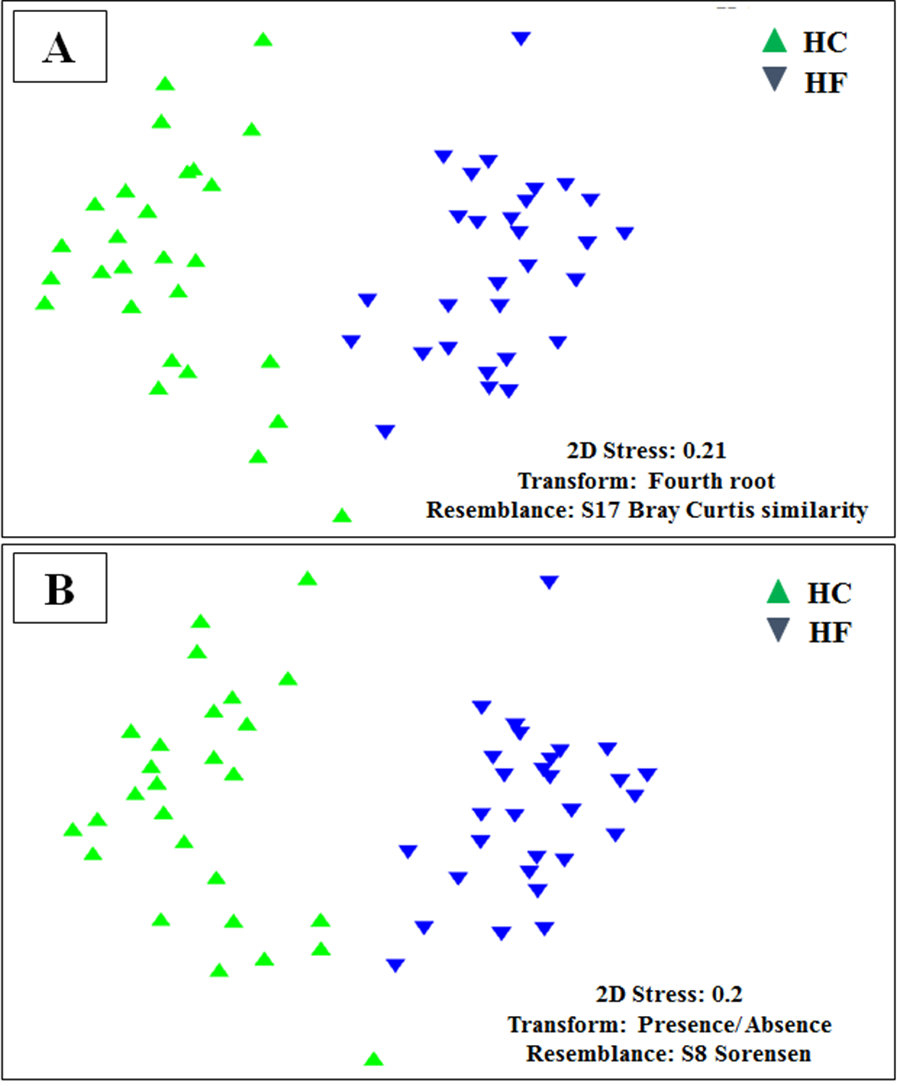
Despite the intra-specific compositional variation (Fig. S3) and similar community structure at the highest taxonomic resolution between abalone species (Fig. 2), MDS analyses performed using only bacterial OTUs, assigned using SILVA database, revealed a clear-cut structural difference between the GI bacterial metabarcodes of both species, both considering read number as a proxy of abundance and solely on the basis of presence/absence data (Fig. 3). Significant interspecific differentiation was corroborated by ANOSIM analyses in both cases (Rabundance = 0.786; p < 0.001; Rpresence∕absence = 0.788; p < 0.001). Given the large fraction of unassigned OTUs (36%), the inclusion of originally unassigned OTUs but phylogenetically identified as bacteria produced similar results (Fig. S4; Rabundance = 0.792; p < 0.001; Rpresence∕absence = 0.789; p < 0.001). This suggests that the distinction of both abalone microbiomes can be attributed to known and unknown bacterial taxa. PCoA based on unweighted UniFrac distance also supported the structural separation among HC and HF bacterial communities (Fig. S5; ANOSIM, Runweighted UniFrac = 0.39; p < 0.001).
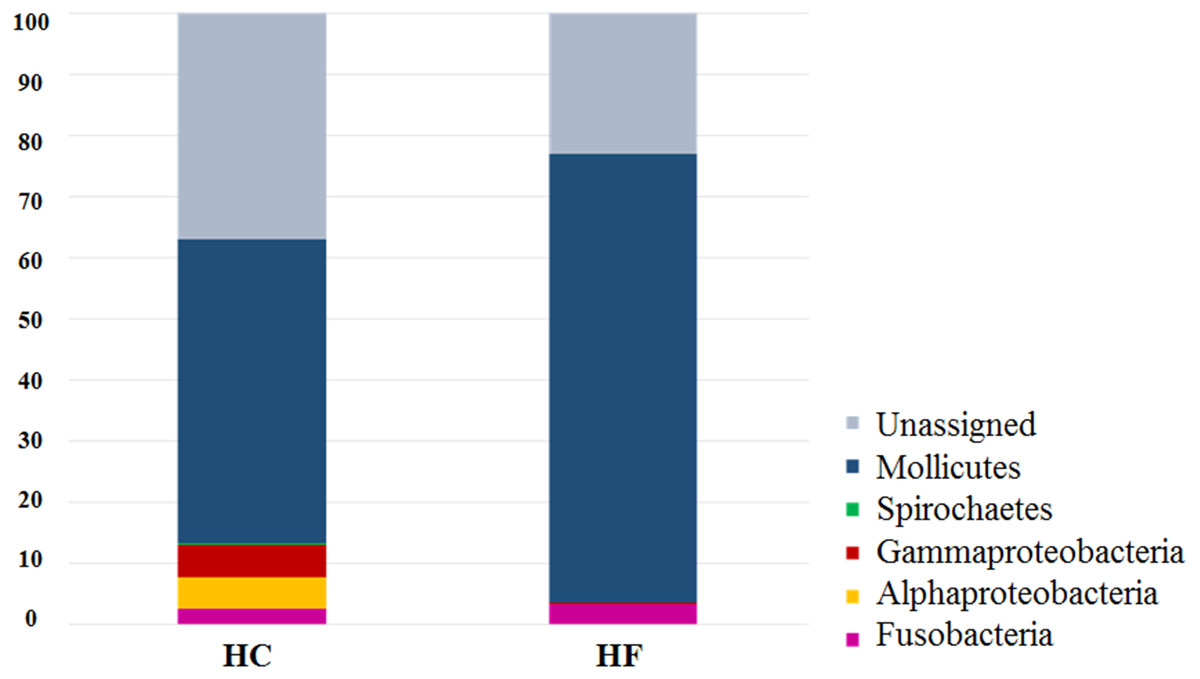
Figure 2: Species-specific GI tract microbiota composition.
Major bacterial taxa comprising the gut microbiota of H. corrugata (HC) and Haliotis fulgens (HF).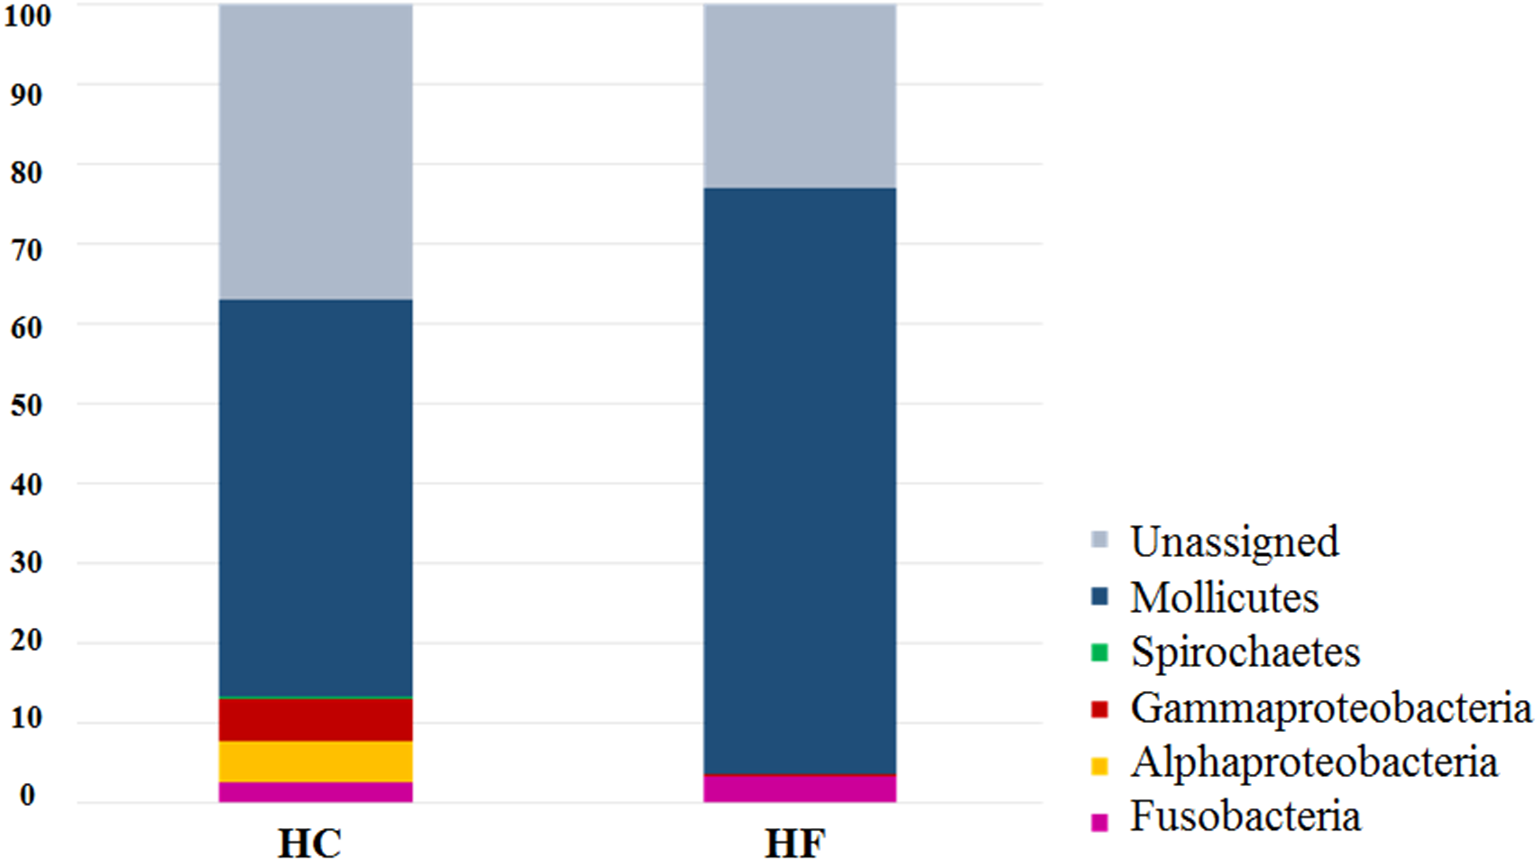
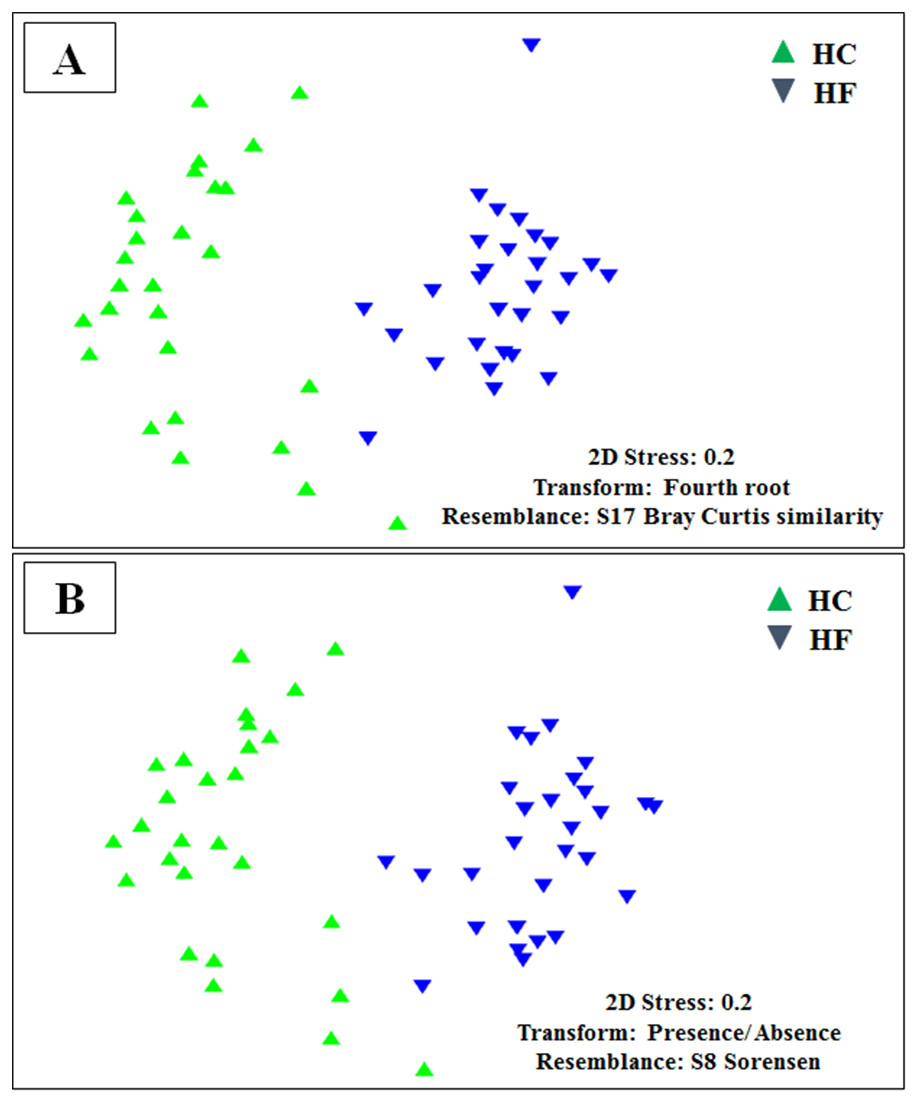
Figure 3: Microbiome structural variation.
Non-metric multidimensional scaling (MDS) based on: (A) Bray Curtis similarity index using fourth root transformed read abundance and (B) Sorensen similarity index based on presence/absence. Both MDSs were obtained using assigned OTUs assembled at 97% similarity cut-off of the gut microbiota. HC: Haliotis corrugata, HF: Haliotis fulgens.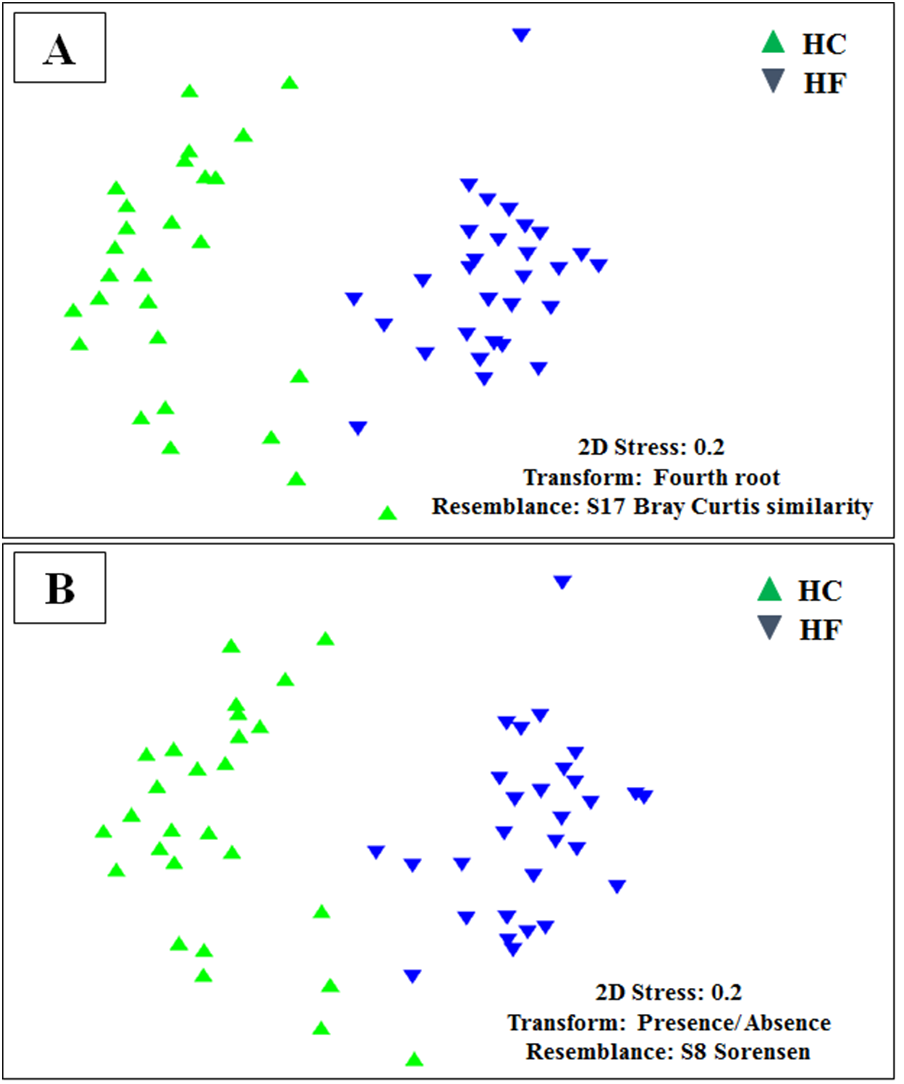
Jaccard distances revealed that interspecific relationships among OTUs changed by an order magnitude with most involving competition (HC: 23,588 and HF: 30,129), followed by neutral (HC: 1851 and HF: 1879) and a smaller number of mutualistic interactions (HC: 212 and HF: 123). Furthermore, the of the majority of OTUs decreased significantly with increasing read number in both species (p < 0.001; Fig. 4).
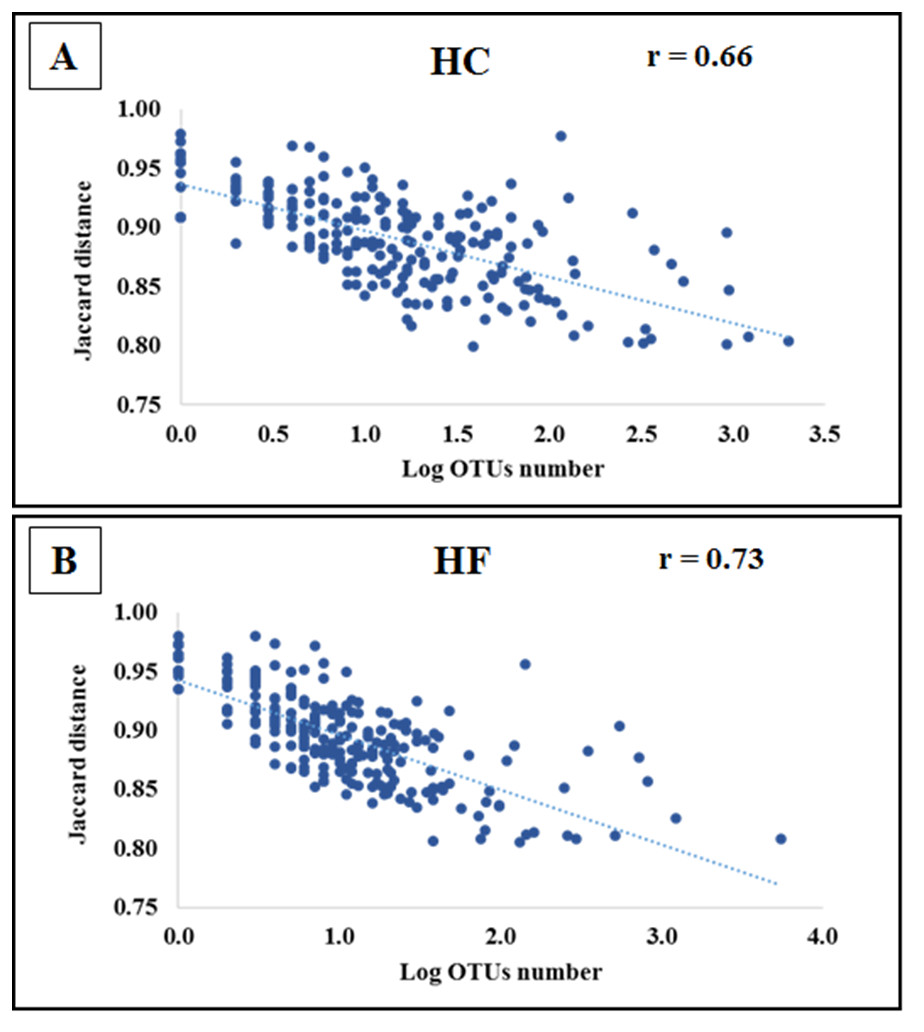
Figure 4: Bacterial species interactions as a function of their abundance.
Correlation of average Jaccard distance based on all pairwise relationships as a function of the number of reads (log scale) in microbiomes of (A) Haliotis corrugata and (B) Haliotis fulgens.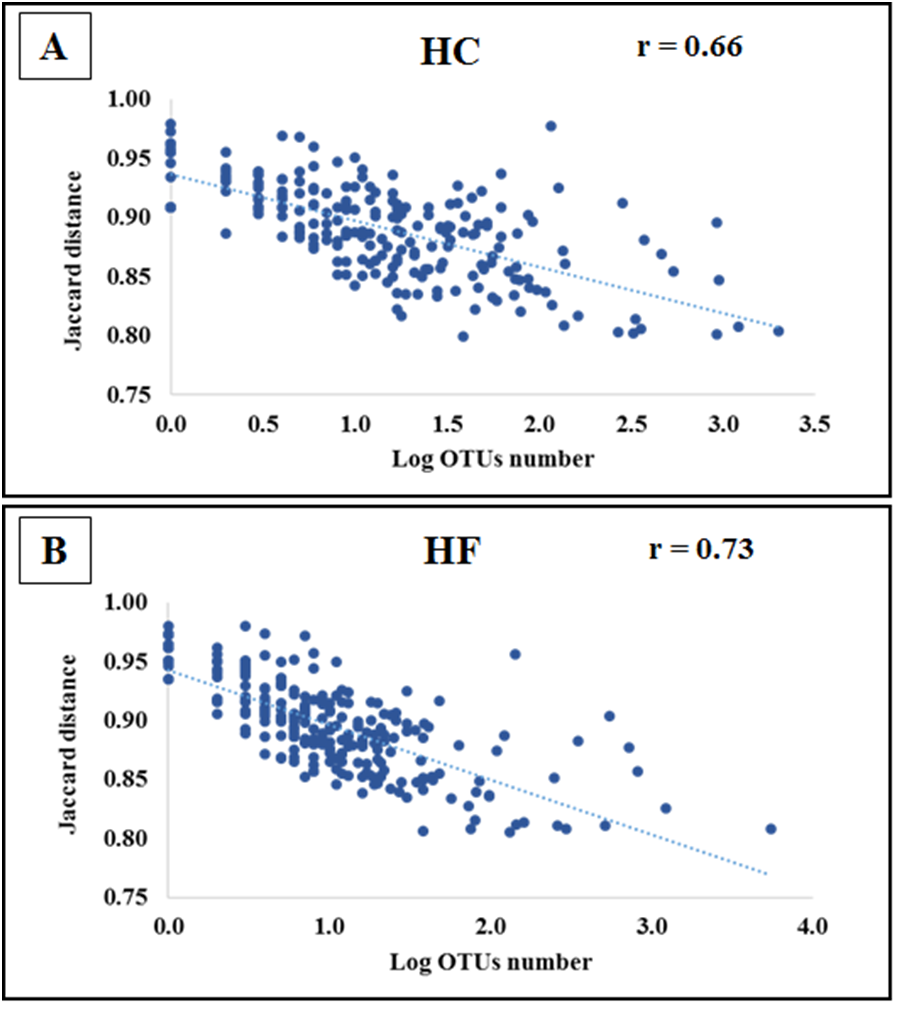
Our use of specific primers corroborated the presence of amplifiable DNA from gram-positive and gram-negative bacteria in the extracted DNA, hence we posit that the observed biased composition is not an artifact of the DNA extraction method (Fig. S6).
Functional profiling
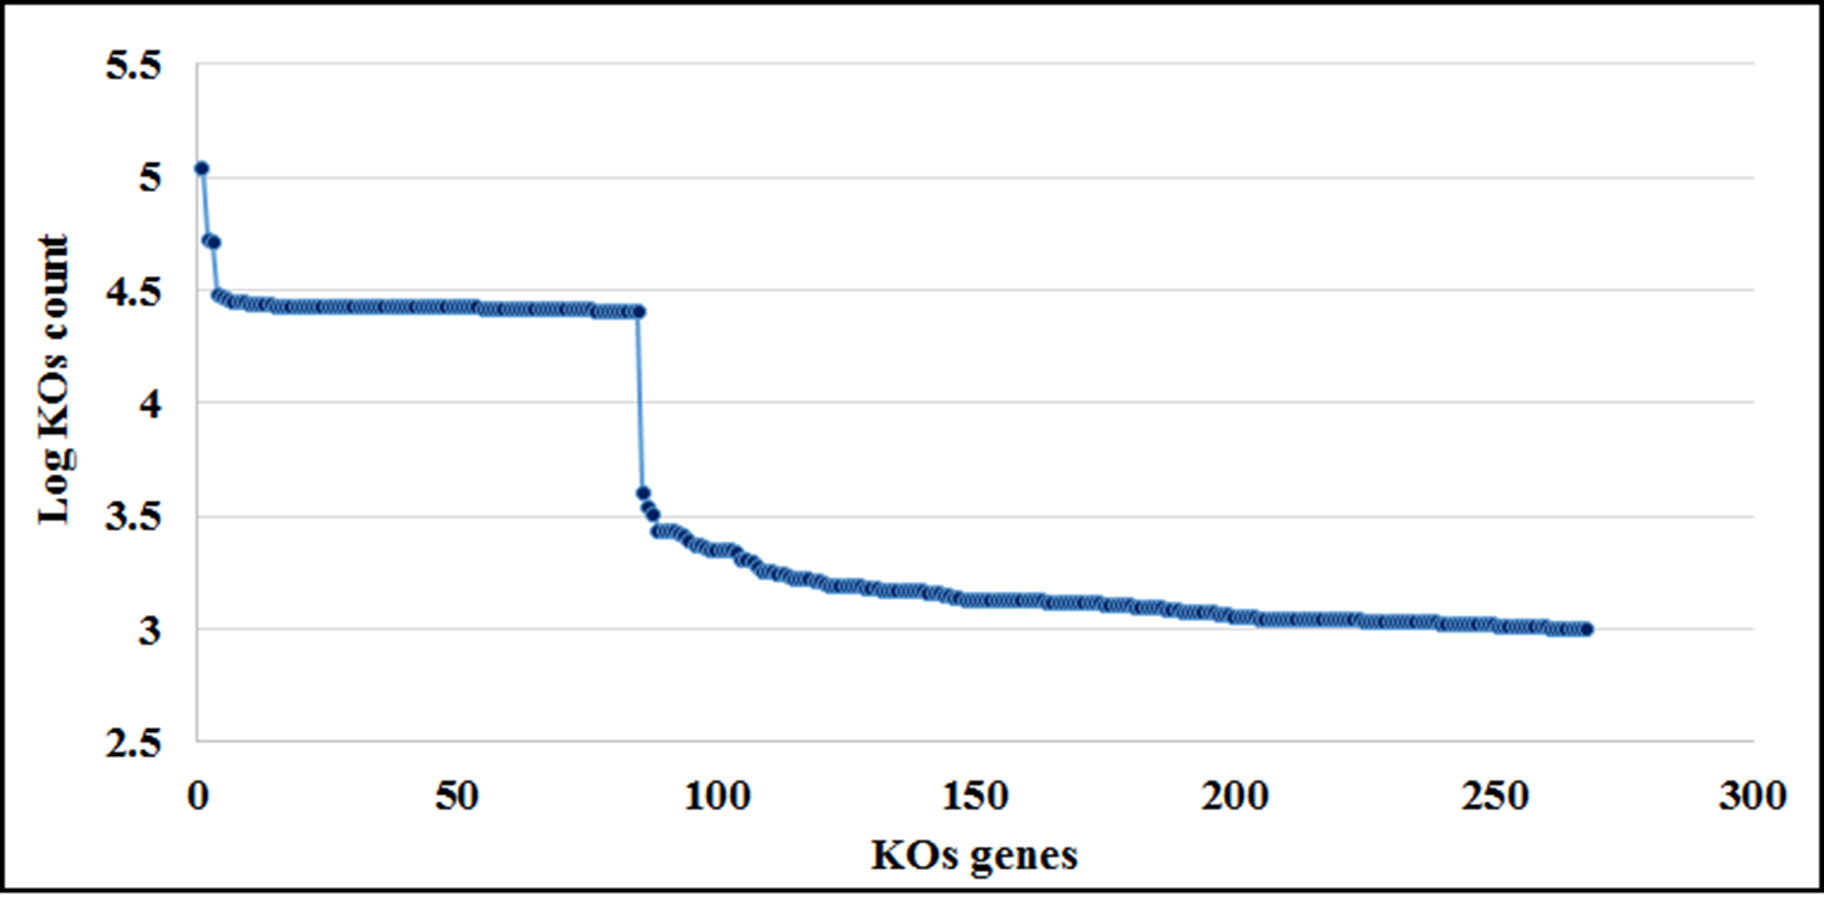
Greengenes database, allowed us to detect 248 OTUs, of which 81% (201) were shared with SILVA. Most abalone possessed mean NSTI (Nearest Sequenced Taxon Index) values from 0.07 to 0.17, except for seven HCs with larger values that suggested unreliable functional assignments; hence they were excluded from further analyses. PICRUSt identified 4,092 KOs genes (Table S5) involved in 261 metabolic functions (Table S6). An order of magnitude drop in log-transformed abundance was observed in the ranking of KOs (Fig. S7); hence, metagenome contributions analysis was carried out on a random set of 10 of the 86 most abundant KOs (i.e., Log (KOs counts) > 4). According to PICRUSt, the metabolic functions in the HF microbiomes were generally enriched by one primary OTU, whereas many more OTUs contributed to the same function in HC (Fig. 5). The contributions of bacterial OTUs to each KO differed significantly between species (χ2 > 47.74, p < 0.001; Fig. 5). Given their numerical predominance in the metabarcoding reads involved in functional profiling (76%), Mycoplasma occupied a major role in the taxonomic spectra of the KOs analyzed (72% in HC, 90% in HF).
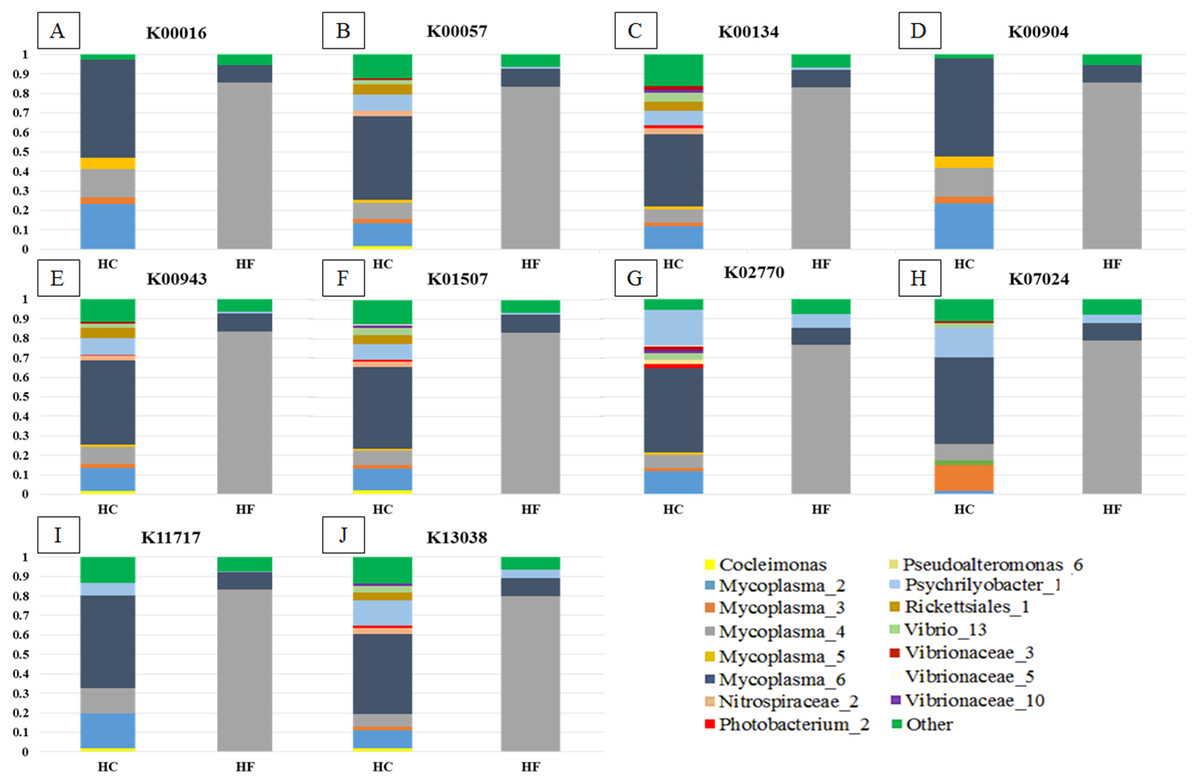
Figure 5: Taxonomic spectra of KEGG orthologs.
Bar plots of the contribution of bacterial OTUs (their taxonomic identification color coded in the legend) of ten of the predominant KOs (A to J) chosen at random from the GI microbiomes of Haliotis fulgens (HF) and H. corrugata (HC). Significant differences between species were found in all KOs ( χ2 > 47.74; p < 0.001).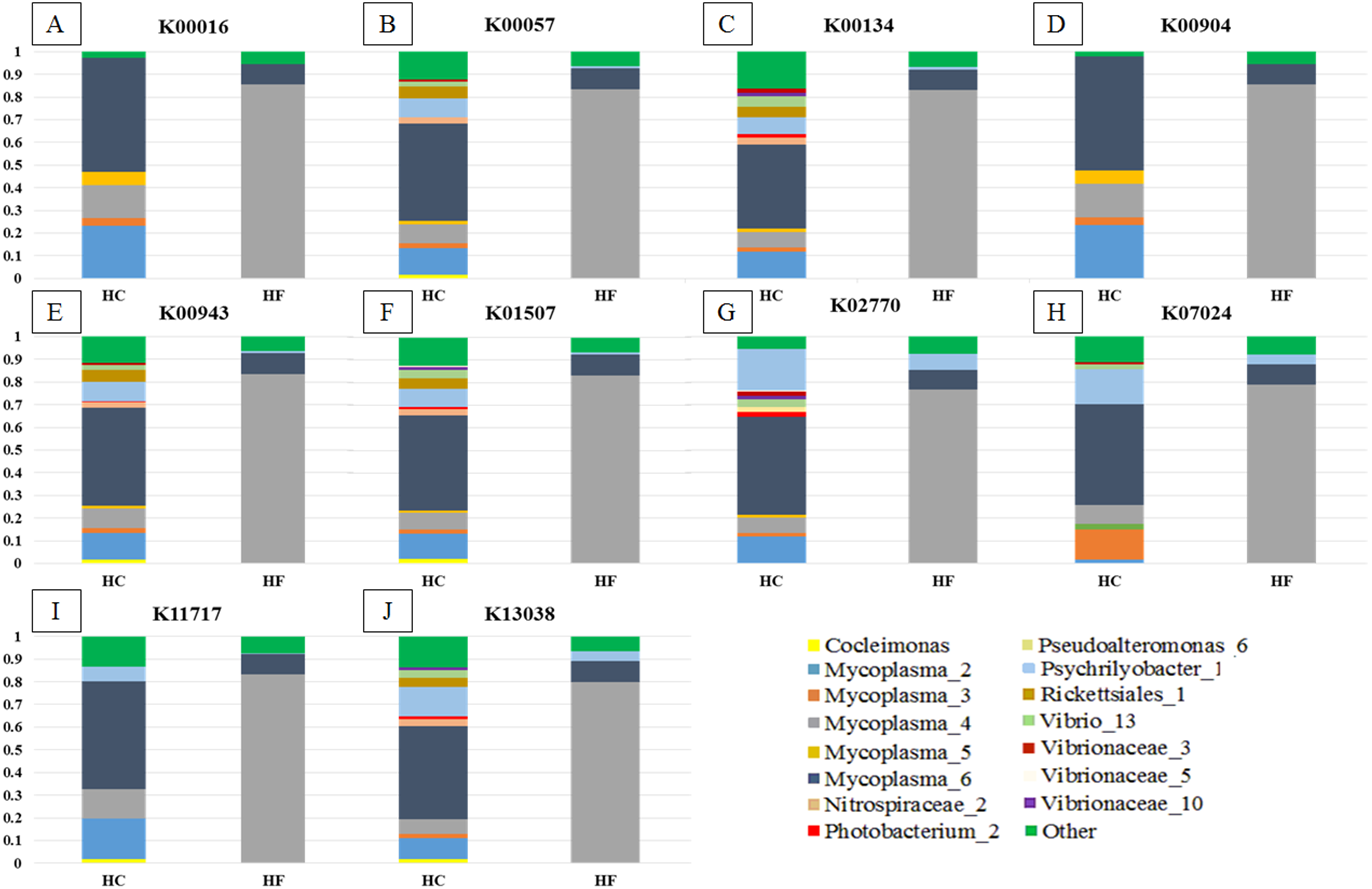
MDS analyses performed using both metabolic function counts (Table S5) or KOs counts (Table S6) revealed no clear functional distinction of the GI microbiota of both species. Nevertheless, the scatter of individual microbiomes is much larger in HC, which is consistent with its higher microbial diversity (Fig. 6).
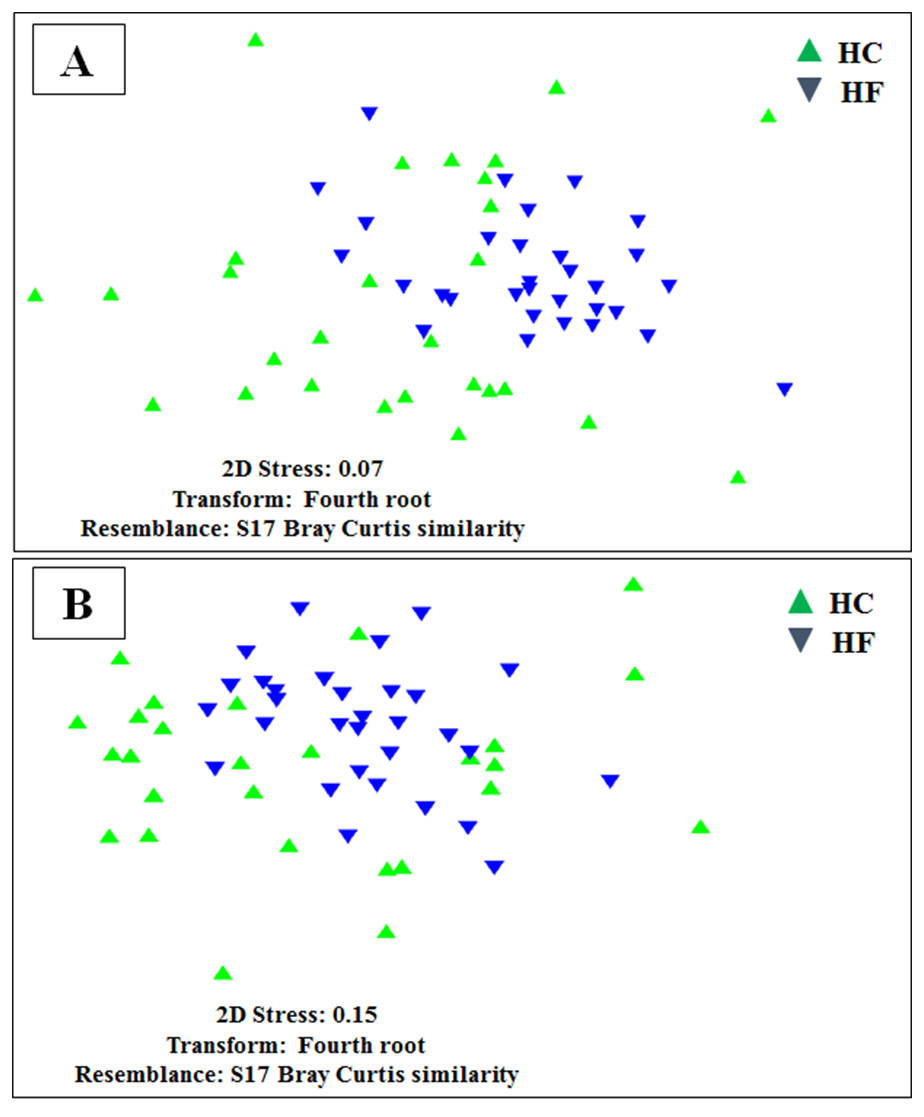
Figure 6: Individual microbiome functional variation.
Non-metric multidimensional scaling (MDS) based on Bray Curtis similarity index using fourth root transformed data of: (A) counts of predicted metabolic functions and (B) KEGG orthologue counts in the gut microbiomes of H. corrugata (HC) and Haliotis fulgens (HF).
Discussion
Abalone microbiome composition
Mollicutes, mostly represented by Mycoplasma spp., was by far the most abundant class, followed by Fusobacteria, Alphaproteobacteria and Gammaproteobacteria. These bacteria have also been found dominating in the GI microbiota of other abalone species (H. discus hannai, H. diversicolor and H. gigantean (Morales-Bojórquez, Muciño Díaz & Vélez-Barajas, 2008; Tanaka et al., 2003; Macery & Coyne, 2004; Rungrassamee et al., 2014)). Even though the taxonomic composition of HC and HF GI microbiotas bears resemblance at high taxonomic levels, the species level composition showed significant differences. Additionally, unweighted UniFrac suggests that observed differences may reflect microbial evolutionary adaptations to either HC or HF. In this context, several Mycoplasma species predominating in one species of abalone were either absent or at low abundance in the other (Table S4). Furthermore, all Vibrio spp. possessed a higher prevalence in HC. Following our interpretation, bacterial abundance may be controlled by interspecific competition. Indeed values, suggest that for most bacterial species their abundance increases with decreasing , as observed for Mycoplasma. Furthermore, for a single bacterium changed according to its host, which suggests that the same bacterial species faces different competitive pressures depending on the microbiota composition. In other words, bacteria that may survive competition in one microbiome, may be out competed in the other.
Some pathogenic bacteria, such as Candidatus Xenohaliotis californiensis were observed in the microbiomes of healthy abalone. This bacterium is a pleomorphic, gram-negative coccobacillus that inhabits abalone gastrointestinal epithelia and is considered an obligate endoparasite, like other Rickettsiales (Friedman, 2012; Friedman et al., 2000; Moore et al., 2002; Crosson et al., 2014). We observed the presence of Candidatus Xenohaliotis californiensis in healthy blue and yellow abalone, which supports that the presence of this pathogen is not sufficient to trigger withering syndrome, as previously suggested (Cáceres-Martínez, Vásquez-Yeomans & Flores-Saaib, 2011). Moreover, its absence and/or low intensity in abalone with morphological and histological signs of withering syndrome has already been reported (Cáceres-Martínez, Vásquez-Yeomans & Flores-Saaib, 2011; Balseiro et al., 2006; Horwitz, Mouton & Coyne, 2016). Accordingly, we posit that further investigations are needed to reveal all the factors involved in withering syndrome outbreaks.
Notably, Vibrio halioticoli was absent in both HF and HC whereas it has been found at a prevalence ranging from 40 to 65% in the GI of other marine invertebrates, including several abalone species (Cox, 1962). The discrepancy may in part be related to the anatomical source of the microbiomes, our samples come from post esophageal tissue only whereas other studies have analyzed the entire GI tract (Iehata et al., 2014; Tanaka et al., 2004). Consequently, the presence of V. halioticoli in the rest of GI tissues of HC and HF should be explored.
Given that our extraction method does not incorporate a bead-beating step, it may introduce a bias against gram-positive bacteria (Yuan et al., 2012; Gill et al., 2016). However, our gram-specific amplifications revealed that both groups are present in the DNA extracted from the post-esophagus of both species of abalone producing bands of comparable strength in agarose gel electrophoresis. This suggests a lack of bias introduced by the DNA extraction method; however, since endpoint PCR results are not quantitative, they are not conclusive on the extent to which the observed gram-negative bias in the pyrosequenced reads relates to the extraction method. This question requires further attention. Nevertheless, our main findings concern the differences between the sympatric abalone species and do not rely as much on the accuracy of the microbiome estimation, important as it is, but rather on the precision required to differentiate them. Our data proved to be robust in this regard.
Predicted functions of abalone microbiomes
According to the MDS of KOs gene counts and ecological functions, the inferred functionality of the GI microbiota of HF appears less variable than that of HC, which may reflect a higher degree of diet specialization. The diet diversity of wild HF in Baja California has been shown to be more limited and dominated by Phyllospadix torreyi (47%) and algae in the order Gelidiales (13%). On the other hand, the diet of sympatric wild HC is more diverse consisting of different species of Phaeophyceae (10–20%), Rhodophyta (20%) and Gelidiales (20%) among others (Guzman del Próo, Serviere-Zaragoza & Siqueiros-Beltrones, 2003). These ecological differences are related to their different bathymetric distribution; indeed, HC are generally found in deeper waters (between 10–20 m), whereas HF generally inhabit shallow subtidal regions of rocky shores (between 3–10 m) (Guzman del Próo, Serviere-Zaragoza & Siqueiros-Beltrones, 2003).
PICRUSt analysis, revealed that Mycoplasma contributed to all predicted KEGG in both HC and HF. Heretofore, Mycoplasma has been considered an obligate parasite and/or commensal due its small genome and limited number of genes (Bano et al., 2007). Nevertheless, according to recent genomic annotation analyses carried out in Mycoplasma strains isolated from deep-sea isopods, a mutualistic relationship has been proposed between Mycoplasma and their hosts (Wang et al., 2016). Indeed, the genome of studied Mycoplasma presented a high number of genes involved in degradation of glycans, proteins and complex oligosaccharides, which supports the hypothesis that Mycoplasma may supply their hosts with amino sugars and simple carbohydrates (Wang et al., 2016). Also, given the presence of sialic acid lyase genes, Mycoplasma likely protects their hosts against microbial pathogen infections, breaking down the sialic acid cell-wall “coat” used by a great variety of bacterial pathogens to avoid the host’s innate immune response (Wang et al., 2016; Severi, Hood & Thomas, 2007).
Our findings support a mutualistic association between Mycoplasma and their abalone hosts; indeed, Mycoplasma was the dominant linage in all explored KOs (Fig. 5) which suggests that these bacterial species may play a pivotal role in several metabolic functions. Moreover, a given KO was generally enriched by a single predominant Mycoplasma OTU in HF, whereas in HC it was generally enriched by two or more Mycoplasma as well as other bacterial-OTUs (Fig. 5). Accordingly, Mycoplasma species may be highly host-specific (Register et al., 2015), and they may bear some degree of specificity to particular metabolic functions and/or to specific steps along a metabolic route. Nevertheless, the functional structures of the GI microbiome of both species of abalone bear significant overlap.
Conclusion
Using bTEFAP we characterized the microbiota of two commercially important and sympatric abalone in Mexico. Our results revealed novel abalone microbiomes with significant shifts in bacterial species composition between them and with other species of abalone in the world. Given that these structural differences in microbiome composition do not necessarily result in distinct functional signatures, we posit that interspecific bacterial competition and the ecological differences of their host (i.e., diet and bathymetric distribution) may be responsible for these differences. These results may provide baseline references for future temporal and spatial sampling, and to assess microbiome changes related to ontogeny as well as physiological/health conditions. Additional efforts should also be directed towards understanding the roles of environment variables or other factors that may alter the GI microbiome of abalone.
Supplemental Information
Rarefaction analysis for standardization
Individual rarefaction curves of the number of observed OTUs against increasing number of individual reads; (A) from HC or yellow and (B) from HF or blue abalone.
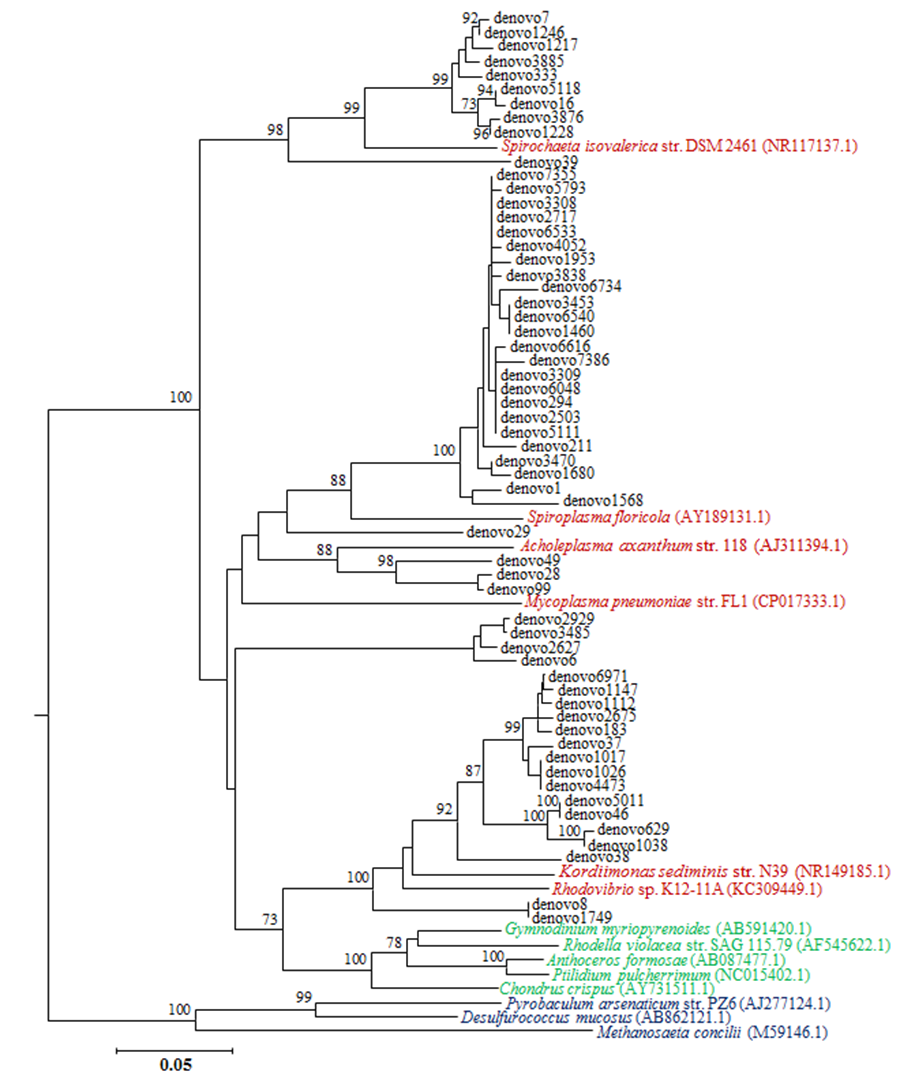
Unassigned OTUs phylogenetic position
Neighbor-joining tree showing the genetic relations between unassigned OTUs reported as “denovo” (in back) and other bona fide 16S rRNA sequences of (GenBank access number in parentheses): bacteria (reported in cardinal red), chloroplasts (reported in green) and Archean species (reported in blue). Numbers at the bifurcations represent bootstrap values calculated on 1,000 pseudo-replicates. Values <70% are not shown.
Individual microbiota community structure variation
Most abundant bacterial family composition of the post-esophageal microbiota of (A) H. corrugata (HC) and (B) Haliotis fulgens (HF).
Microbiome structural variation using both assigned and unassigned OTUs
Non-metricmultidimensional scaling (MDS) based on: (A) Bray Curtis similarity index using fourth root transformed read abundance and (B) Sorensen similarity index based on presence/absence. Both MDSs were obtained using assigned and unassigned OTUs assembled at 97% similarity cut-off of the gut microbiota. HC: Haliotis corrugata, HF: Haliotis fulgens.
Bacterial communities distance
Principal coordinate analysis (PCoA) based on unweighted UniFrac distance of bacterial communities harbored by Haliotis fulgens and Haliotis corrugata abalone, reported as blue and yellow circles respectively.
Gram negative and positive-specific amplification results
PCR amplification products of the 16S rRNA gene obtained with primers specific for gram positive or negative bacteria.
KOs spectral analysis
Ranking of the KO genes according to their count number (log scale) obtained with the script categorize by function in PICRUSt.
Sampling information for each analyzed abalone
Columns refer to fishing cooperative name; abalone species ID (HC for yellow abalone or Haliotis corrugata and, HF for blue abalone or Haliotis fulgens) followed by an internal numerical identifier; sampling date for each abalone reported as day/month/year; depth rage of capture (expressed in meters); cooperatives yield processing coordinate.
OTUs dissimilarity between HF and HC
Column abbreviations refers: avarage abundance in HC and HF for each bacterial species (colums C and D respectively), average dissimilarity (column E), dissimilarity percentage of contribution for each bacterial species (column F), cumulative percentage of dissimilarity (column G).
ID, taxonomy, and read number of each deteced OTUs
ID, taxonomy, and read number of OTUs in found yellow (HC) and blue (HF) abalone individuals.
Differing OTUs between HC and HF
OTUs showing differential abundances between yellow (HC, columns from A to D) and blue (HF, columns from F to I) abalone with statistical and biological significance obtained from LEfSe analyses. OTUs are ranked according to their effect size (Log LDA score).
Functional count number of KEGG
Count number in individual abalone and functional description of identified KEGG orthologs.
Count number of metabolic function
Count number of metabolic function genes in individual abalone.