
The mitochondrial genomes of two walnut pests, Gastrolina depressa depressa and G. depressa thoracica (Coleoptera: Chrysomelidae), and phylogenetic analyses
- Published
- Accepted
- Received
- Academic Editor
- Kenneth Storey
- Subject Areas
- Entomology, Genomics, Molecular Biology, Taxonomy
- Keywords
- Gastrolina depressa depressa, G. depressa thoracica, Chrysomeloidea, Mitochondrial genome, Phylogenetics
- Copyright
- © 2018 Wang and Tang
- Licence
- This is an open access article distributed under the terms of the Creative Commons Attribution License, which permits unrestricted use, distribution, reproduction and adaptation in any medium and for any purpose provided that it is properly attributed. For attribution, the original author(s), title, publication source (PeerJ) and either DOI or URL of the article must be cited.
- Cite this article
- 2018. The mitochondrial genomes of two walnut pests, Gastrolina depressa depressa and G. depressa thoracica (Coleoptera: Chrysomelidae), and phylogenetic analyses. PeerJ 6:e4919 https://doi.org/10.7717/peerj.4919
Abstract
In this study, the mitochondrial genomes (mitogenomes) of two walnut leaf insect pests, Gastrolina depressa depressa and G. depressa thoracica, were sequenced by Sanger sequencing technology. The mitogenome of G. depressa thoracica was complete at 16,109 bp in length, while the mitogenome of G. depressa depressa (14,277 bp) was partial. The genomic analyses indicated that both mitogenomes have the typical gene content and arrangement. The formerly identified elements, ‘TAGTA’ between trnSer(UCN) and nad2, and ‘ATGATAA’ between atp8 and atp6, were more conserved than that between nad4L and nad4, which was ‘ATGTTAA’ in Coleoptera excluding Polyphaga. Phylogenetic analyses of the 13 protein-coding genes from 36 coleopteran species well supported a close affinity between the subfamily Chrysomelinae including G. depressa thoracica and G. depressa depressa and Galerucinae, as well as a sister relationship of ((Eumolpinae + Cryptocephalinae) + Cassidinae) within Chrysomelidae.
Introduction
Both Gastrolina depressa thoracica and G. depressa depressa belong to Chrysomelinae (Coleoptera: Chrysomeloidea) and are the major insect pests of walnut in China. The larvae and adults feed on walnut leaves, and seriously influence walnut growth and yield. Compared with other species of Chrysomelinae in the boundary between Palaearctic and oriental regions, they have a typical flat back. Furthermore, G. depressa thoracica has a black prothorax, while G. depressa depressa has a yellow prothorax (Chen, 1974). Ge et al. (2003) comprehensively compared the morphological differences and the distributions of G. depressa thoracica and G. depressa depressa. Overall, in China G. depressa depressa are widely distributed in most areas south of the Yellow River, while G. depressa thoracica live in north of the Yangtze River. They both have filamentous antennae, and similar structure of the hind wing, claw and upper lip, but there are large differences in the structure of lower lip (cilia: long and dense in G. depressa thoracica, short and sparse in G. depressa depressa) and lower jaw (between the anterior chin and lower lip: triangle in G. depressa thoracica, circular soliton in G. depressa depressa). However, there is no information about their mitochondrial genomes (mitogenomes) or any other molecular data to support their classification.
Mitogenomes have been widely used as molecular markers for phylogenetics and phylogeographics because of maternal inheritance, conserved gene order and orientation, low recombination rate and high mutation rate (Avise, 1989; Crozier & Crozier, 1993; Jin et al., 2004). In general, the mitogenomes range from 14 to 36 kb in length, encoding 13 protein-coding genes (PCGs), 22 transfer RNA genes (tRNAs), 2 ribosomal RNA genes (rRNAs) and a large non-coding region (control region or A+T-rich region) (Wolstenholme, 1992; Boore, Lavrov & Brown, 1998). Recent advances in sequencing technology have enriched insect genome and mitogenome datasets and accelerated insect molecular studies. Insect genome and mitogenome data are now widely used in species identification, population genetics and molecular evolution (Ma et al., 2012; Timmermans, Lees & Simonsen, 2014).
Coleoptera has as many as 380,000 described species and an estimated total number of about three million members. Cucujiformia is one of the most highly diversified infraorders of Polyphaga (Crowson, 1960; ØDegaard, 2000; Bouchard et al., 2009) and includes six superfamilies, among which the superfamilies Curculionoidea and Chrysomeloidea are the major plant-feeding beetles (Grimaldi & Engel, 2005). Several studies have reported the phylogenetic relationships within Chrysomeloidea by using morphological data (Farrell & Sequeira, 2004; Gómez-Zurita et al., 2007), 18S rRNA (Hunt et al., 2007), 28S rDNA (Marvaldi et al., 2009), and partial mitochondrial genes (Bocak et al., 2014; Li et al., 2016).
In this study, we sequenced the mitochondrial genomes of G. depressa thoracica and G. depressa depressa and clarified their mitogenome differences. The nucleotide and amino acid sequences of the 13 PCGs of two walnut pest insects were then aligned with data of 34 other coleopteran species for the phylogenetic analyses.
Materials and Methods
Sample collection
Adults of G. depressa thoracica and G. depressa depressa were originally collected from the experimental station of Northwest A&F University, Shanyang County, Shaanxi Province, China (109°88′E, 33°53′N), and identified according to key morphological characteristics. All samples were stored in 100% ethanol at −20 °C.
DNA extraction and PCR amplification
Total genomic DNA was extracted from an individual insect using a standard phenol-chloroform extraction (Tamura & Aotsuka, 1988). The specific primers of each mitochondrial gene (Table 1) were designed from the conserved regions after multiple alignments of coleopteran insect mitochondrial sequences. PCR was performed with a 3-step program: an initial denaturation at 94 °C for 2 min; followed by 35 cycles at 94 °C for 30 s, annealing temperature (Table 1) for 30 s, 72 °C for 1–4 min; and a final extension at 72 °C for 10 min. PCR products (1.1–4.1 Kb in length) were analyzed by 1% agarose gel electrophoresis, and sequenced.
| Primer | Forward (5′ → 3′) | Reverse (5′ → 3′) | Tm(°C) | Length (kb) |
|---|---|---|---|---|
| G. depressa thoracica | ||||
| 01 | GCCTGAAATGAAAGGATAATTTTGATA | GCTCGGGTATCTACATCTATTC | 55 | 2.2 |
| 02 | GTTAATATAAACTCTTAACCTTCAA | CCGCAAATCTCAGAGCATTG | 49 | 2.3 |
| 03 | ACAATTGGACATCAATGATACTG | ATGACCAGCAATTATATTAG | 51 | 1.1 |
| 04 | TTAGCACATTTAGTTCCACAAGG | TATAATTAGAGCATAATTTTGAAG | 50 | 1.9 |
| 05 | TTTAATTGAAACCAAATTAGAGG | TTTTTGTCGTAATGGTC | 50 | 4.1 |
| 06 | CGCTCAGGCTGATAGCCCCA | AATCGTACTCCGTTTGATTTTGC | 53 | 2.9 |
| 07 | CGAGGTAATGTACCCCGAACCCA | GTGCCAGCAGTTGCGGTTATAC | 58 | 2.8 |
| 08 | ACCTTTATAATTGAGGTATGAAC | ATAATAGGGTATCTAATCCTAG | 51 | 2.0 |
| G. depressa depressa | ||||
| 01 | GCCTGATAAAAAGGATTATCTTGATA | TAAACTTCTGGGTGTCCAAAAAATCA | 52 | 2.0 |
| 02 | AATTGGGGGATTTGGAAATTG | CCACAAATTTCTGAACATTG | 49 | 2.0 |
| 03 | ACAATTGGACATCAATGATATTG | AGGGGCTTCTTTTTTCATAA | 47 | 2.3 |
| 04 | GCAGCTGCTTGATATTGACA | TTAGGATGGGATGGTTTGGG | 54 | 2.2 |
| 05 | TTTAATTGAAACCAAATAGAGG | GTTTGTGAGGGGGTTTTAGG | 55 | 3.4 |
| 06 | CCAGAAGAACAAATACCATG | TATCAATAGCAAATCCCCCCCA | 53 | 2.3 |
| 07 | TTCAGCAATATGAAATTTTGGATC | TTACCTTAGGGATAACAGCGTAA | 53 | 2.4 |
| 08 | CCGGTTTAAACTCAGATCATGTA | GTGCCAGCAGTTGCGGTTATAC | 57 | 1.8 |
Genome assembly and annotation
All sequences were blasted in NCBI (https://www.ncbi.nlm.nih.gov/) and assembled using the program SeqMan in DNAStar package v7.1 (DNAStar Inc., Madison, WI, USA). The 13 PCGs were identified using ORF Finder (available on NCBI) and the rRNAs were determined by comparison with other coleopteran mitogenomes. The tRNAs and their cloverleaf secondary structures were predicted using tRNAscan-SE Search Online Server (Lowe & Eddy, 1997), while undefined tRNAs were further compared with tRNAs of other species, including Atrijuglans hetaohei (Wang, Zhang & Tang, 2016), Dastarcus helophoroides (Zhang et al., 2015) and Anopheles minimus (Hua et al., 2016). The secondary structure of all tRNAs were drawn using RNAviz v2.0 (De Rijk, Wuyts & Wachter, 2003). The composition of nucleotide sequences was described by skewness according to the following formulas (Perna & Kocher, 1995): AT-skew = (A –T)/(A + T) and GC-skew = (G –C)/(G + C). The A+T content and relative synonymous codon usage (RSCU) were calculated using MEGA v5.1 (Tamura et al., 2011).
Phylogenetic analysis
The newly sequenced mitogenomes of G. depressa thoracica and G. depressa depressa were aligned with 32 mitochondrial genomes of Chrysomeloidea available in GenBank, with Tetraphalerus bruchi (Coleoptera: Archostemata: Ommatidae) and Abax parallelepipedus (Coleoptera: Adephaga: Carabidae) as outgroups (Table S1). The nucleotide and amino acid sequences of 13 PCGs from all 36 species were aligned separately using ClustalW implemented in MEGA v5.1 (Tamura et al., 2011). Gblocks v0.91b (Talavera & Castresana, 2007) was used to refine the final alignments and identify the conserved sequences (or conserved motifs). After Gblocks analysis, the final matrix consisted of 7,289 nucleotides and 2,340 amino acids. The best-fit models (TVM + I + G for the nucleotide dataset and MtREV + I + G + F for amino acid dataset) were selected using MrModeltest v2.3 (Nylander, 2004) and ProtTest v2.4 (Abascal, Zardoya & Plsada, 2005) with specific parameters (Table S2).
Phylogenetic trees of PCGs were constructed using maximum likelihood (ML) and Bayesian inference (BI); these two methods (ML and BI) have different algorithms in phylogenetic analyses. In ML analyses, phylogenetic trees of nucleotide and amino acid sequences were constructed by PhyML v3.0 (Guindon et al., 2010) based on the best-fit model (as above) with 1,000 replicates. For BI analysis, MrBayes v3.2.6 (Huelsenbeck & Ronquist, 2001) was used to compute the probability distribution and get a sharper and stronger prediction; four simultaneous Markov chains ran for 10 million generations and sampled every 1,000 generations before discarding the first 25% “burn-in” trees. Node support was assessed by the value of Bayesian posterior probabilities (BPP). The consensus trees were viewed and edited by Figtree v1.4.3 (Rambaut, 2009).
Results and Discussion
Gene content and nucleotide composition
The mitogenomes of G. depressa thoracica and G. depressa depressa were sequenced. The complete G. depressa thoracica mitogenome had 16, 109 bp, including 13 PCGs, 2 rRNAs and 22 tRNAs, and an A+T-rich region (Fig. 1, Table 2). In the mitogenome of G. depressa thoracica, there were four intergenic spacers (a total length of 23 bp), ranging from 1 bp to 17 bp, and the longest intergenic spacer was located between trnSer (AGN) and nad1. Furthermore, 15 pairs of genes overlapped each other, with a length ranging from 1 to 17 bp.
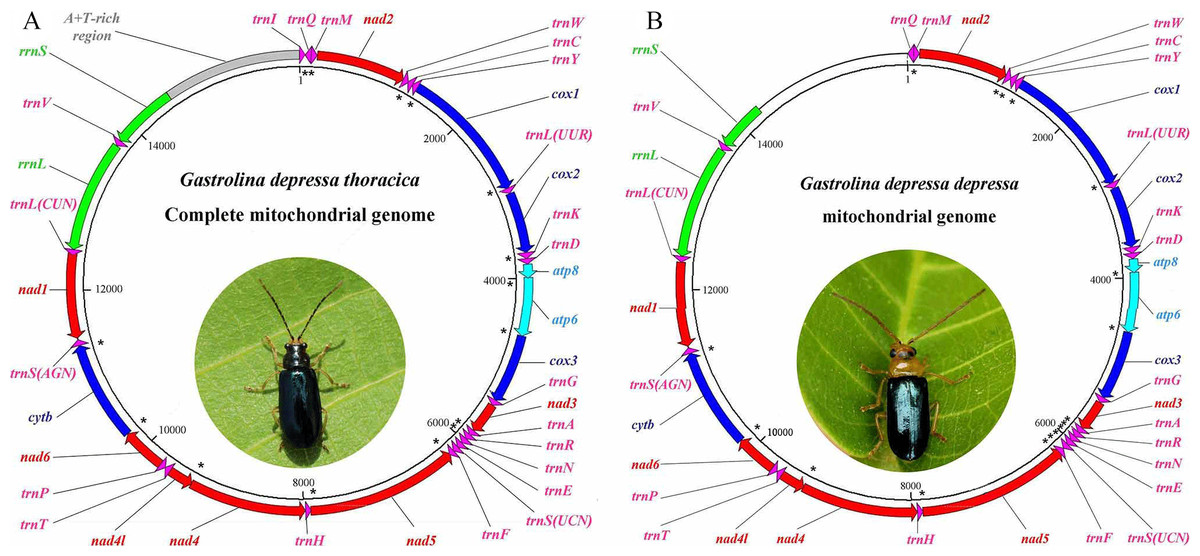
Figure 1: Gene maps of the complete mitochondrial genome for (A) G. depressa thoracica and the incomplete mitochondrial genome for (B) G. depressa depressa.
The PCGs and rRNAs are the standard abbreviations. Each tRNA is denoted as a one-letter symbol according to the IUPAC-IUB single-letter amino acid codes. Arrows indicate coding direction. The unmarked region, whole A+T-rich region, trnI and partial rrnS, are failed to be sequenced. Photos of the two insects were taken by Guanghui Tang.
| Gene | Position | IGS/bp | Initiation/Stop Codon | Anticodon | Coding Strand |
|||
|---|---|---|---|---|---|---|---|---|
| Gdt | Gdd | Gdt | Gdd | Gdt | Gdd | |||
| trnI | 1–65 | – | – | – | GAT | H | ||
| trnQ | 65–133 | 6–74 | −1 | – | TTG | L | ||
| trnM | 133–202 | 74–140 | −1 | −1 | CAT | H | ||
| nad2 | 203–1,209 | 141–1,154 | 0 | 0 | ATT/TA | ATT/TAA | H | |
| trnW | 1,210–1,273 | 1,153–1,216 | 0 | −2 | TCA | H | ||
| trnC | 1,266–1,327 | 1,209–1,272 | −8 | −8 | GCA | L | ||
| trnY | 1,328–1,391 | 1,273–1,339 | 0 | 0 | GTA | L | ||
| cox1 | 1,384–2,931 | 1,332–2,879 | −8 | −8 | ATT/TAA | ATT/TAA | H | |
| trnL(UUR) | 2,927–2,991 | 2,875–2,939 | −5 | −5 | TAA | H | ||
| cox2 | 2,992–3,679 | 2,940–3,627 | 0 | 0 | ATT/T | ATT/T | H | |
| trnK | 3,680–3,750 | 3,628–3,697 | 0 | 0 | TTT | H | ||
| trnD | 3,750–3,812 | 3,698–3,761 | −1 | 0 | GTC | H | ||
| atp8 | 3,813–3,968 | 3,762–3,917 | 0 | 0 | ATC/TAA | ATT/TAA | H | |
| atp6 | 3,962–4,636 | 3,911–4,585 | −7 | −7 | ATG/TAA | ATG/TAA | H | |
| cox3 | 4,636–5,419 | 4,585–5,371 | −1 | −1 | ATG/T | ATG/T | H | |
| trnG | 5,420–5,483 | 5,372–5,435 | 0 | 0 | TCC | H | ||
| nad3 | 5,484–5,835 | 5,436–5,787 | 0 | 0 | ATA/T | ATC/T | H | |
| trnA | 5,836–5,902 | 5,788–5,852 | 0 | 0 | TGC | H | ||
| trnR | 5,902–5,964 | 5,852–5,913 | −1 | −1 | TCG | H | ||
| trnN | 5,964–6,027 | 5,911–5,974 | −1 | −3 | GTT | H | ||
| trnS(UCN) | 6,028–6,094 | 5,971–6,034 | 0 | −4 | TCT | H | ||
| trnE | 6,095–6,157 | 6,033–6,095 | 0 | −2 | TTC | H | ||
| trnF | 6,158–6,220 | 6,094–6,159 | 0 | −2 | GAA | L | ||
| nad5 | 6,204–7,925 | 6,140–7,867 | −17 | −20 | ATT/TAA | ATT/TAA | L | |
| trnH | 7,923–7,984 | 7,865–7,928 | −2 | −3 | GTG | L | ||
| nad4 | 7,985–9,317 | 7,929–9,261 | 0 | 0 | ATG/T | ATG/T | L | |
| nad4l | 9,311–9,595 | 9,255–9,539 | −7 | −7 | ATG/TAA | ATG/TAA | L | |
| trnT | 9,599–9,660 | 9,543–9,606 | 3 | 3 | TGT | H | ||
| trnP | 9,661–9,723 | 9,607–9,670 | 0 | 0 | TGG | L | ||
| nad6 | 9,726–10,226 | 9,673–10,143 | 2 | 2 | ATA/TAA | ATT/TAA | H | |
| cob | 10,226–11,365 | 10,143–11,282 | −1 | −1 | ATG/TAG | ATG/TAG | H | |
| trnS(AGN) | 11,364–11,430 | 11,281–11,345 | −2 | −2 | TGA | H | ||
| nad1 | 11,448–12,398 | 11,363–12,313 | 17 | 17 | TTG/TAG | TTG/TAG | L | |
| trnL(CUN) | 12,400–12,464 | 12,315–12,379 | 1 | 1 | TAG | L | ||
| rrnL | 12,465–13,738 | 12,380–13,661 | 0 | 0 | L | |||
| trnV | 13,739–13,806 | 13,662–13,730 | 0 | 0 | TAC | L | ||
| rrnS | 13,807–14,551 | 13,731–14,281 | 0 | 0 | L | |||
| A+T-rich region | 14,552–16,109 | – | 0 | – | N.C. | |||
The sequenced mitogenome of G. depressa depressa was partial and 14,277 bp long, including 13 PCGs, 21 tRNAs, rrnL and partial rrnS (550 nucleotides from the 3′-end) (Fig. 1, Table 2). The A+T-rich region, trnI and partial rrnS (predicted to be about 200 nucleotides from the 5′-end) were failed to be sequenced although we have tried several pairs of species-specific primers. There were three intergenic spacers (23 bp), ranging from 1 bp to 17 bp, and the longest intergenic spacer was detected between trnSer (AGN) and nad1. Seventeen pairs of genes overlapped each other, with a length ranging from 1 to 20 bp.
Two 7-bp long overlaps (ATGATAA) were detected in both G. depressa depressa and G. depressa thoracica, which were also found in many other Polyphaga insects (Fig. 2). The overlaps were located between atp8 and atp6 on the H-strand and between nad4L and nad4 on the L-strand, respectively. The overlapped sequences were thought to be translated as a bicstron (Stewart & Beckenbach, 2005). Another 5 bp long motif (TAGTA) was detected between trnSer (UCN) and nad1 in mitogenomes of G. depressa depressa and G. depressa thoracica, which was also present in other coleopterans (Fig. 3). This consensus sequence has been proposed as the possible binding site of mtTERM because it is located at the end of the H-strand coding region in the circular mitogenome (Taanman, 1999). The sequenced motifs between atp8 and atp6, and between trnSer (UCN) and nad1 were relatively conserved in four suborders (41 Polyphaga, 24 Adephaga, two Archostemata and two Myxophaga) after mitogenomic comparisons. However, the motif ‘ATGATAA’ between nad4 and nad4L was only found in the mitogenomes of Polyphaga insects, while ‘ATGTTAA’ was identified in insect mitogenomes from the other three suborders, Adephaga, Archostemata and Myxophaga (Fig. S1).
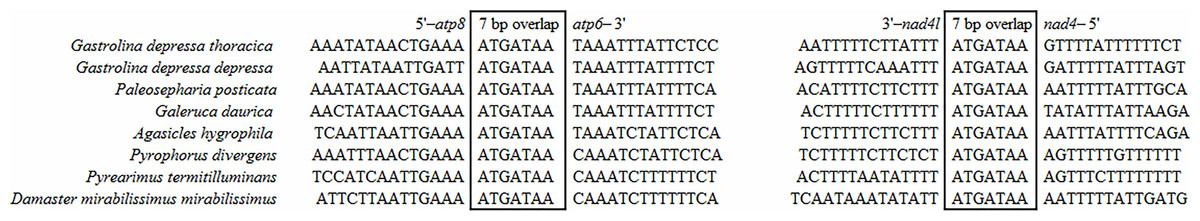
Figure 2: Sequence alignments of atp8/atp6 and nad4/nad4l of coleopteran insects.
The boxed nucleotides indicate the 7 bp conserved overlaps (ATGATAA).
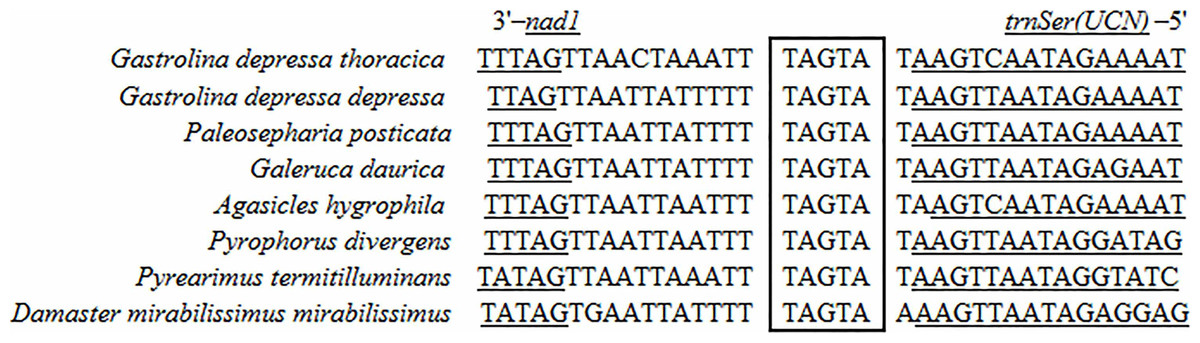
Figure 3: Sequence alignment of the space region between nad1 and trnS2 (UCN) of coleopteran species.
The boxed nucleotides indicate the ‘TAGTA’ conserved motif.
Protein-coding genes
In the mitogenomes of G. depressa thoracica and G. depressa depressa, a total of 3,731 and 3,678 amino acids were encoded by 11,182 bp and 11,026 bp nucleotides, respectively. All genes had the same orientations and organization. The 13 PCGs ranged from 156 bp (atp8) to 1,722 bp (nad5) for G. depressa thoracica and from 156 bp (atp8) to 1,728 bp (nad5) for G. depressa depressa (Table 2). Except for nad1 which used TTG as a start codon, all other PCGs had the typical ATN as the start codon. For example, nad2, cox1, cox2 and nad5 have ‘ATT’ as start codon, while the start codon ‘ATA’ was used for nad3 and nad6, ‘ATG’ for atp6, cox3, nad4, nad4L and cob, and ‘ATC’ for atp8 in G. depressa thoracica mitogenome. In G. depressa depressa mitogenome, start codon ‘ATT’ was used in six genes (nad2, cox1, cox2, atp8, nad5 and nad6), ‘ATG’ for atp6, cox3, nad4, nad4L and cob, and ‘ATC’ for nad3. The stop codons for the two mitogenomes were TAA, TAG and incomplete termination codons, like TA or T (Table 3). The incomplete stop codons could be completed as TAA through post-transcriptional polyadenylation (Ojala, Montoya & Attardi, 1981; Boore, 2004).
| G. depressa depressa | G. depressa thoracica | Paleosepharia postivata | Galeruca daurica | Agasicles hygrophila | |||||||||||
|---|---|---|---|---|---|---|---|---|---|---|---|---|---|---|---|
| A+T | AT skew | GC skew | A+T | AT skew | GC skew | A+T | AT skew | GC skew | A+T | AT skew | GC skew | A+T | AT skew | GC skew | |
| Protein-coding genes | 77.9 | −0.143 | 0.018 | 75.2 | −0.133 | −0.005 | 78.0 | −0.150 | 0.006 | 77.0 | −0.141 | −0.006 | 72.4 | −0.152 | −0.018 |
| First codon position | 73.3 | −0.040 | 0.225 | 71.3 | −0.010 | 0.194 | 72.3 | −0.050 | 0.227 | 72.4 | −0.025 | 0.188 | 68.9 | −0.021 | 0.153 |
| Second codon position | 69.7 | −0.384 | −0.117 | 69.2 | −0.387 | −0.125 | 68.6 | −0.391 | −0.141 | 68.7 | −0.394 | −0.112 | 68.4 | −0.395 | −0.117 |
| Third codon position | 90.6 | −0.040 | −0.135 | 85.2 | −0.03 | −0.153 | 93.2 | −0.049 | −0.211 | 90.1 | −0.042 | −0.210 | 80.0 | −0.058 | −0.128 |
| Protein-coding genes-H strand | 76.4 | −0.087 | −0.106 | 73.3 | −0.050 | −0.162 | 76.6 | −0.112 | −0.110 | 75.1 | −0.089 | −0.134 | 70.7 | −0.084 | −0.145 |
| First codon position | 70.8 | 0.057 | 0.132 | 68.4 | 0.112 | 0.079 | 69.7 | 0.032 | 0.140 | 69.5 | 0.064 | 0.098 | 66.7 | 0.079 | 0.071 |
| Second codon position | 68.0 | −0.361 | −0.221 | 66.8 | −0.364 | −0.209 | 67.2 | −0.361 | −0.217 | 67.2 | −0.368 | −0.202 | 67.3 | −0.70 | −0.203 |
| Third codon position | 90.2 | 0.005 | −0.470 | 84.8 | 0.066 | −0.562 | 92.8 | −0.041 | −0.681 | 88.5 | 0.001 | −0.557 | 78.1 | 0.025 | −0.388 |
| Protein-coding genes-L strand | 80.1 | −0.227 | 0.246 | 78.8 | −0.246 | 0.286 | 80.4 | −0.206 | 0.229 | 80.2 | −0.219 | 0.255 | 75.3 | −0.256 | 0.224 |
| First codon position | 77.0 | −0.167 | 0.410 | 76.1 | −0.149 | 0.417 | 76.5 | −0.170 | 0.405 | 77.0 | −0.153 | 0.380 | 72.5 | −0.168 | 0.311 |
| Second codon position | 72.1 | −0.431 | 0.053 | 71.6 | −0.433 | 0.044 | 70.8 | −0.437 | −0.005 | 71.1 | −0.443 | 0.051 | 70.1 | −0.434 | 0.035 |
| Third codon position | 91.2 | −0.116 | 0.429 | 88.7 | −0.177 | 0.617 | 93.8 | −0.062 | 0.659 | 92.6 | −0.110 | 0.657 | 83.1 | −0.183 | 0.414 |
The A+T content, AT-skew and GC-skew of G. depressa thoracica, G. depressa depressa and three other Chrysomelidae were calculated, respectively. All PCGs have a high A+T percentage (70%) (Table 3). This indicated that PCGs have the high background mutational pressure toward AT nucleotides at the third codon position ((Kim et al., 2014).
The relative synonymous codon usage (RSCU) showed that the most frequently used amino acids in these two mitogenomes were Leu, Ile, Phe and Met. TTA for Leu, ATT for Ile, TTT for Phe and ATA for Met were the most popular codons in G. depressa thoracica and G. depressa depressa mitogenomes (Figs. 4, 5). The sum of the most popular amino acids, like Leu, Ile, Phe and Met, varied from 38% (Agasicles hygrophila) to 42.23% (G. depressa depressa). All PCGs are rich with A or T nucleotides, which was also found in other coleopteran insects (Kim et al., 2009; Du et al., 2016).
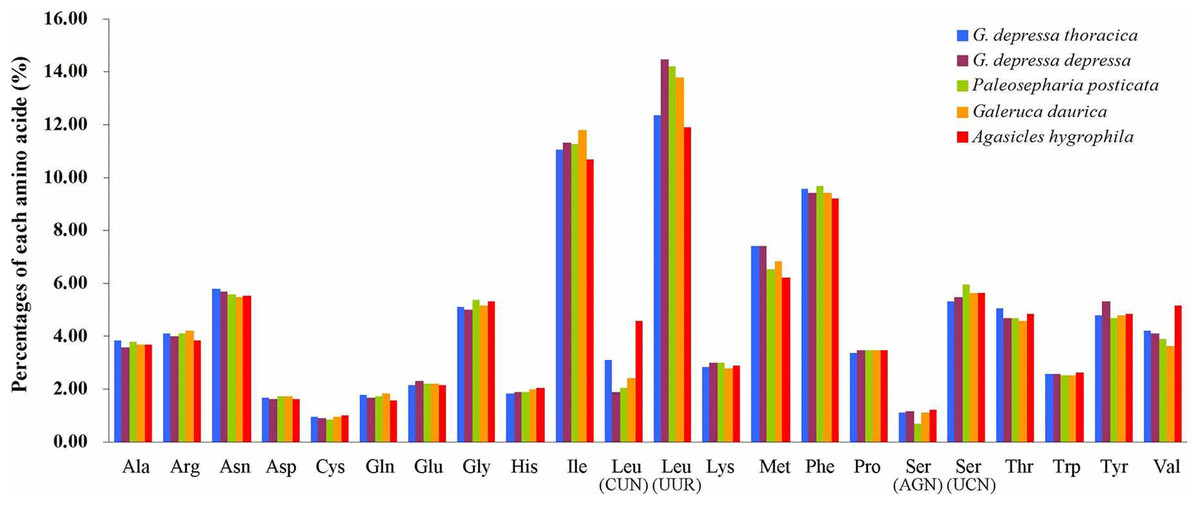
Figure 4: Percentages of amino acid usage in mitochondrial proteins of five species.
Each amino acid is represented by the three-letter abbreviation. Note that leucine and serine are each coded by two different genetic codons, and listed separately.
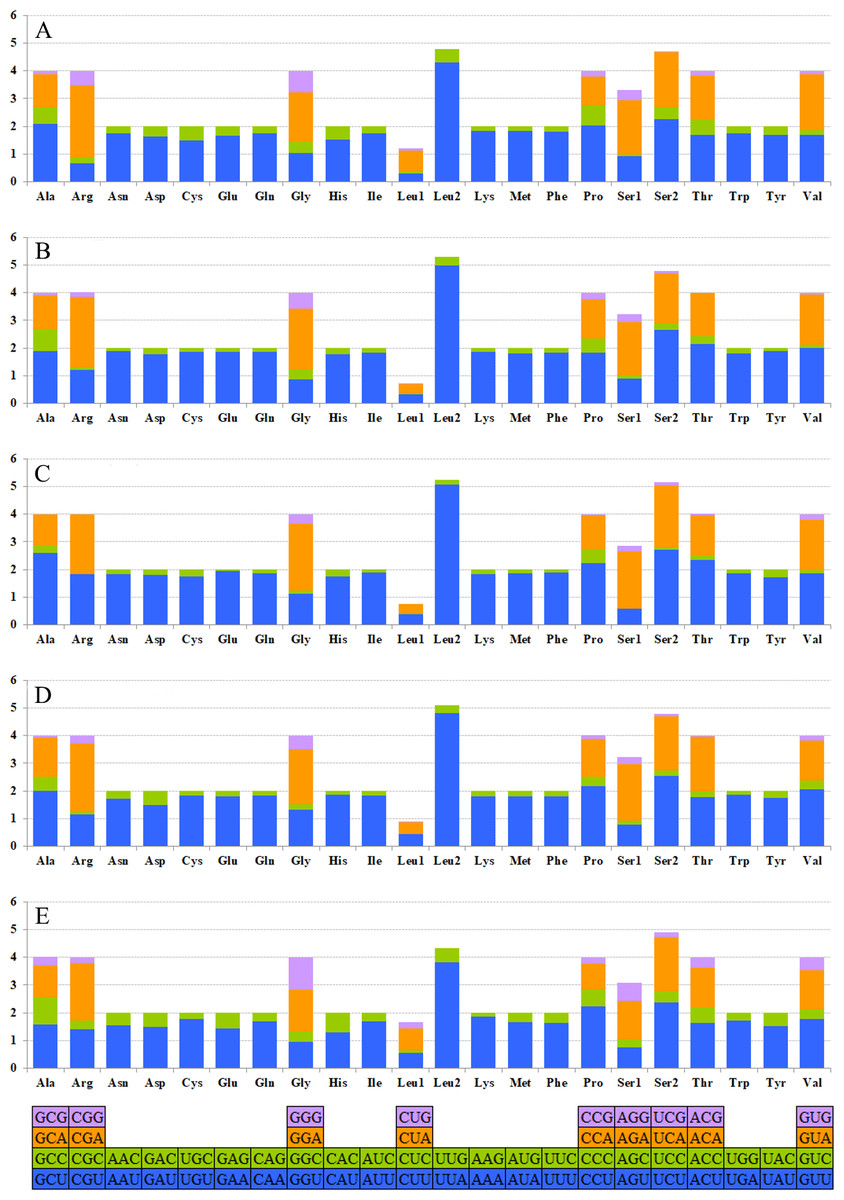
Figure 5: The mitogenome relative synonymous codon usage (RSCU) across five coleopteran insects.
(A) Gastrolina depressa thoracica. (B) G. depressa depressa. (C) Paleoseparia posticata. (D) Galeruca daurica. (E) Agasicles hygrophila. Codon families are provided on the x-axis.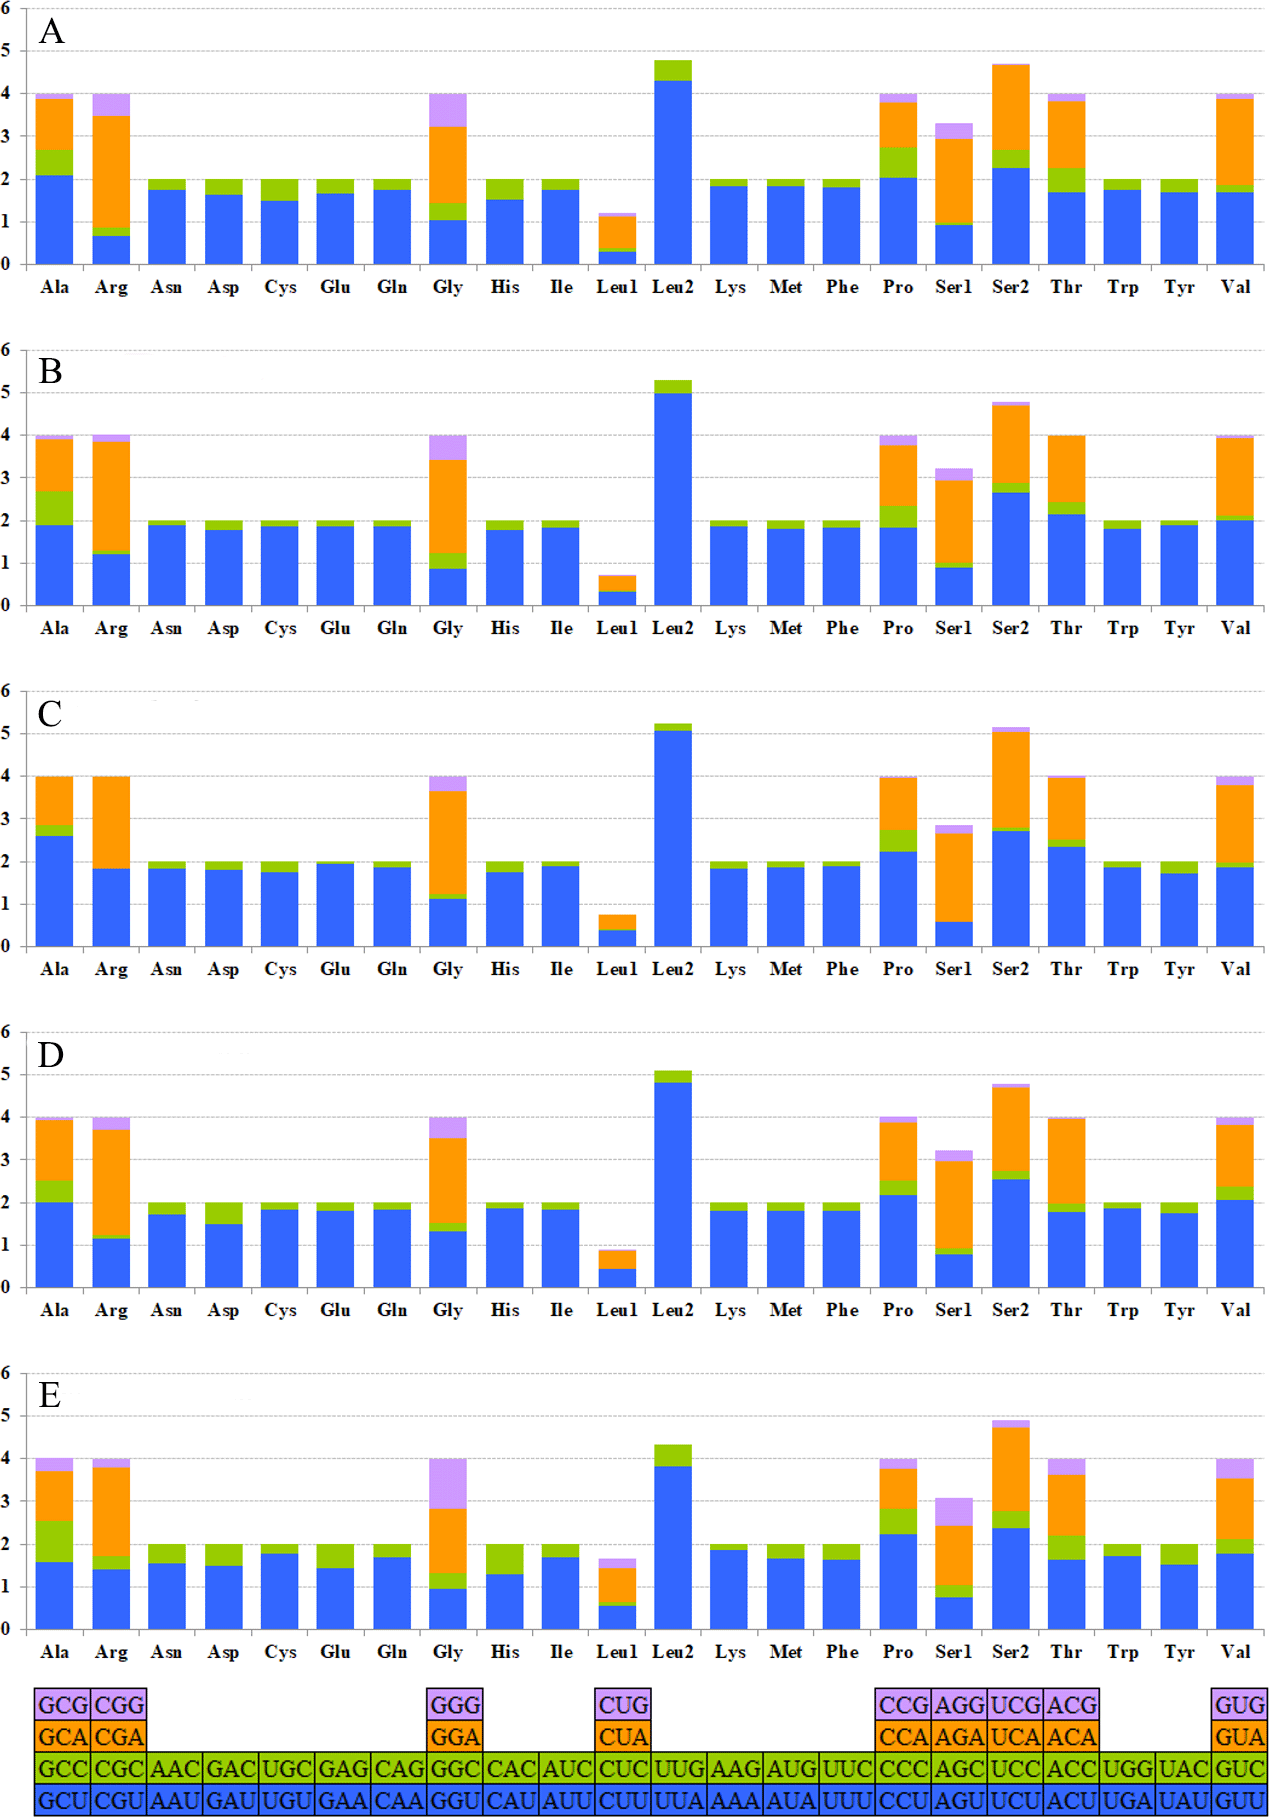
The codon families in PCGs were encoded by H and L strands (Fig. 6), respectively. The amino acid abundance of PCGs on H and L strands have different skewness, which led to an amino acid usage unbalance in PCGs. PCGs on the H-strand were more TA-skewed than CG-skewed, whereas the PCGs on the L-strand had a higher frequency of T and G, in which the first and second codons were skewed toward A nucleotide (Pons et al., 2010). Similarly, the third codon was also A/T biased (Fig. 6). Overall, this nucleotide preference lead to 13 PCGs having a higher percentage of Leu and a lower percentage of Cys. However, nad genes on the L-strand (nad1, nad5, nad4 and nad4L) encode more Cys (≥2) than any other genes on the H-strand (only 1–2) (Table S3). Four-fold degenerate codon usage was obviously A/T biased in the third position, and two-fold degenerate codon usage showed a similarly biased pattern, with A/T favored over G/C in the third position (Fig. 6). Both patterns were in agreement with the AT-biased content exhibited by PCGs. The most obvious bias of amino acid usage was due to structural/functional requirements of PCGs, which is well represented by the distribution of the Cys codon family. For example, mitochondrial nad genes have the highest Cys content, which are essential structures and help to form intra- and inter-chain disulfide (Mishmar et al., 2006).
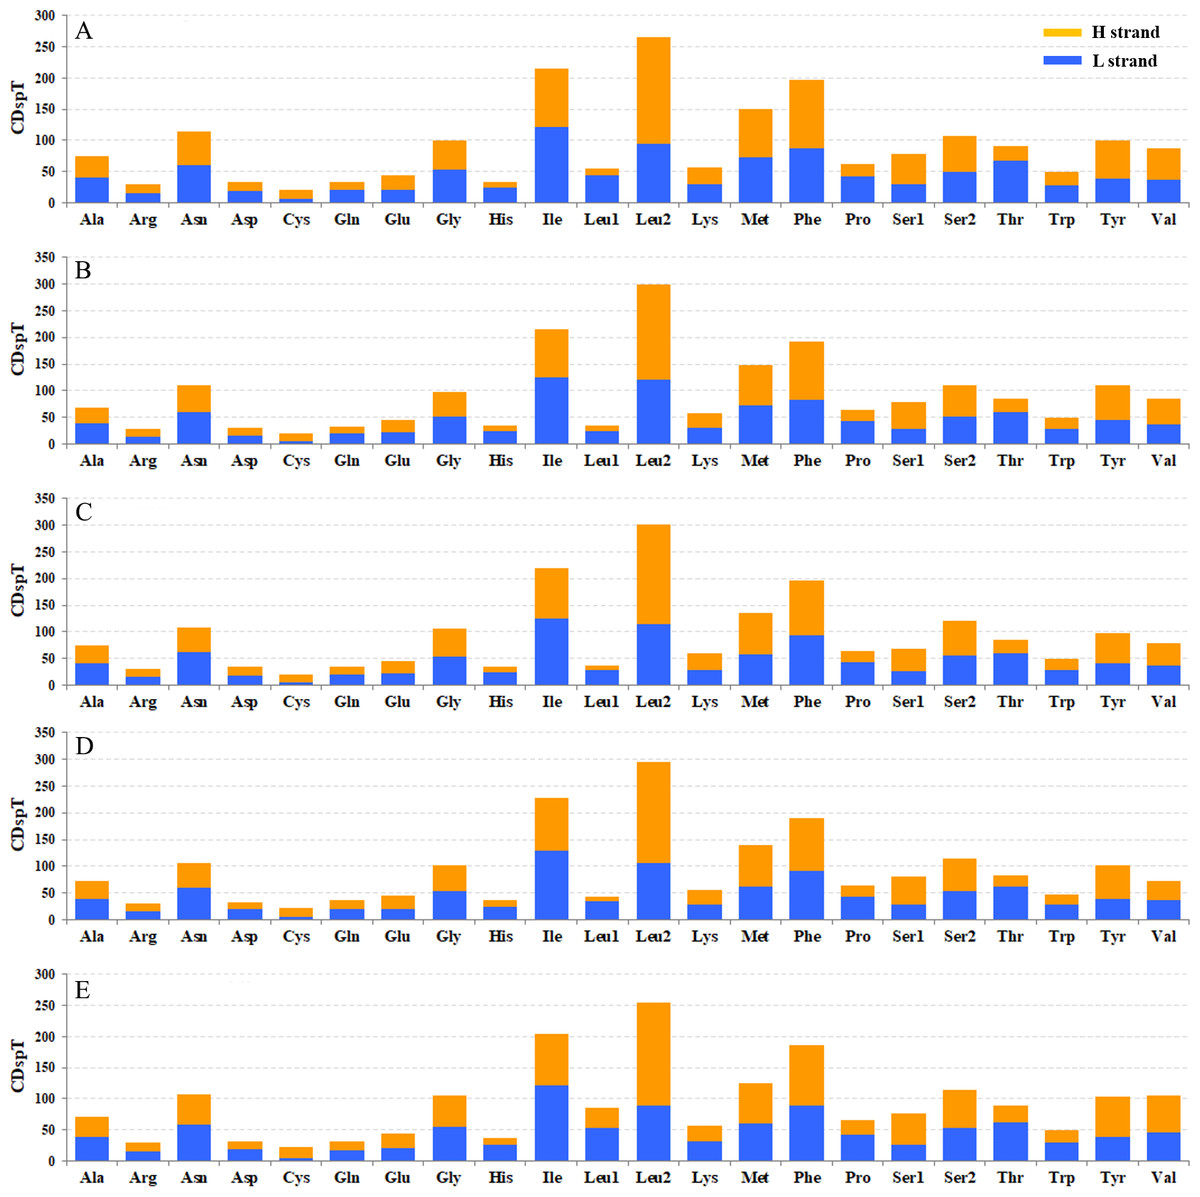
Figure 6: Codon distribution in five coleopteran insects. CDspT, codons per thousand codons.
(A) Gastrolina depressa thoracica. (B) G. depressa depressa. (C) Paleoseparia posticata. (D) Galeruca daurica. (E) Agasicles hygrophila. Codon families are provided on the x-axis. Within each family, the percentage of codons located on the H strand or L strand is colored with blue or orange, respectively.
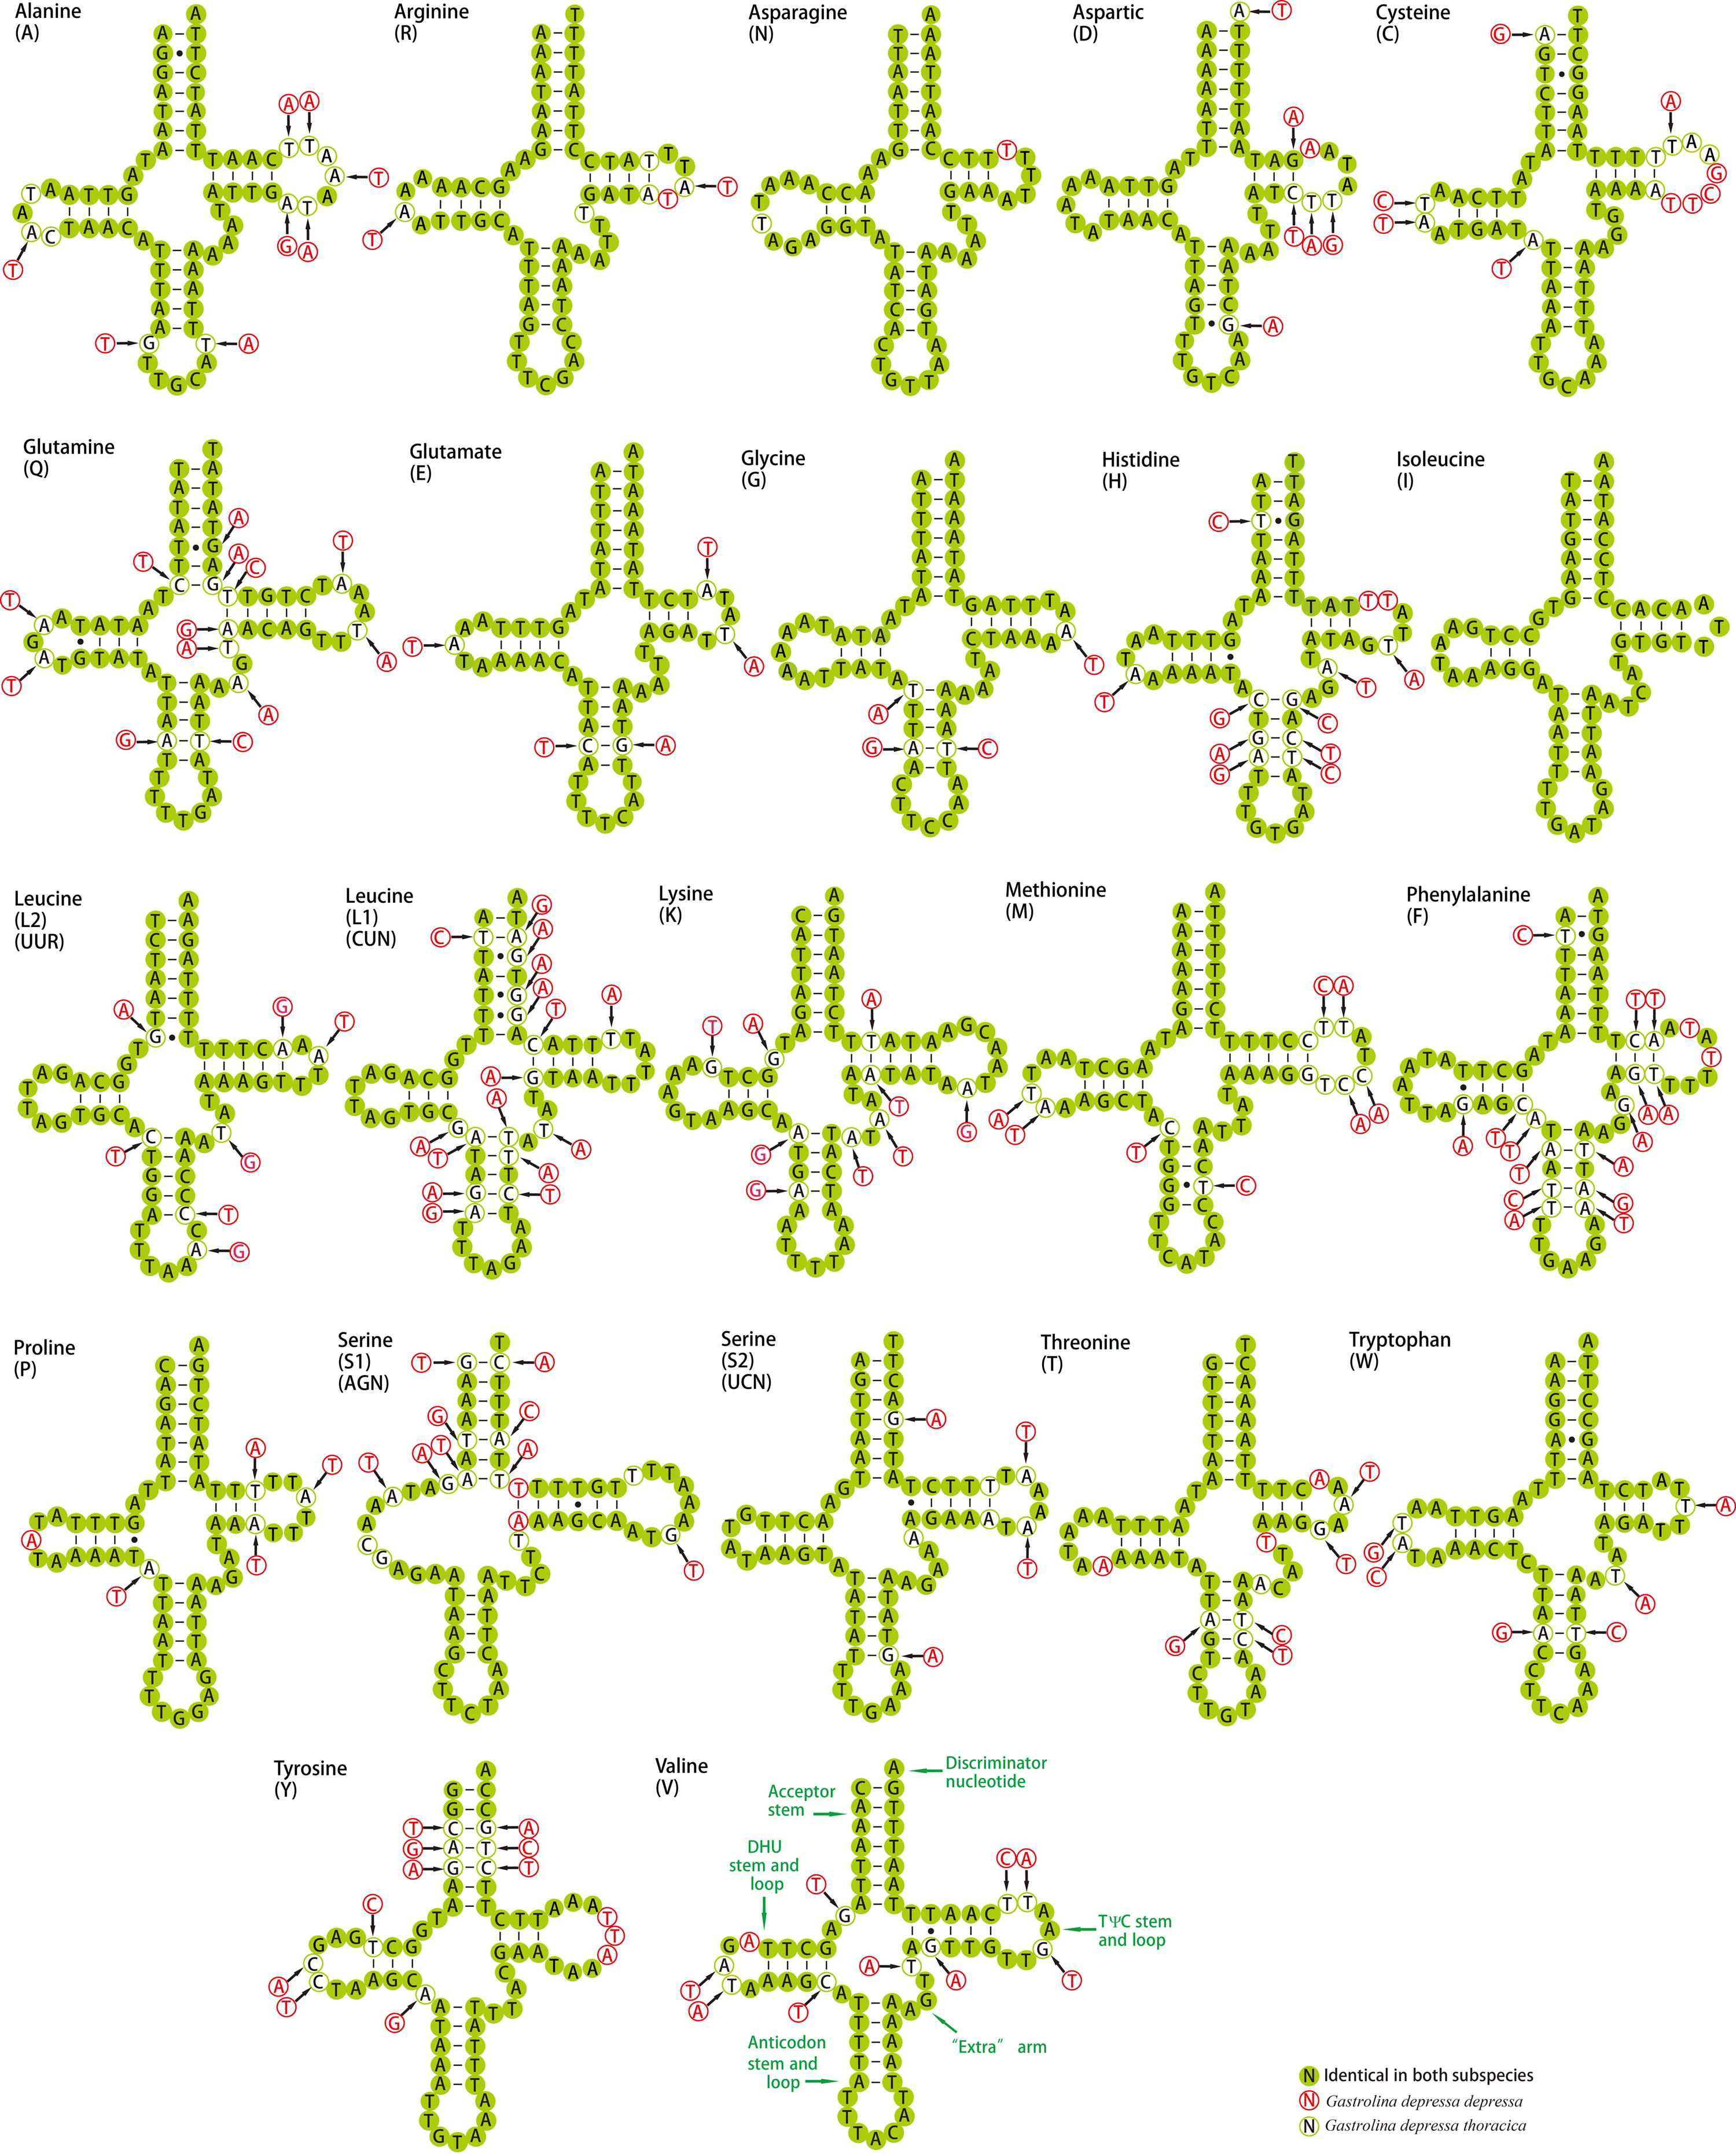
Transfer RNA genes
Twenty-two tRNAs were found in G. depressa thoracica and ranged from 62 bp to 71 bp in length with 14 tRNAs on the H-strand and eight on the L-strand. Except for trnSer (AGN), all tRNAs were folded into the typical clover-leaf structure (Fig. S2), containing an amino acid acceptor arm (7 bp), T Ψ C arm (3–5 bp), dihydorouridine (DHU) arm (3–4 bp), anticodon arm (3–5 bp) and a variable extra arm. In the mitogenome of G. depressa depressa, 21 tRNAs were identified (Fig. S2) and the length of these genes were between 62 bp to 70 bp, in which 13 and 8 tRNAs were encoded by the H-strand and L-strand, respectively. Twenty tRNAs had the typical clover-leaf structures, containing an amino acid acceptor arm (7 bp), T Ψ C arm (3–5 bp), DHU arm (3–5 bp), anticodon arm (3–5 bp) and a variable extra arm. However, trnSer (AGN) did not have the DHU arm, and formed a simple-loop structure, which is a common phenomenon in many insect mitogenomes (Wolstenholme, 1992).
In tRNAs, the typical DHU arm is encoded by 3–4 nucleotides; the AC arm and the T ΨC arm vary from 3–5 bp; and the variable loops range from 4–6 bp. In general, the size of the variable loop and the D-loop affects the length of the tRNA (Navajas et al., 2002). In the comparison of both mitochondrial genomes (Fig. S2), the major base pairs, A-T and G-C in stem regions are Watson-Crick pairs, while G-U wobble and mismatched pairs can also be observed. A total of 18 and 12 G-U wobbles were observed in the mitogenomes of G. depressa thoracica and G. depressa depressa, with 10, four, three, one and three, four, four, one base pairs in AA stem, D stem, AC stem and T stem of the tRNAs, respectively. In these wobbles, three were in the D stems of trnGln, trnPro and trnHis, and one was in the AA stem of trnCys. Except for trnIle, three (one AG in trnTrp, and two UU in trnLeu (UUR) and trnLeu (CUN)) and two (one AG in trnTrp and one UU in trnLeu (UUR)) mismatched base pairs were found in the tRNAs of G. depressa thoracica and G. depressa depressa mitogenomes, respectively. Among the six mismatched base pairs, four were located in the amino acid acceptor arms, and one UU pair was located in the anticodon arm of trnLeu (CUN). These mismatches, which are apparently deleterious, can be repaired and corrected by a putative RNA editing process (Masta & Boore, 2004). From protozoa to plants and metazoan animals, tRNA editing events have been observed in a variety of mitochondrial tRNAs (Laforest, Roewer & Lang, 1997; Alfonzo et al., 1999; Leigh & Lang, 2004; Grewe et al., 2009; Knoop, 2011).
The percentage of identical nucleotides (%INUC) for both insects was calculated (Table S4). TrnD, trnN, trnR, trnE, trnW, trnS (UCN) and trnP showed a higher %INUC (>90%) in both insects, and the first six were located on the H strand (Table 2). Only trnF and trnL (CUN) on the L-strand had a lower %INUC (<80%), indicating the level of conservation was positively H strand-biased.
Phylogenetic analyses
Phylogenetic trees were constructed based on 13 PCGs nucleotide sequences from 36 species (Fig. 7A) and their corresponding amino acid sequences (Fig. 7B) by maximum likelihood (ML) and Bayesian Inference (BI) analyses. Overall, BI analyses provided more resolution with strong supports. G. depressa thoracica and G. depressa depressa formed one clade (BPP/BS = 1/100), and had a closer relationship with species from Galerucinae than G. intermedia from Chrysomelinae.
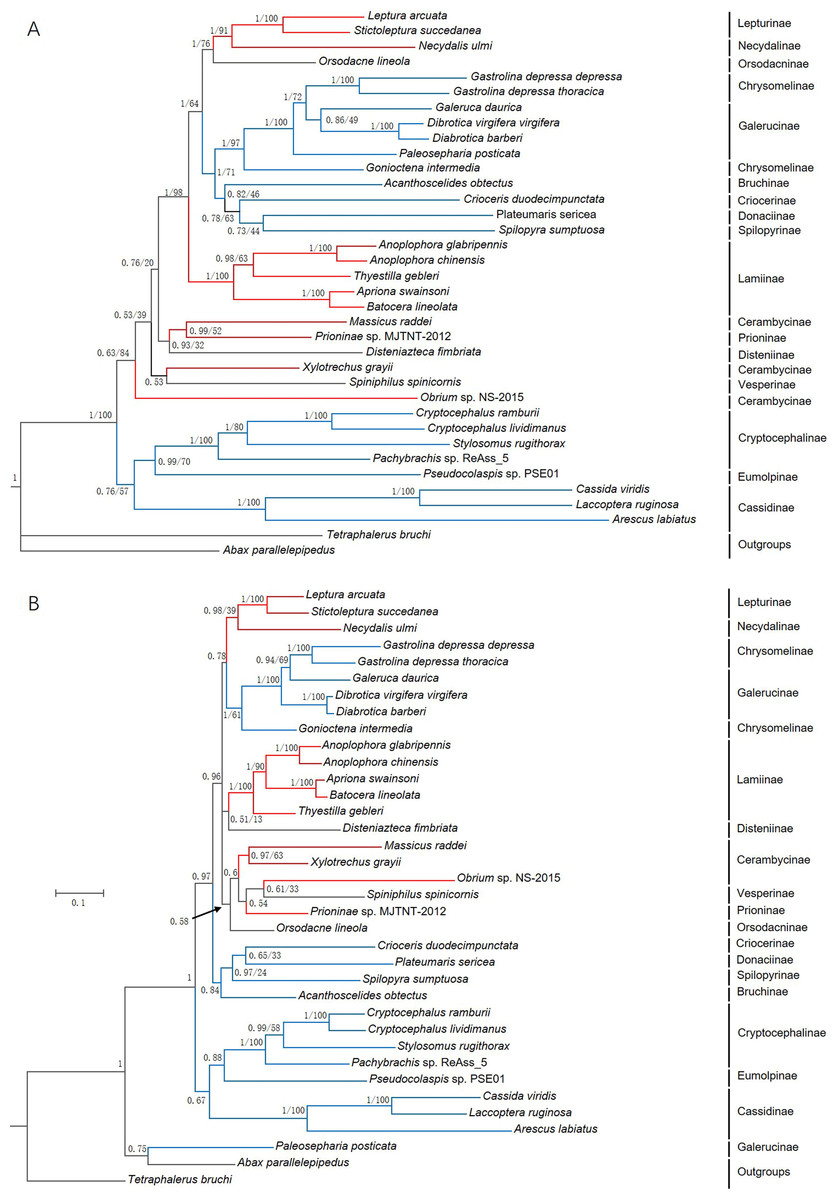
Figure 7: Phylogenetic trees based on (A) the nucleotide and (B) the amino acid datasets for 13 protein-coding genes from the mitochondrial genomes of 36 species.
All the probability values and bootstrap values of the branches were indicated, except for those where the topology of ML and BI was different from different datasets.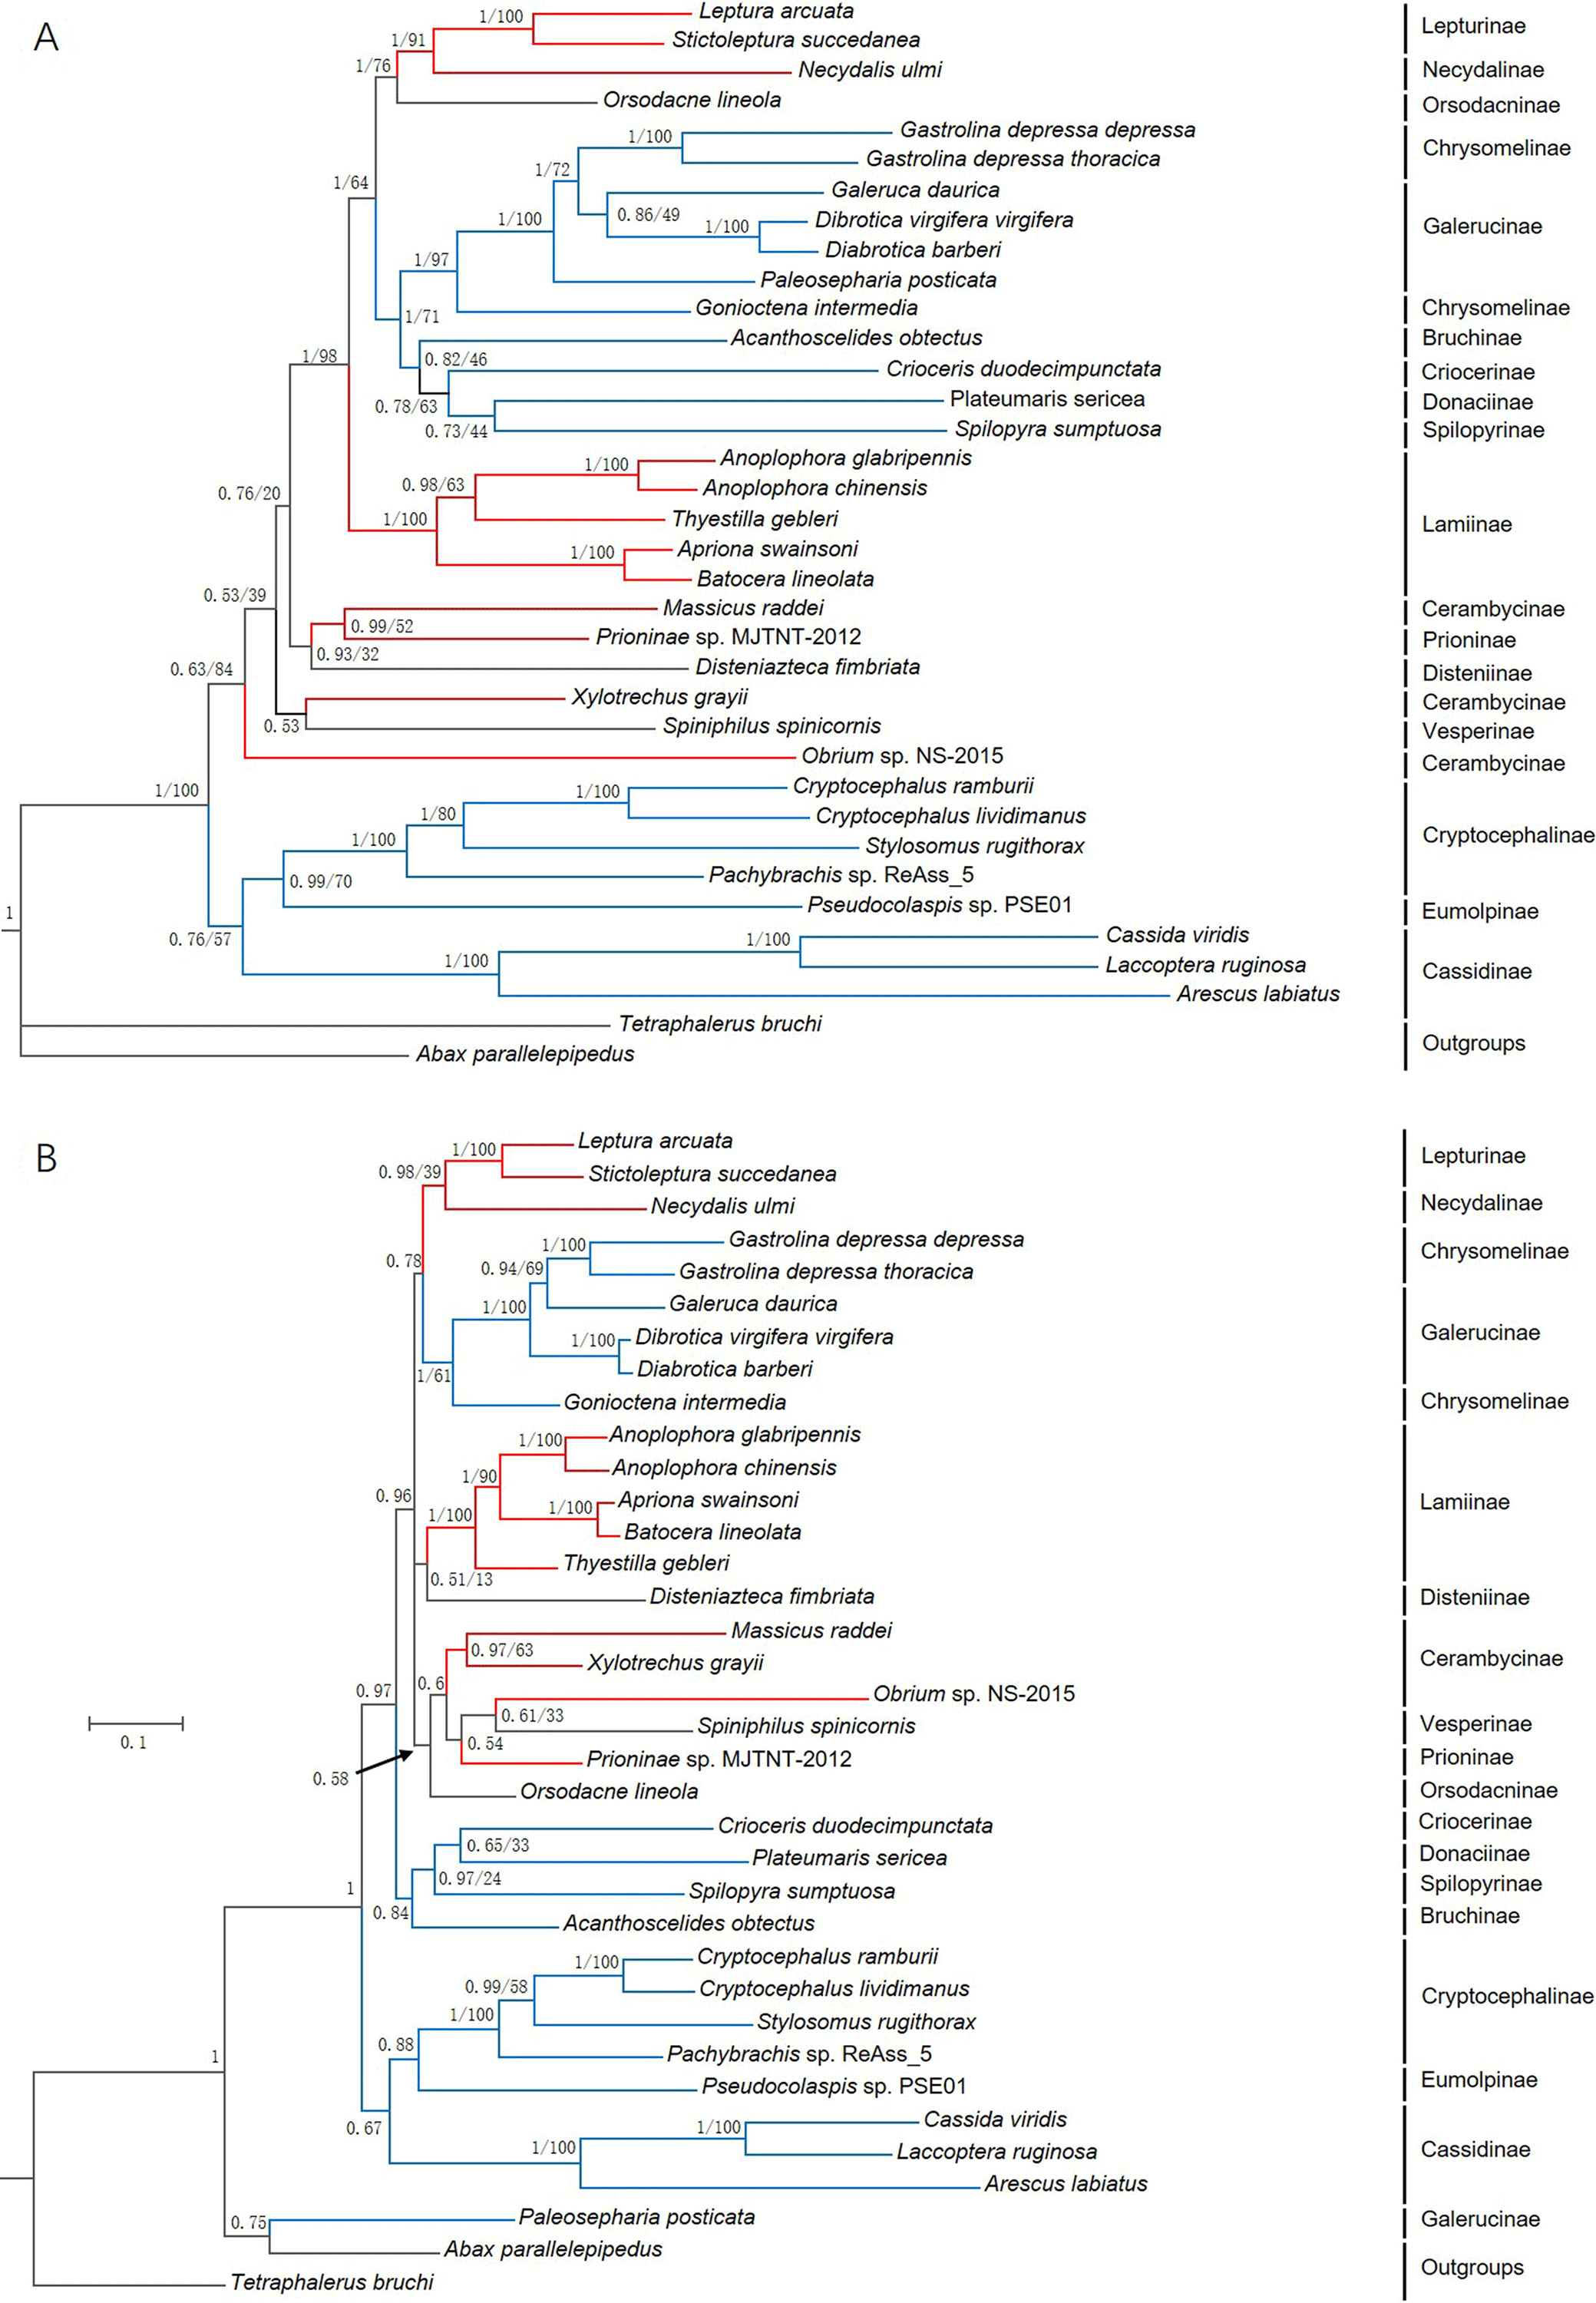
The family Chrysomelidae was divided into three major clades in both nucleotide and amino acid sequence trees using ML and BI analyses (Fig. 7). Chrysomelinae and Galerucinae consistently formed a clade, and the other four subfamilies, Bruchinae, Criocerinae, Donaciinae, and Spilopyrinae, were clustered in a clade. The phylogenetic analyses in this study were also well supported by previous analyses (Farrell, 1998; Reid, 2000; Farrell & Sequeira, 2004; Gómez-Zurita et al., 2007; Bocak et al., 2014; Song et al., 2017), in which the clade of Eumolpinae + Cryptocephalinae + Cassidinae were close to Galerucinae and Chrysomelinae, with the latter observed in all the phylogenetic trees.
In the phylogenetic analyses of amino acid sequences, Orsodacninae had a closer relationship with the clade of Lepturinae + Necydalinae in the superfamily Cerambycidae. This implied that Orsodacninae might be evaluated outside Chrysomelidae (Haddad & Mckenna, 2016). Reid (1995) was also against placing Orsodacninae within the Cerambycidae based on mitochondrial nucleotide sequences analyses. The representative species from Lamiinae formed a clade in the four phylogenetic trees, while the interrelationships within Cerambycinae remained unclarified due to insufficient mitogenome and genome data from these insects. Certainly, as more mitogenomes and genomes of insect species are available in databases, phylogenetic analyses will be more reliable and convincing.
Conclusions
In this study, the complete mitogenome of G. depressa thoracica (16,109 bp) and the partial mitogenome of G. depressa depressa (14,277 bp) were sequenced and analyzed. In the mitogenomes of G. depressa thoracica and G. depressa depressa, the overall mitochondrial gene order and orientation were identical with some exceptions. The motifs, ‘TAGTA’ between trnSer (UCN) and nad2, and ‘ATGATAA’ between atp8 and atp6, were found to be more conserved than ‘ATGATAA’ between nad4 and nad4L in the mitogenomes of Polyphaga, which was ‘ATGTTAA’ in the Adephaga, Myxophaga and Archostemata. Phylogenetic analyses showed that G. depressa thoracica and G. depressa depressa consistently formed a clade. Within Chrysomeloidea, the sister relationships of ((Eumolpinae + Cryptocephalinae) + Cassidinae), and the close affinity of Galerucinae + Chrysomelinae were confirmed with high nodal supports. We believe that the mitogenomes of G. depressa thoracica and G. depressa depressa will be useful for further studies of molecular classification, and coleopteran mitogenome architecture and phylogenetics.
Supplemental Information
Sequence alignments of nad4/nad4L of coleopteran insects
The boxed nucleotides indicate the 7 bp conserved overlaps (ATGTTAA/ATGATAA). Purple, blue, yellow and red represented species in the Polyphaga, Adephaga, Archostemata and Myxophaga, respectively.
Inferred secondary structure of tRNAs in the G. depressa thoracica and G. depressa depressa mitogenome
The nucleotide substitution pattern of each tRNA was modeled using as reference the structure determined for G. depressa thoracica.
Species list, classification, and GenBank accession numbers of 36 species used for phylogenetic analyses in this study
The parameter settings of TVM+I+G and MtREV+I+G+F for the nucleotide and amino acid datasets were selected by ModelTest and ProtTest, respectively
Numbers of Cysencoded on 13 PCGs of G. depressa thorcica and G. depressa depressa mtDNAs
Genes encoded by H-Strand were in bold.