
Transcriptome sequencing and SNP detection in Phoebe chekiangensis
- Published
- Accepted
- Received
- Academic Editor
- Marion Röder
- Subject Areas
- Bioinformatics, Genomics, Molecular Biology, Plant Science
- Keywords
- Phoebe chekiangensis, SNP prediction, Next-generation sequencing, Sanger method, Software comparison
- Copyright
- © 2017 He et al.
- Licence
- This is an open access article distributed under the terms of the Creative Commons Attribution License, which permits unrestricted use, distribution, reproduction and adaptation in any medium and for any purpose provided that it is properly attributed. For attribution, the original author(s), title, publication source (PeerJ) and either DOI or URL of the article must be cited.
- Cite this article
- 2017. Transcriptome sequencing and SNP detection in Phoebe chekiangensis. PeerJ 5:e3193 https://doi.org/10.7717/peerj.3193
Abstract
Background
Phoebe chekiangensis is a rare tree species that is only distributed in south-eastern China. Although this species is famous for its excellent wood properties, it has not been extensively studied at the molecular level.
Results
Here, the transcriptome of P. chekiangensis was sequenced using next-generation sequencing technology, and 75,647 transcripts with 48,011 unigenes were assembled and annotated. In addition, 162,938 putative single nucleotide polymorphisms (SNPs) were predicted and 25 were further validated using the Sanger method.
Conclusion
The currently available SNP prediction software packages showed low levels of correspondence when compared. The transcriptome and SNPs will contribute to the exploration of P. chekiangensis genetic resources and the understanding of its molecular mechanisms.
Introduction
Phoebe chekiangensis, which belongs to Lauraceae, is a tree species with a high economic value worldwide that is mainly distributed in south-eastern China. P. chekiangensis is the major source of the well-known wood ‘Golden Phoebe’. This wood has a superb reputation for its high-quality properties, such as its strong resistance to decomposition and dense texture (Gao et al., 2016). In addition to being widely used as timber or furniture in the imperial palace over the centuries, P. chekiangensis is a suitable garden plant species because of its outstanding tree morphology. However, due to its narrow distribution and slow growth, limited research has been conducted on this species, including studies of its general genomic studies.
Single nucleotide polymorphisms (SNPs) are widely used as genetic markers in association studies to understand inter-individual differences because of their characteristics of high frequency and binary variation patterns (Collins, Brooks & Chakravarti, 1998). Compared with traditional technologies, next-generation sequencing (NGS) technologies are usually more suitable for SNP identification because of their high throughput, although many artifacts are caused by systemic or random error. Researches on SNP identification and association studies have been carried on in many species (Martin et al., 2008; Ratan et al., 2015); however, very few SNPs are available in tree species because of the limited transcriptomic and genomic resources. Additionally, more validation work on putative SNP predicted by software using molecular experimental methods are required.
Over the past few years, NGS technology has led to profound changes in genomic and genetic research, with faster sequencing rates and continually decreasing costs (Mardis, 2008). Among the currently available NGS sequencing platforms, Illumina Hiseq2000 is relatively more cost effective, and it has been widely applied in the deep sequencing of model and non-model species (De et al., 2013). Because the determination of expressed sequence tags (ESTs) is an effective method for understanding the molecular mechanisms underlying physiological and morphological traits, for the first time, we sequenced the transcriptome of P. chekiangensis using Illumina HiSeqTM 2000 platform. This will help better understand and protect this rare tree species, and may aid in revealing the genetic principles of P. chekiangensis.
Materials and Methods
Sample collection and preparation
Leaves from a mature P. chekiangensis tree were collected in Zhejiang Academy of Forestry. Then the leaves were quickly frozen in liquid nitrogen and stored at −80 °C until RNA extraction. RNA degradation and contamination was monitored on 1% agarose gels. RNA integrity was assessed using the RNA Nano 6000 Assay Kit of the Agilent Bioanalyzer 2100 system (Agilent Technologies, Palo Alto, CA, USA). RNA purity was determined using the NanoPhotometer® spectrophotometer (IMPLEN, Westlake Village, CA, USA). In addition, RNA concentration were measured using a Qubit® RNA Assay Kit in a Qubit® 2.0 Fluorometer (Life Technologies, Carlsbad, CA, USA).
Library preparation for transcriptome sequencing
In each sample, 3 µg RNA was used as input for the RNA sample preparations. NEBNext® Ultra™ RNA Library Prep Kit for Illumina® (New England Biolabs (NEB), Beverly, MA, USA) was used to generate the sequencing libraries following the manufacturers’ recommendations. Briefly, with using poly-T oligo-attached magnetic beads, mRNA was purified from total RNA. Fragmentation was then performed under elevated temperatures in NEB Next First Strand Synthesis Reaction Buffer (5×). First strand cDNA was synthesized using a random hexamer primer and M-MuLV Reverse Transcriptase (RNase H-), and second strand cDNA synthesis was subsequently performed using DNA Polymerase I and RNase H. Using exonuclease/polymerase activities, remaining overhangs were converted into blunt ends. NEB Next Adaptor with hairpin loop structures were ligated to prepare for hybridization after the adenylation of 3′ ends of DNA fragments. The library fragments were purified with AMPure XP system (Beckman Coulter, Beverly, MA, USA) in order to select cDNA fragments ranging from 150 bp to 200 bp. Afterwards, 3 µl USER Enzyme was used with size-selected, adaptor-ligated cDNA at 37 °C for 15 min followed by 5 min at 95 °C before PCR. The library quality was assessed on the Agilent Bioanalyzer 2100 system and PCR reaction was performed with Phusion High-Fidelity DNA polymerase, Universal PCR primers and Index (X) Primer. At last, PCR products were purified (AMPure XP system).
Clustering and sequencing
According to the manufacturers’ instructions, the clustering of the index-coded samples was performed on a cBot Cluster Generation System using TruSeq PE Cluster Kit v3-cBot-HS (Illumina). After cluster generation, the library preparations were sequenced on an Illumina Hiseq 2000 platform and paired-end reads were generated.
The raw data of fastq format was firstly processed through in-house perl scripts (File S4). After removing reads containing adapters (reads containing more than 5 adapter-polluted bases were regarded as adaptor-polluted reads and would be filtered out), reads containing poly-Ns accounting for more than 5% and low quality reads (reads with the number of low quality bases (phred quality <19) accounting for more than 15% of the total bases) from the raw data, clean data (clean reads) were subsequently obtained. At the same time, Q20, Q30, GC-content and sequence duplication levels of the clean data were calculated. All of the downstream analyses were based on clean data of high quality.
Before transcriptome assembly, we counted the clean reads number for each transcript form 5′ end to 3′ end, and obtained the reads distribution for overall transcripts. Transcriptome assembly was accomplished based on the left.fq and right.fq using Trinity (v2012-10-5) (Haas et al., 2013) with min_kmer_cov set to 2, and all other parameters were set as default accordingly.
Functional annotation of unigenes and quantification of gene expression levels
After assembly, the longest transcript was defined accordingly as a unigene. Then, the unigenes were annotated based on the following databases: NCBI non-redundant protein sequences; NCBI non-redundant nucleotide sequences; Pfam; Clusters of Orthologous Groups of proteins; KEGG Ortholog and GO. The coding sequences and amino acids were determined based on standard codon usage table. Unigenes which couldn’t be blasted to neither database were processed by ESTScan (Iseli, Jongeneel & Bucher, 1999).
Gene expression levels were estimated by RSEM (Li & Dewey, 2011) for each sample: 1. Clean data were mapped back onto the assembled transcriptome; 2. Readcount for each gene was obtained from the mapping results.
SNP calling and SSR prediction
SNP prediction was performed using the following workflow: the clean reads were firstly aligned with the transcripts that were assembled by Trinity, and then the duplicated reads and multi-mapped reads were filtered. Subsequently, the alignment results were sorted according to the transcripts’ locations. SOAPsnp (v1.03) was used for SNP calling based on the sorted data, and initial raw prediction results were obtained (Li et al., 2009b). After further filtering based on their quality values, sequencing depths and SNP separation distances, final SNP prediction results were acquired.
SSRs of the transcriptome were identified using MISA (http://pgrc.ipk-gatersleben.de/misa/misa.html), and primers for each SSR were designed using Primer3 (http://primer3.sourceforge.net/releases.php).
SNP validation
Leaves of 114 samples including 9 populations were first collected during November and December in 2011–2012 (Table 1). PCR reactions were performed using the following procedure: an initial denaturation for 5 min at 94 °C, 30 cycles of 30 s at 94 °C, 30 s at the locus-specific annealing temperature, and 40 s at 72 °C, followed by a final extension of 1 min at 72 °C. A typical 10 µl reaction contained 1 × buffer, 2.5 mM MgCl2, 0.2 mM of each dNTPs, 0.25 µM of each primer, 0.25 U of Taq DNA polymerase (Takara, Kusatsu, Shiga, Japan) and 25 ng genomic DNA.
| Sampling site | Population type | No. of individuals sampled | Longitude (E) | Latitude (N) | Altitude (m) |
|---|---|---|---|---|---|
| Xihu Lake, Hangzhou | Wild population | 30 | 120.06° | 30.12° | 135 |
| Yinzhou, Ningbo | Wild population | 8 | 121.47° | 29.47° | 280 |
| Lin’an | Population of ancient trees | 7 | 119.26° | 30.19° | 355 |
| Taishun | Wild population | 8 | 119.45° | 27.22° | 556 |
| Qixi, Kaihua | Population of ancient trees | 9 | 118.22° | 29.23° | 371 |
| Huabu, Kaihua | Wild population | 8 | 118.16° | 29.01° | 152 |
| Qingyuan | Wild population | 7 | 118.55° | 27.44° | 366 |
| Jiangshan | Wild population | 11 | 118.39° | 28.50° | 173 |
| Wuyuan | Population of ancient trees | 16 | 117.50° | 29.12° | 78 |
The electronic version of this article in Portable Document Format (PDF) will represent a published work according to the International Code of Nomenclature for algae, fungi, and plants (ICN), and hence the new names contained in the electronic version are effectively published under that Code from the electronic edition alone. In addition, new names contained in this work which have been issued with identifiers by IPNI will eventually be made available to the Global Names Index. The IPNI LSIDs can be resolved and the associated information viewed through any standard web browser by appending the LSID contained in this publication to the prefix “http://ipni.org/”. The online version of this work is archived and available from the following digital repositories: PeerJ, PubMed Central, and CLOCKSS.
Results and Discussion
Sequencing and assembly results
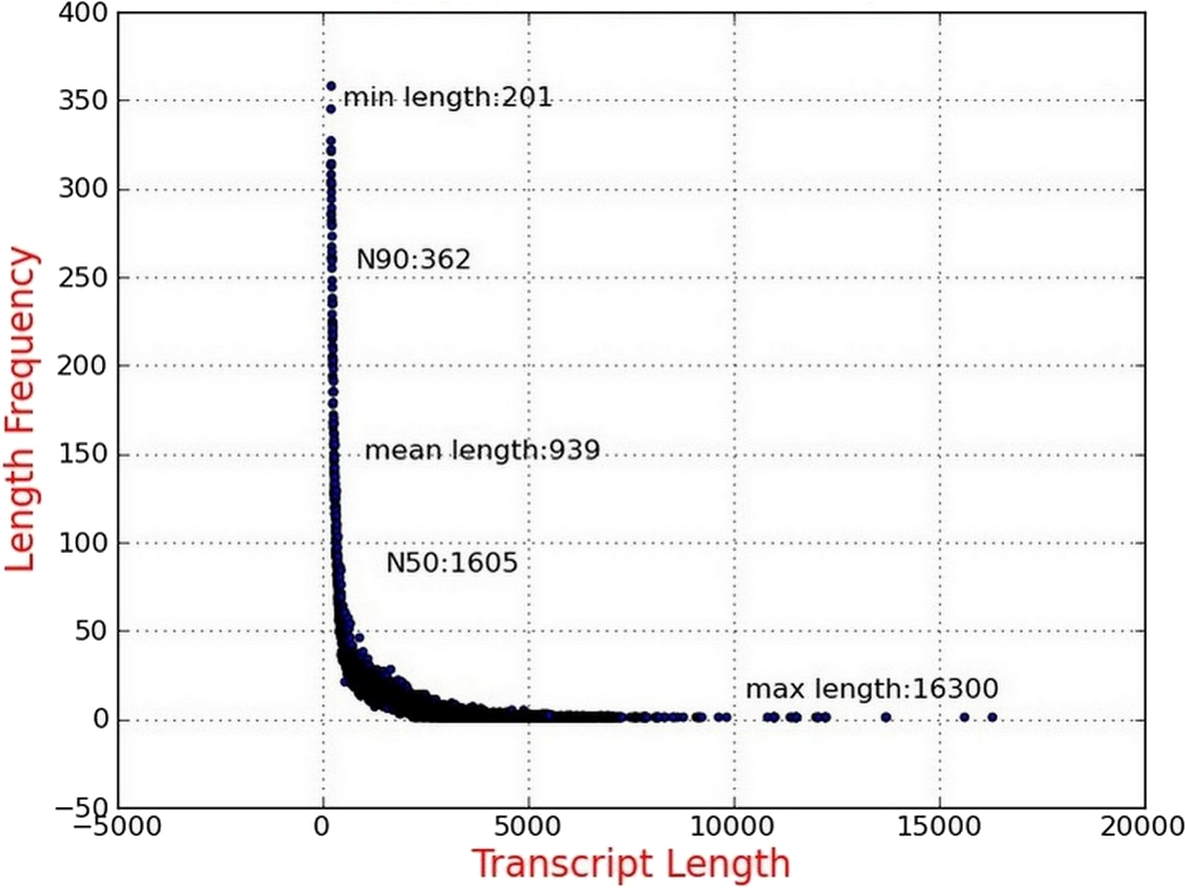
Illumina sequencing data from P. chekiangensis were deposited in NCBI SRA database under accession number SRP100128. Two samples were collected and sequenced, and more than 134 million raw reads were initially obtained (Hansen, Brenner & Dudoit, 2010). After the filtering procedure, 128,237,694 clean reads with 93.99% and 93.47% Q30 bases, respectively, were selected for further analyses (Table 2). Using Trinity software, 75,647 transcripts were assembled successfully with an average length of 939 bp and the N50 was 1,605 bp. More than 39,000 transcripts were longer than 500 bp, accounting for 52.81% (Fig. 1). In total, 48,011 unigenes were identified, having an average length of 761 bp, and 19,439 of them were longer than 500 bp (40.49%).
| Sample | Raw reads | Clean reads | Clean bases | Error (%) | Q20 (%) | Q30 (%) | GC |
|---|---|---|---|---|---|---|---|
| NM_1 | 67,268,601 | 64,118,847 | 6.41G | 0.03 | 98.30 | 93.99 | 47.80 |
| NM_2 | 67,268,601 | 64,118,847 | 6.41G | 0.03 | 97.99 | 93.47 | 47.87 |
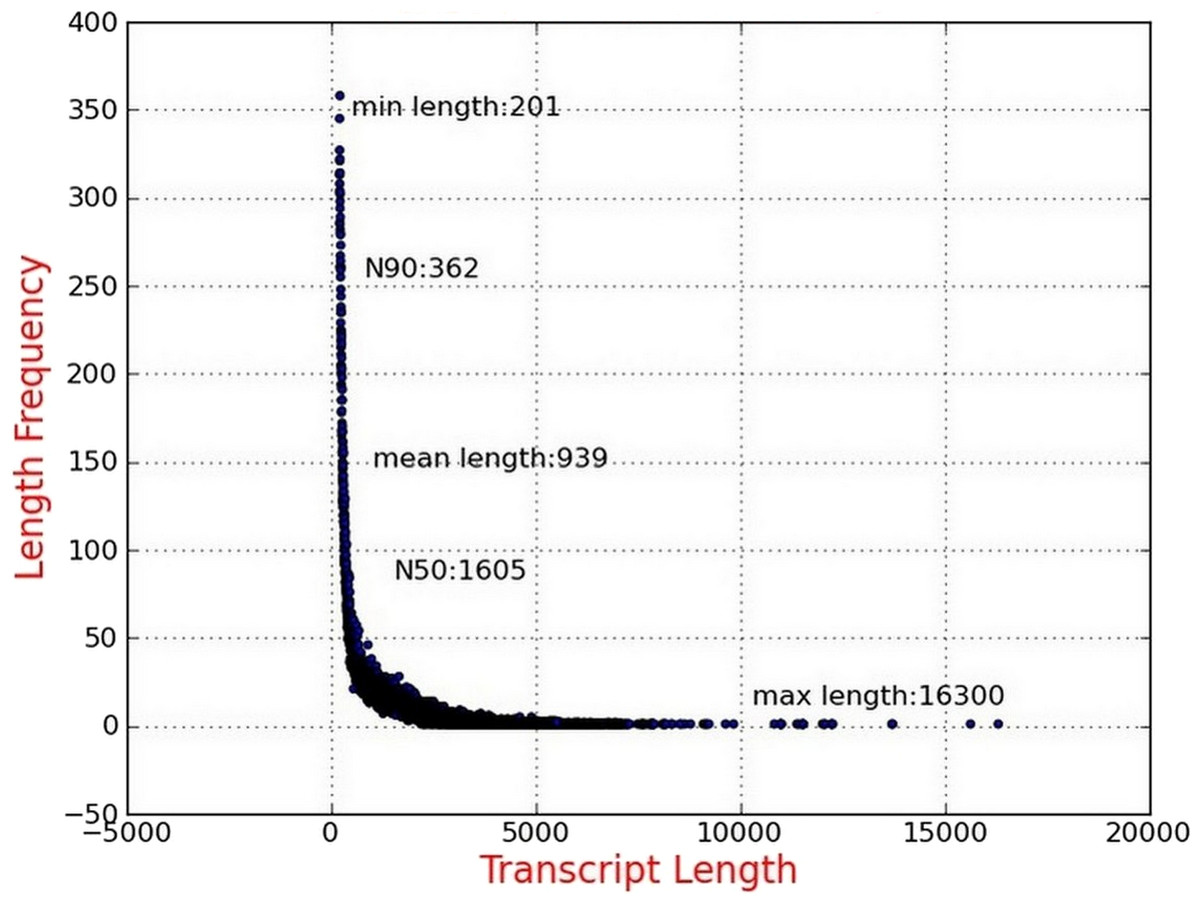
Figure 1: Length distribution of assembled transcripts.
Functional annotation of P. chekiangensis unigenes
After the functional annotation (Table 3), 29,714 of the 48,011 unigenes were successfully annotated in at least one database (61.88%) based on NCBI non-redundant protein sequences (File S1), NCBI nucleotide sequences, Protein family, Clusters of Orthologous Groups of proteins, Gene Ontology (GO), the KEGG Ortholog and Swiss-Prot databases, and 3,952 unigenes were annotated in all of the databases (8.23%). Besides, expression levels of unigenes were estimated based on Reads Per Kilobases per Millionreads using RSEM (File S2).
| Number of unigenes | Percentage (%) | Functional categories | |
|---|---|---|---|
| Annotated in NR | 26,693 | 55.59 | |
| Annotated in NT | 10,641 | 22.16 | |
| Annotated in KEGG | 9,132 | 19.02 | 31 |
| Annotated in SwissProt | 19,828 | 41.29 | |
| Annotated in PFAM | 20,268 | 42.21 | |
| Annotated in GO | 21,164 | 44.08 | 51 |
| Annotated in KOG | 12,799 | 26.65 | 26 |
| Annotated in all databases | 3,952 | 8.23 | |
| Annotated in at least one database | 29,714 | 61.88 | |
| Total unigenes | 48,011 |
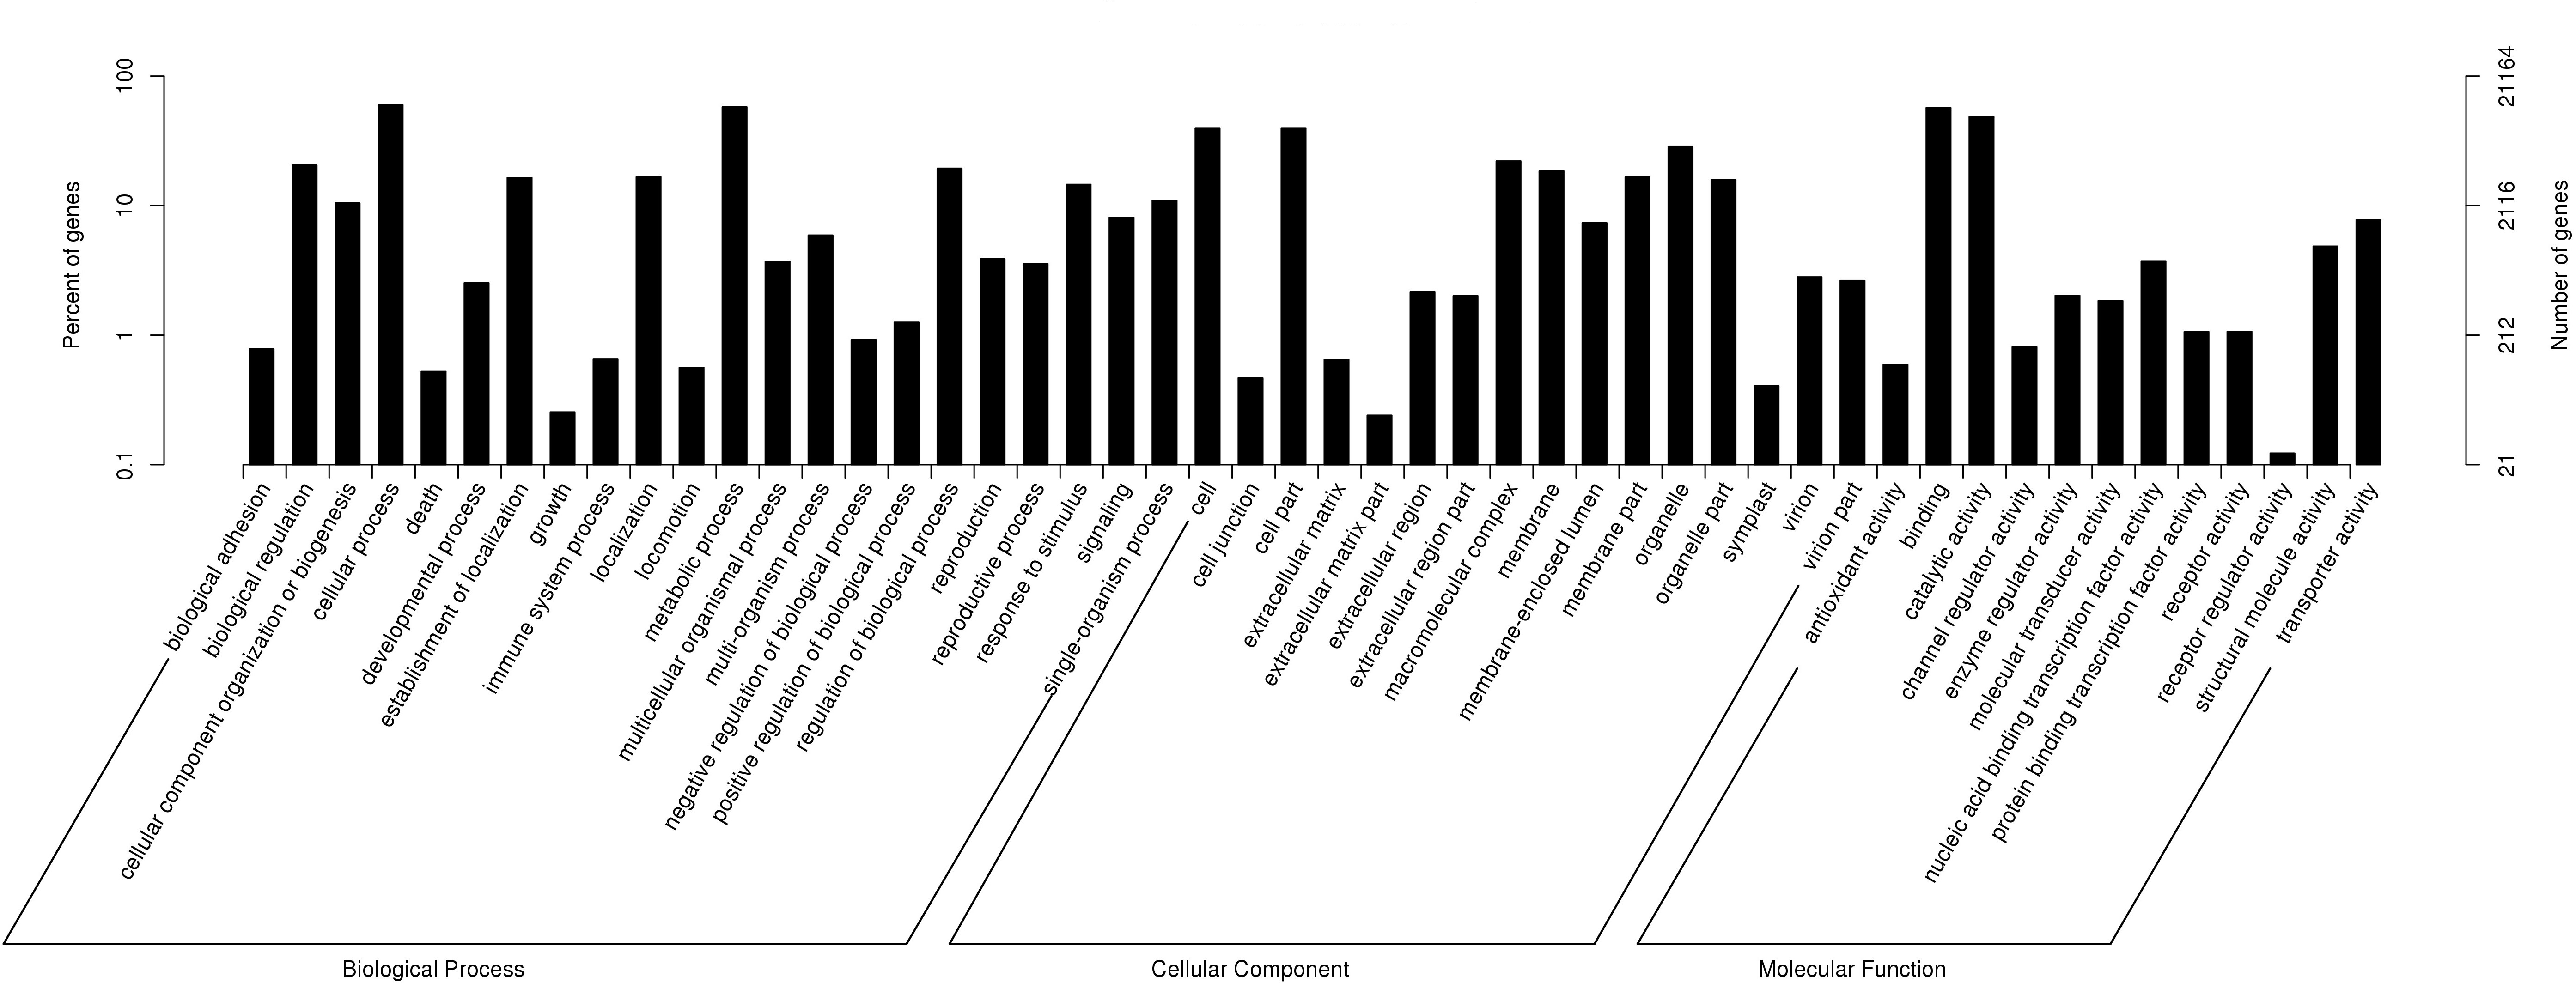
According to GO annotations, 21,164 annotated unigenes were divided into three categories: Biological Process, Cellular Component and Molecular Function (Fig. 2). Then these categories were sub-divided into 51 groups. Out of the 13 second-level groups in the Molecular Function category, ‘binding’ (56.99%), ‘catalytic activity’ (48.54%) and ‘transporter activity’ (7.76%) were the most abundant terms; Out of the 16 second-level groups in the Cellular Component category, ‘cell’ (39.45%), ‘cell part’ (39.44%) and ‘organelle’ (28.75%) had the highest number of unigenes; Out of the 22 second-level groups in the Biological Process category, ‘cellular process’ (60.07%), ‘metabolic process’ (57.79%) and ‘biological regulation’ (20.56%) were the most abundant terms.

Figure 2: Functional gene ontology classification of P. chekiangensis unigenes.
Based on KOG classification results, 12,799 unigenes were divided into 26 categories and three richest categories were ‘general functional prediction only’ (15.43%), ‘post-translational modification’ (13.24%) and ‘signal transduction’ (9.90%). According to KEGG annotation results, 9,132 unigenes were divided into five major clades, including 31 sub-terms. ‘Genetic information processing translation’ (12.67%), ‘carbohydrate metabolism (10.82%) and ‘folding, sorting and degradation’ (9.06%) were the three richest sub-terms (Fig. 3).
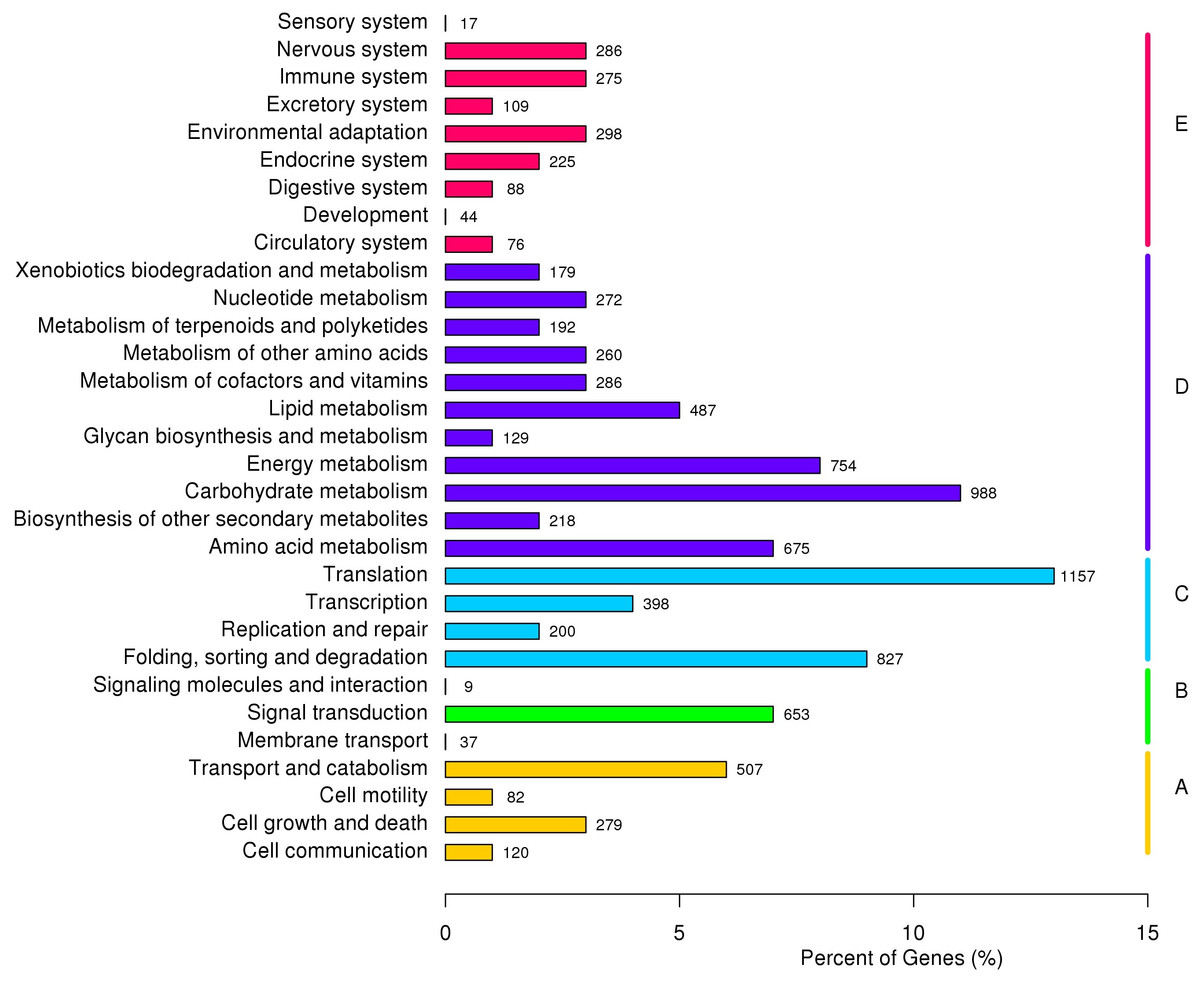
Figure 3: KEGG annotation of P. chekiangensis unigenes.
All of the unigenes were divided into five subgroups: (A) Cellular processes; (B) Environmental information processing; (C) Genetic information processing; (D) Metabolism; (E) Organismal systems.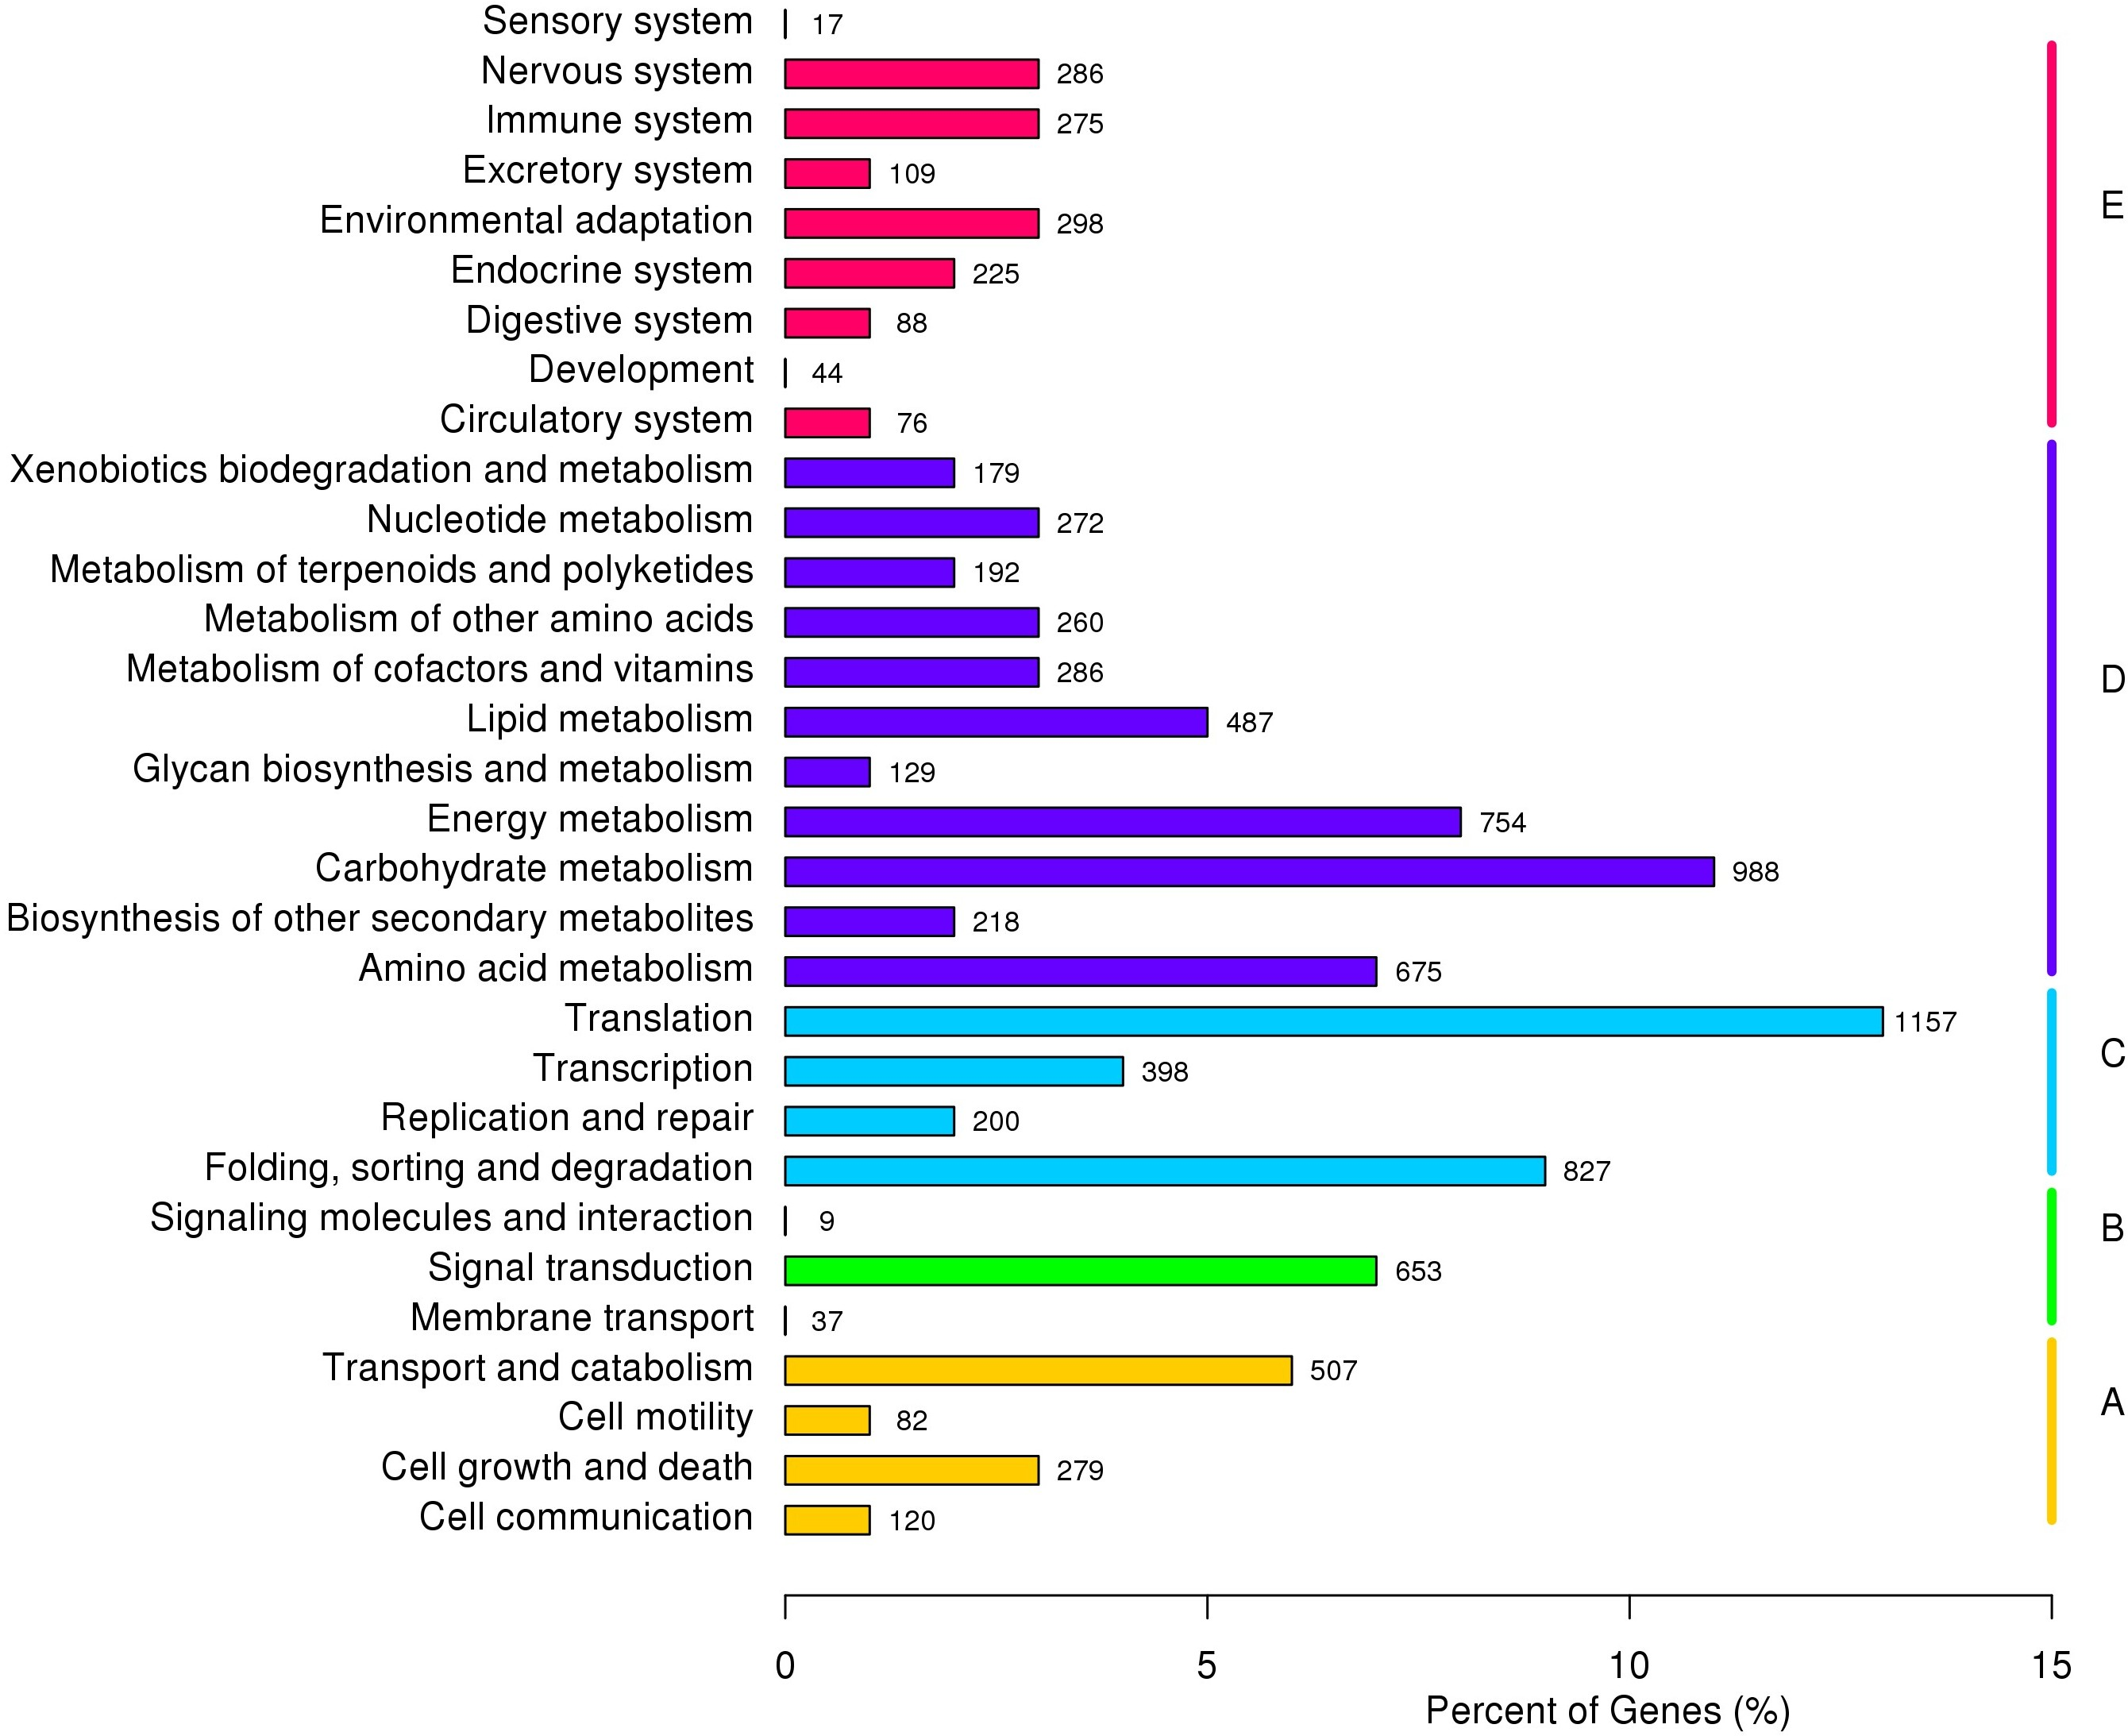
Predictions of SSRs and SNPs
A total of 48,011 transcripts were examined for SSR prediction (File S3), and 9,505 were identified with SSRs (19.80%) and 1,830 sequences were found to have more than one SSR. According to the prediction results, 11,776 SSRs were predicted and one unit repeats accounted for the highest percentage (49.03%). In addition, 736 SSRs were present in compound formations.
According to the SOAPsnp prediction results, 162,983 putative SNPs were predicted in P. chekiangensis (File S4). Among them, 77.27% were in non-coding regions, 22.73% were in coding regions, 22.60% were synonymous SNPs, and 0.13% were non-synonymous. Most unigenes have less than 10 SNPs per 1,000 bp, indicating that the SNP frequency in P. chekiangensis was relatively low (Fig. 4). Although most SNPs seem not to affect the amino acid composition, they may be closely correlated with a bias in codon usage.
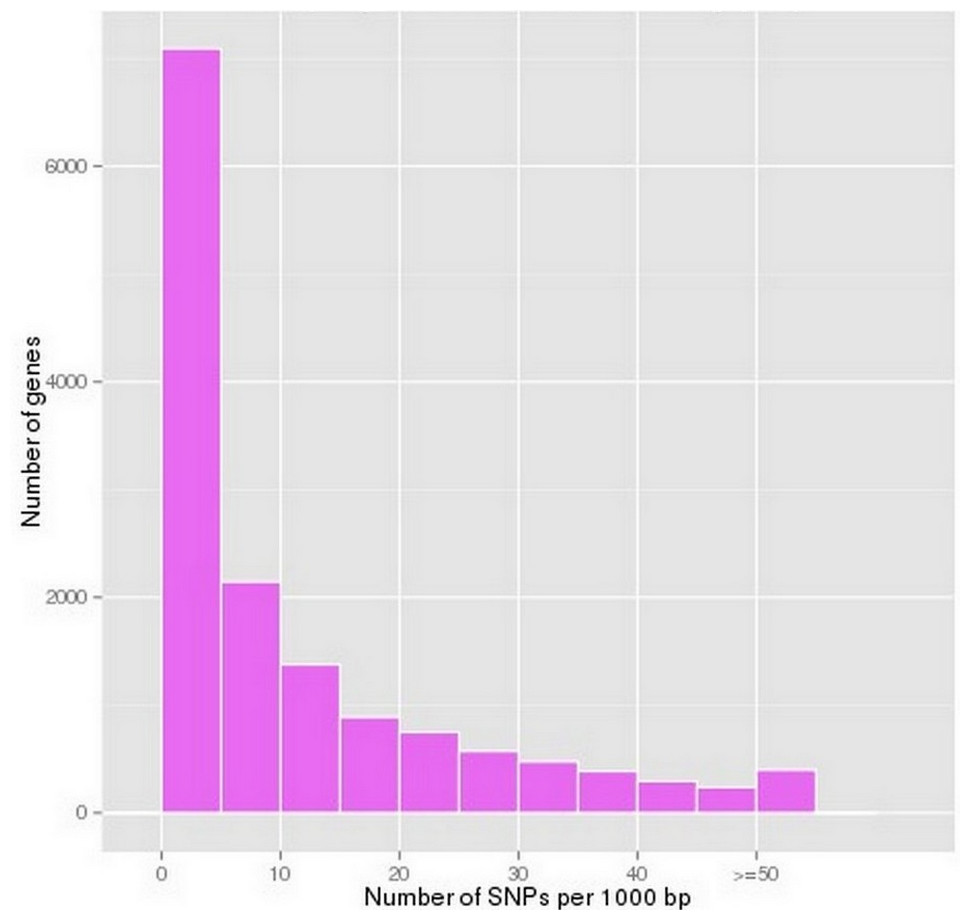
Figure 4: Frequency distribution of SNP densityin P. chekiangensis according to predicted results using SOAPsnp.
Validation of SNP prediction results
To further validate the putative SNPs, 15 unigenes containing 100 putative SNP loci were selected and primers were designed (Table 4). Because of the limited samples, the putative SNPs were validated using Sanger sequencing results, with the sequences amplified by PCR. All amplified sequences were sequenced accordingly, and when the double peak phenomenon was observed at one locus, based on the sequence diagram together with the comparison results between other sequences, this site could then be defined as a SNP according to the theory of polymorphism. As a result, 25 putative SNPs were finally validated.
| Unigene | SNP locus | PCR primers (F and R) | Allele | Unigene function |
|---|---|---|---|---|
| comp100159_c0 | 325 | F: GAGGAAAGAAGCTTATGG | T/C | Unknown |
| R: TGCATGCGACTAACAACT | ||||
| comp100433_c0 | 567 | F: TCAGAATTGCTGACTTGT | G/A | DNA-directed RNA polymerase subunit beta |
| R: CATCAATACCAATTGCCAA | ||||
| comp102740_c0 | 416 | F: AGTAGTGTGGATCCAACCC | C/A | Unknown |
| R: ACTATCTCTATGCATATCA | ||||
| comp39317_c0 | 244 | F: TCTAAAATGATGAAAACGA | A/C | Pentatricopeptide repeat-containing protein |
| R: AGCAGTTTGAATACATGG | ||||
| comp42809_c0 | 57;103 | F: CAAGACAAATCTTGGATT | G/A;G/C | Thiopurine S-methyltransferase |
| R: GAAACGGAGATTGAAGTTT | ||||
| comp44031_c0 | 891 | F: TGTTAACTCTAATGGCATC | A/G | Lysine histidine transporter-like 7 |
| R: AAGCATCAGAGAGTGGAG | ||||
| comp45316_c1 | 930 | F: GCCGTTCCCTCGAGCCTTG | A/C | myb proto-oncogene protein |
| R: GAAGAAGATGAGGGTGGG | ||||
| comp41583_c0 | 523 | F: TCCTGCTAATTGTTGAGAC | C/G | Peptidyl-prolyl cis-trans isomerase NIMA-interacting 4 |
| R: TCATAGGTTATCCATAAT | ||||
| comp44876_c0 | 494 | F: CTGCAGAGAAGAAGGAGAG | C/T | Jasmonate ZIM domain-containing protein |
| R: AATGTGATAAGAGCCTTTC | ||||
| comp44881_c0 | 153 | F: GGGTGAGATCTGAAAAGAAA | A/G | Unknown |
| R: GACCGTTGAATTGAAAGG | ||||
| comp45780_c0 | 54;209 | F: CATGCGTTTGAAAGGAAGC | A/G;G/T | RNA 3′ terminal phosphate cyclase |
| R: GTTAGGATGATTGTCATG | ||||
| comp47295_c0 | 846 | F: TCCACCTTACAAGATTTA | C/G | Putative glutamine amidotransferase YLR126C-like |
| R: TACGAAGGCTTCGTCATCA | ||||
| comp48234_c0 | 664 | F: TTCATCATCTGTCGTCGAA | C/T | 30S ribosomal protein 2 |
| R: CTCGGATGCTCAAGAGAAA | ||||
| comp48580_c0 | 331 | F: GTTAAAATGAATTGTTTTT | A/G | Unnamed protein product |
| R: AATGTGTCAAGAATACTAC | ||||
| comp50565_c0 | 295;324 | F: CGCATGGCGTACAGCCCTA | C/A;A/T | Nucleotide binding protein, putative |
| R: TTGAGCAGAAGCTTGACCT | ||||
| comp50815_c0 | 148;252 | F: CGGAGGCTCTCGCGGTCTC | T/G;G/C | Putative lipase ROG1-like |
| R: ACAAAGACAGAAGGCCAG | ||||
| comp531362_c0 | 256;402 | F: CCAAGACTTAAGAAGGGG | T/G;G/A | UPF0481 protein At3g47200-like isoform 1 |
| R: TATCCACCTCCCTATACAG | ||||
| comp5334_c0 | 363 | F: CACGATCGGGCCGAGGAC | C/G | Unknown |
| R: TGCCGGTGCGGCACGAGCT | ||||
| comp5410_c0 | 586 | F: GCAGCTTCTTCTTCTTCT | C/A | Surfeit locus protein |
| R: GATCCAGTGATGAATTGG | ||||
| comp544568_c0 | 257 | F: TCTACTGGAGAGGCCAAC | A/T | Pre-mRNA-splicing factor ATP-dependent RNA helicase |
| R: TCTTCAGGAGCTCTCTGTT |
Assembly and annotation of P. chekiangensis unigenes
In our study, 48,011 unigenes were assembled and 29,714 unigenes were successfully annotated. Based on the distribution of homogenization results, although the sequencing depth of the 5′∕3′ regions were relatively lower, the overall degree of transcripts’ homogenization was high, indicating that our transcriptome sequencing results could satisfy the following analyses (Fig. 5). Because limited previous studies have been reported on the molecular mechanisms of this species (Gao et al., 2016), we believe that the assembly and annotation of these unigenes, including eight unigenes involved in lignin synthesis, would be beneficial to the research on P. chekiangensis molecular mechanisms, including the exploration of its excellent wood properties. Based on our annotation results, only 61.88% of all unigenes were successfully annotated in at least one database, suggesting that nearly 40% of the unigenes were uniquely distributed in P. chekiangensis. Therefore, the large number of unigenes, together with the transcripts, could effectively increase the transcriptomic and genomic information available for this species. Additionally, the prediction of 162,983 putative SNPs and 25 validated SNPs in P. chekiangensis may be useful in detailed population genetic analyses.
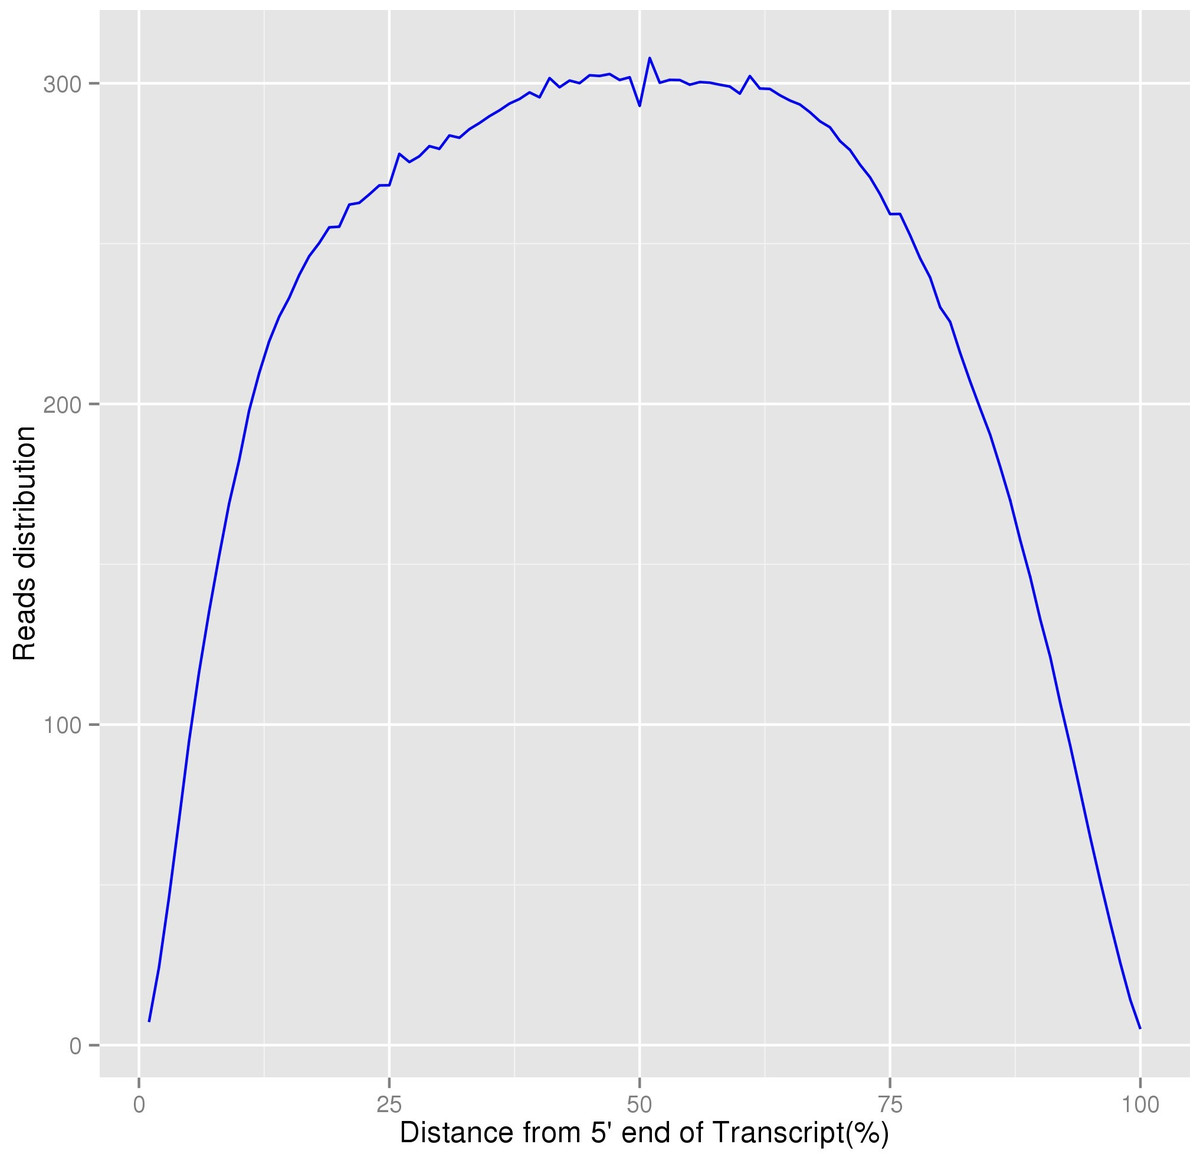
Figure 5: Homogenization distribution curve of P. chekiangensis transcripts.
The vertical axis represents the average values of sequencing depth.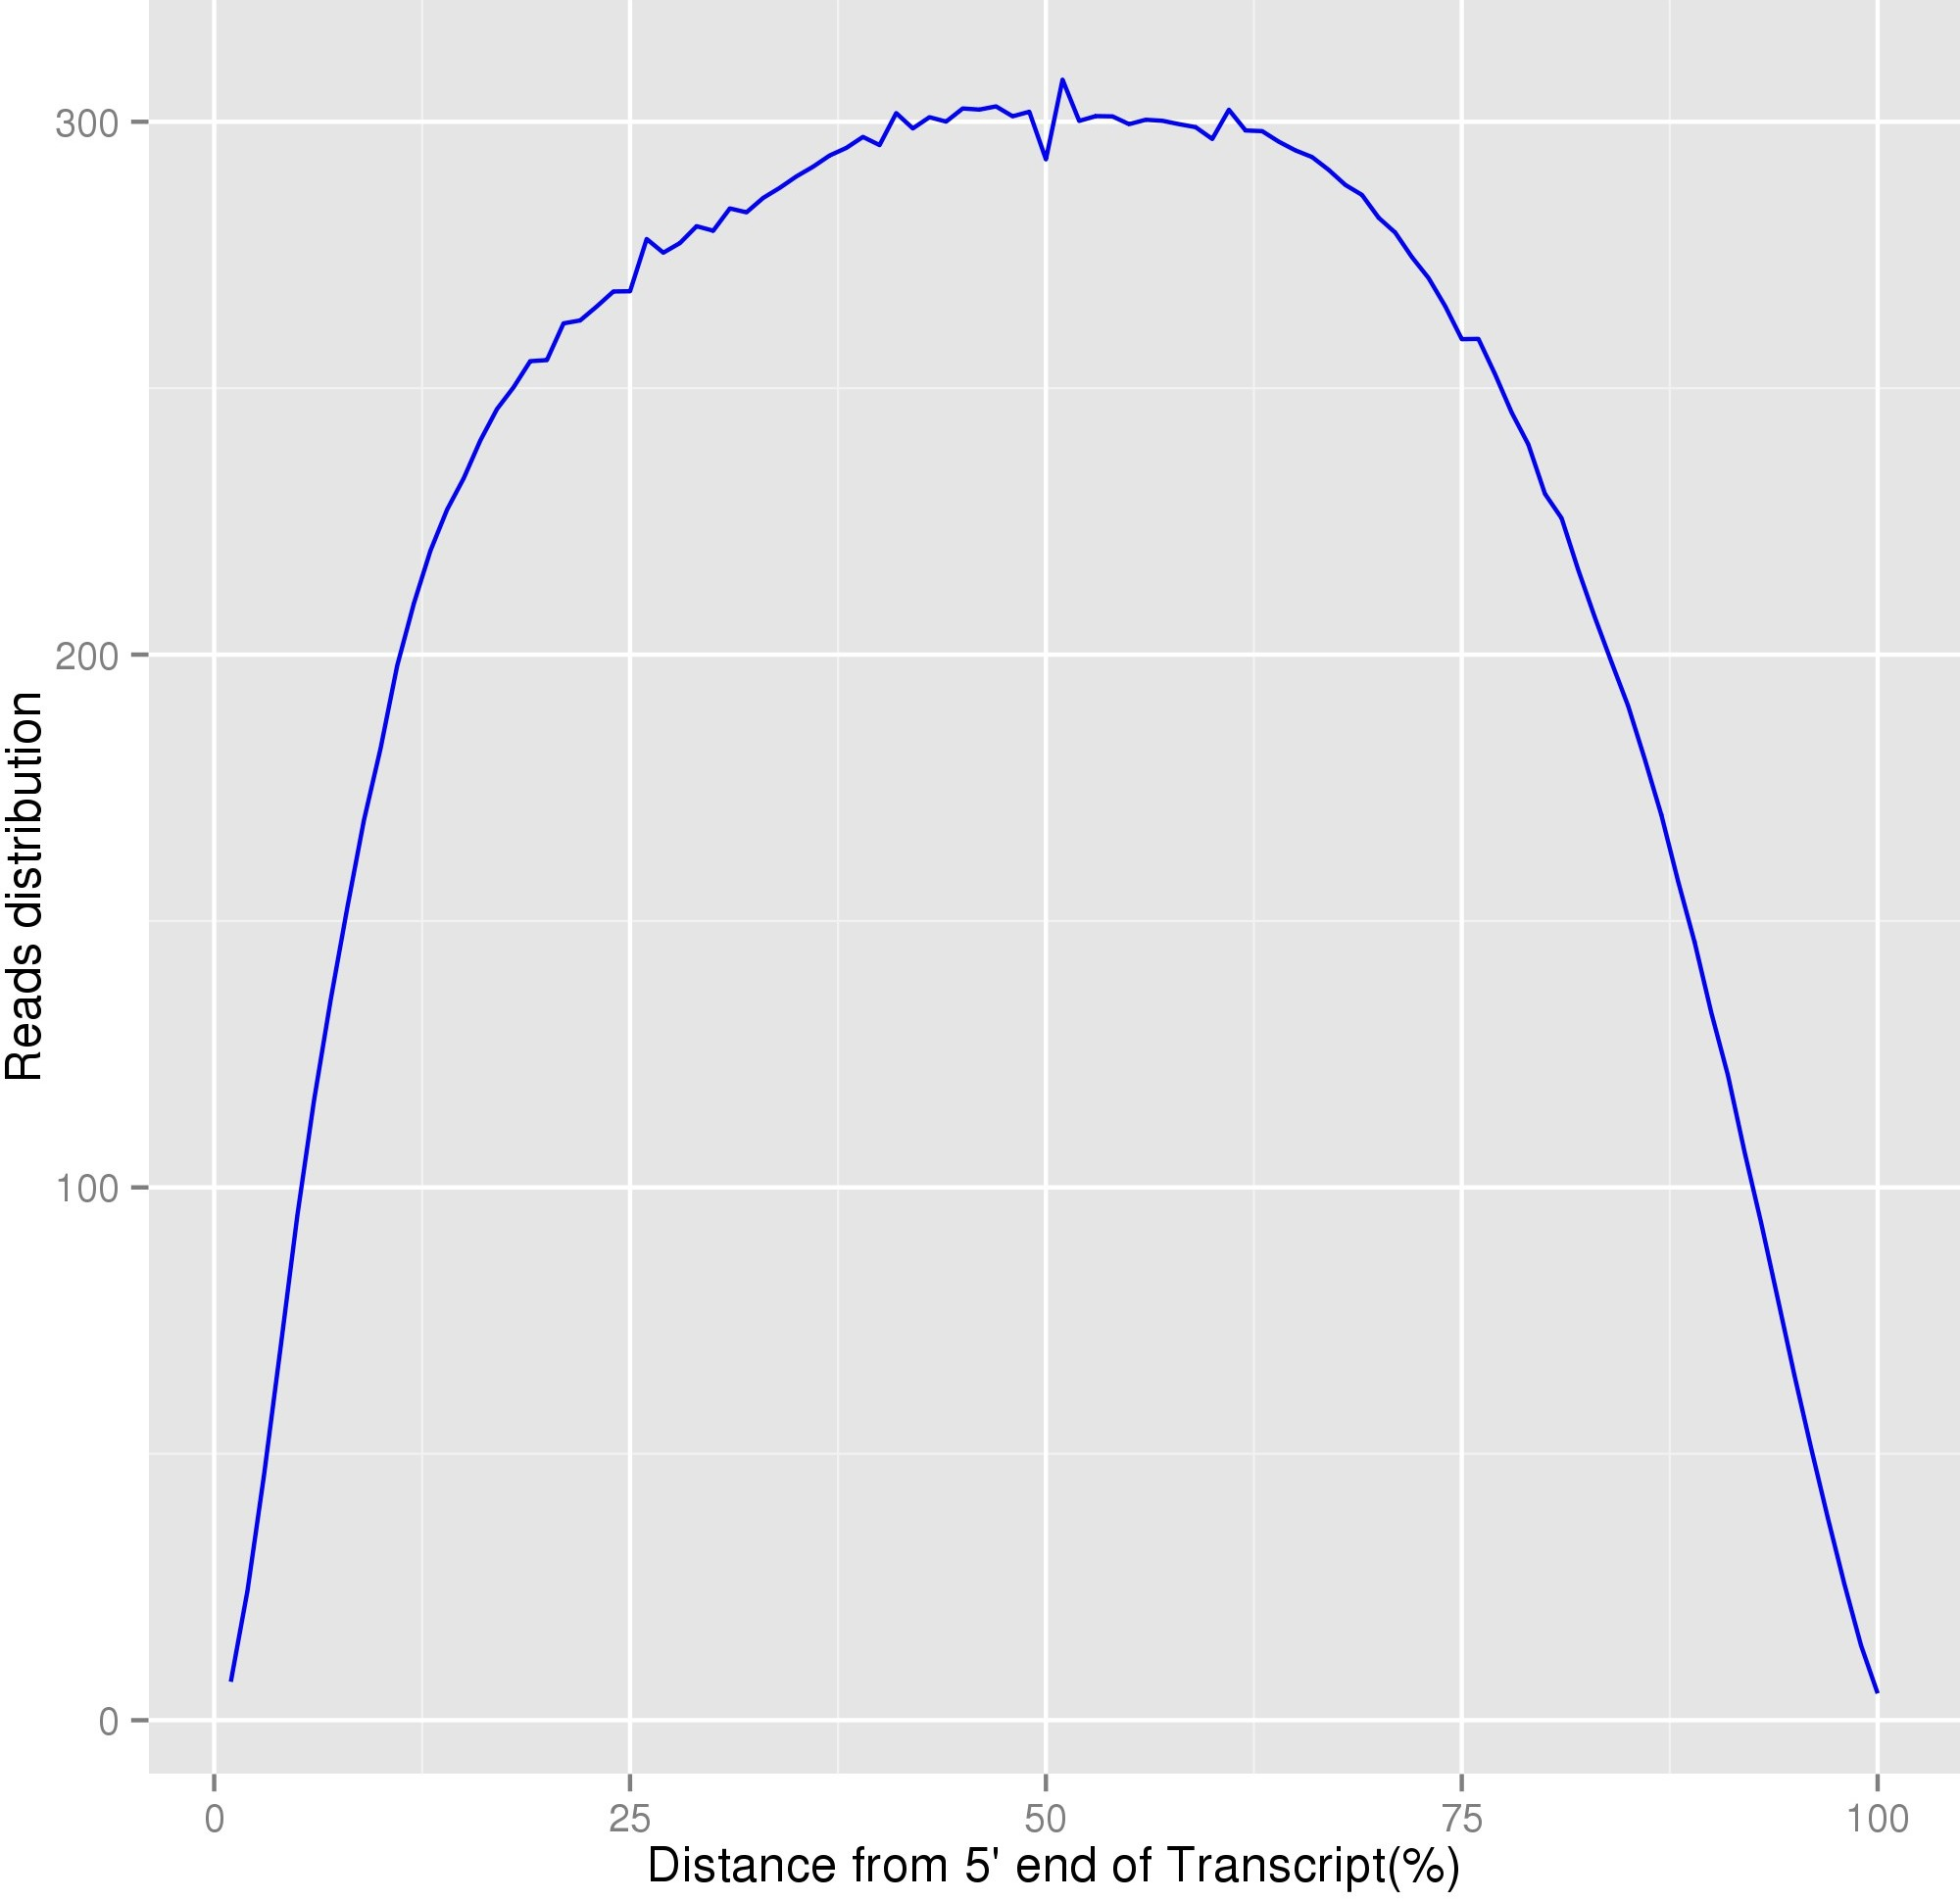
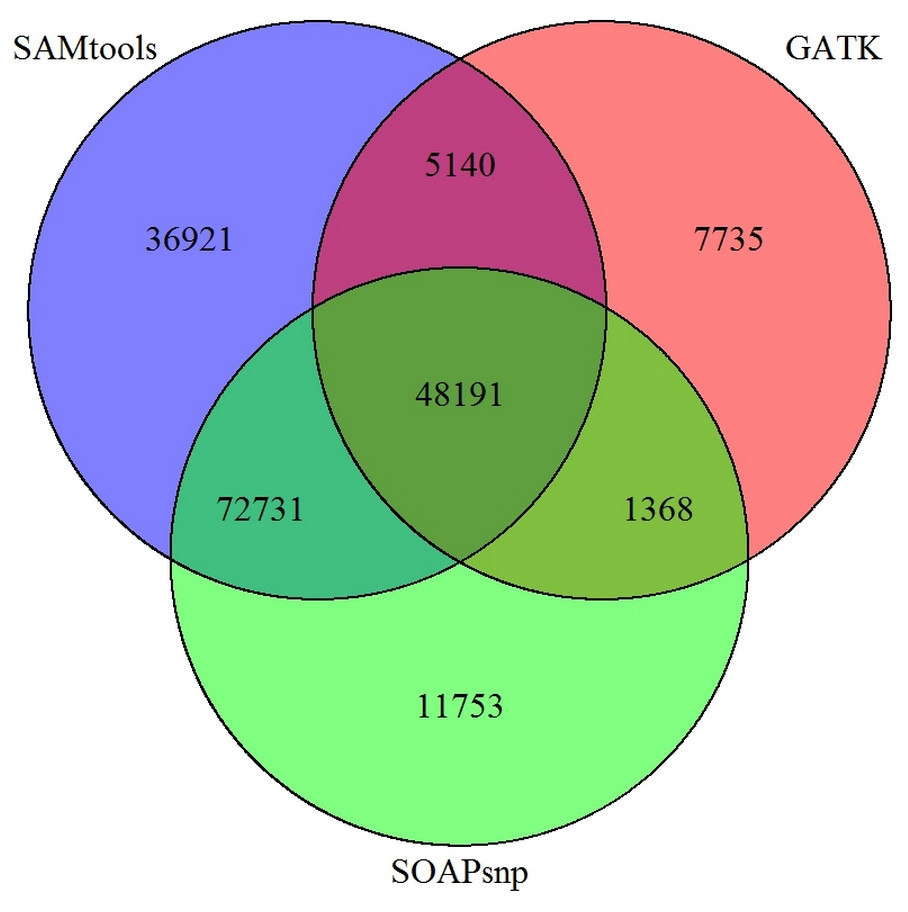
Figure 6: Comparison of SNP prediction results when using three different SNP calling packages.
The criteria of SNP validation in P. chekiangensis
With the appearance of the next-generation sequencing technology, this will allow for the sequencing of polymorphic genotypes on specific target areas and consequent SNP identification, and the direct sequencing of DNA segments amplified by PCR from several individuals is still one classic method to identify SNPs (Oeveren & Janssen, 2009; Portis et al., 2013; Rafalski, 2002). Since we used Sanger method to validate putative SNP results, we sequenced each single sequence from both two ends (5′ end and 3′ end), and then they were assembled together in order to make sure the reported variants were not in fact the product of sequencing. However, in some scarce species with high heterozygosity, such as P. chekiangensis, a few problems may not be ignored. One important issue is that when amplified segments were paired-end sequenced, the results may not be easily assembled, and false positive SNPs may easily be detected because of the interference of heterozygosity or misalignment of paralogs. As a result, single sequences in one individual may have changeable bases at one position, and this may be confusing when analyzing multi-sequence alignment results to validate SNPs. As a considerable fraction of the predicted ‘SNPs’ are nucleotide polymorphisms between orthologous regions in the parental haplotype of a heterozygous individual, hence the exact rate of false positive or accuracy may be difficult to determine because of probable alignment artifacts caused by misalignment. In our study, we excluded this situation in one individual and only regarded base differences derived from multi-sequences as validated SNPs Besides , only obvious base differences together with double peak phenomenon observed were regarded as validated SNPs, although the clear definition of polymorphism in a single individual remains a question.
The results varied when using different SNP prediction software
In our study, SOAPsnp (Li et al., 2009b) was selected as our SNP prediction software. However, more than 20 software packages or programs, including GATK (several versions included) (McKenna et al., 2010), SAMtools (Li et al., 2009a), SOAPsnp have been developed to predict SNP, for both transcriptomes and genomes, regardless of the de novo assembly or a reference. In addition to using SOAPsnp for P. chekiangensis SNP prediction in this research, GATK and SAMtools were also selected for comparison. The different SNP prediction software packages varied greatly in time consumption and accordance, with an average accordance between different SNP software of less than 25%, indicating that most SNP prediction results were not consistent when using different prediction software (Fig. 6).
Although most SNPs for experimental validation were randomly selected, 53 of them (53%) were common in all three SNP callers. Besides, the number of those SNPs with very high/low quality values was restricted, and unigenes with more accurate annotation results were preferred. However, according to our validation results, only 25% of the prediction results were successfully validated in P. chekiangensis using SOAPsnp. Among all three SNP callers, SAMtools seemed to performed best with highest accuracy among the common 53 SNPs (19/53). Considering the limitation of samples, it might be a bit arbitrary to draw the conclusion that SAMtools is better than other two SNP callers. However, it should be noted that an even greater proportion than 75% (75/100) are false positives using SOAPsnp, although some of the variants reported may be real, the vast majority should be expected to be false. Thus, there should be numerous Type I or Type II errors in predicting SNPs when using different software. Determining which software is more suitable for various kinds of datasets (based on accuracy and precision) would be an interesting issue for further work.
Supplemental Information
Annotation of P. chekiangensis unigenes
Annotation information of assembled unigenes according to Nr, KEGG and other databases in P. chekiangensis.
Expression level estimation of unigenes
Using Reads Per Kilobases per Millionreads (RPKM), the expression levels of unigenes were estimated in P. chekiangensis.
Predicted SSRs in P. chekiangensis
The results of putative SSRs using Misa.
Predicted SNPs in P. chekiangensis
Putative SNP results and their loci according to SOAPsnp in P. chekiangensis.
Perl script for data trimming
Perl script for quality check and raw data trimming of fastq sequences.