Hyperhomocysteinemia and its association with decreased glomerular filtration rate in patients with chronic kidney disease: a comprehensive meta-analysis
- Published
- Accepted
- Received
- Academic Editor
- Cristina Capusa
- Subject Areas
- Internal Medicine, Nephrology
- Keywords
- Homocysteine, Glomerular filtration rate, Chronic kidney disease
- Copyright
- © 2025 Chen et al.
- Licence
- This is an open access article distributed under the terms of the Creative Commons Attribution License, which permits using, remixing, and building upon the work non-commercially, as long as it is properly attributed. For attribution, the original author(s), title, publication source (PeerJ) and either DOI or URL of the article must be cited.
- Cite this article
- 2025. Hyperhomocysteinemia and its association with decreased glomerular filtration rate in patients with chronic kidney disease: a comprehensive meta-analysis. PeerJ 13:e20064 https://doi.org/10.7717/peerj.20064
Abstract
Background
Hyperhomocysteinemia (elevated homocysteine, Hcy) is common in chronic kidney disease (CKD) patients, but its effect on glomerular filtration rate (GFR), a key renal function indicator, is unclear.
Objective
This meta-analysis aimed to clarify the association between hyperhomocysteinemia (HHcy, defined as Hcy > 15 µmol/L) and reduced glomerular filtration rate (GFR) in chronic kidney disease (CKD) patients, hypothesizing that HHcy is associated with a more significant GFR reduction. To test this hypothesis, a comprehensive search was conducted in PubMed, Embase, Cochrane databases, and reference lists. The primary outcome of interest was the relationship between HHcy and GFR decline in CKD. Methods For this meta-analysis, we established clear inclusion and exclusion criteria to identify eligible studies. Studies were included if they involved patients with chronic kidney disease (CKD), employed randomized controlled, cross-sectional, or cohort study designs, included participants aged 14 years or older, and reported or permitted the calculation of glomerular filtration rate (GFR) and homocysteine (Hcy) levels. We excluded studies that were not in English, focused on acute kidney injury, end-stage kidney disease, or dialysis patients, lacked clear group definitions, were based on animal models, or used non-standard CKD definitions. A comprehensive search strategy was employed to identify relevant studies. We combined MeSH terms (e.g., “homocysteine [MeSH]” and “renal insufficiency, chronic [MeSH]”) with free-text keywords in major databases, including PubMed, Embase, and Web of Science. Additionally, we utilized the “related items” function and applied Boolean operators to refine search results. Data were synthesized through meta-analysis, and the mean ± SD of GFR in CKD patients according to Hcy levels were calculated for comparison. All databases were searched from their inception dates to June 2024.
Results
CKD patients with hyperhomocysteinemia had a lower GFR (SMD = 2.26, 95% CI [1.37–3.15]). However, significant inter-study heterogeneity (P < 0.01, I2 = 99.5%) was found. Five articles (Z 2016, Ye, Z 2017, Zhang, Y 2020, Shen, Z 2022, Wu, and J 2022) contributed to it (P = 0.015 < 0.05). Subgrouping them eliminated heterogeneity (P = 0.52, I2 = 0.00%). Sensitivity analysis showed individual article exclusion had little effect on the result. But Egger tests showed publication bias (P < 0.05), while scissors graph analysis supported result stability (P < 0.01).
Conclusions
In CKD, elevated Hcy is related to kidney function decline.
Background
Chronic kidney disease (CKD) has emerged as a significant global public health issue in recent years, characterized by a steadily increasing prevalence and a high risk of progression to end-stage renal disease (ESRD). According to a large-scale epidemiological study by Chen et al. (2025) which analyzed CKD data from the Global Burden of Disease (GBD) study from 1990 to 2021, the prevalence of CKD has been rising at an alarming rate. It is projected that by 2031, the number of CKD cases will increase to 22.21 million, with mortality reaching 1.81 million. Glomerular filtration rate (GFR) is a key biomarker for assessing renal function in CKD patients and is crucial for understanding disease severity and progression. Identifying factors that influence GFR levels is essential for optimizing clinical management strategies and advancing research in this field.
Hyperhomocysteinemia (HHcy), characterized by elevated levels of homocysteine in the bloodstream, has increasingly been recognized as a potential risk factor in various cardiovascular and renal pathologies. In the CKD patient population, HHcy has a relatively high incidence. As reported in a study by Du et al. (2023), HHcy may trigger a series of consequences that could accelerate the progression of kidney disease.
Previous research has proposed several possible mechanisms by which HHcy exerts its harmful effects on kidney function. Multiple studies (Chitalia et al., 2015; Kokubo et al., 2009) have documented that direct endothelial injury in the renal vasculature can disrupt the microcirculation necessary for maintaining proper renal perfusion. For instance, Heinen et al. (2015) demonstrated this in an experimental study. Oxidative stress induction, as well-described in the literature (Duni et al., 2019), can initiate a chain reaction of cellular damage and dysfunction, impairing normal kidney physiological processes. Moreover, HHcy has been shown to interfere with the complex metabolic pathways that maintain renal homeostasis, disturbing the delicate balance required for normal organ function. Collectively, these pathophysiological changes can lead to structural and functional abnormalities in the glomeruli, the kidney’s main filtration units, ultimately resulting in observable changes in GFR.
However, the relationship between HHcy and GFR in CKD patients remains controversial. Some individual studies have found significant correlations (Shyamkrishnan et al., 2022), while others have failed to replicate these associations (Chen et al., 2022). This inconsistency in research findings highlights the need for a well-designed and comprehensive meta-analysis. By aggregating and synthesizing data from multiple studies, such an analysis can provide a more accurate and reliable assessment of the true impact of HHcy on GFR in CKD patients. This approach not only has the potential to clarify the clinical significance of HHcy in the context of CKD but also to guide future research and the development of evidence-based treatment plans.
Methods
Adherence to the PRISMA statement
Our study was meticulously designed and conducted in strict accordance with the Preferred Reporting Items for Systematic Reviews and Meta-Analyses (PRISMA) guidelines, ensuring transparency, reproducibility, and methodological rigor throughout the research process.
Eligibility criteria for study inclusion
To curate a relevant and homogeneous set of studies for our meta-analysis, we established a series of well-defined inclusion criteria. Firstly, studies were required to involve patients diagnosed with chronic kidney disease (CKD), thereby ensuring the focus on the target patient population relevant to our research question. Secondly, the study designs eligible for inclusion encompassed randomized case-control studies, cross-sectional studies, or cohort design studies. These particular study architectures were chosen as they are commonly employed in epidemiological and clinical research, offering robust frameworks for investigating associations and outcomes in CKD patients. Thirdly, to maintain consistency in the age range of the participants across studies, only those studies that included patients aged 14 years or older were considered. This age cut-off was set to align with the typical onset and diagnosis patterns of CKD in clinical practice and research settings. Lastly, studies had to provide either direct reports of the glomerular filtration rate (GFR) and hyperhomocysteinemia (HHcy) levels or furnish sufficient data that would permit the calculation of these crucial parameters. This stipulation was essential to enable quantitative analysis and comparison across the selected studies.
Exclusion criteria for study screening
Conversely, several exclusion criteria were implemented to filter out studies that did not meet the necessary quality or relevance standards. Firstly, studies published in languages other than English were excluded. While this may introduce a potential language bias, it was a practical necessity given the resource constraints and the need to ensure accurate data extraction and synthesis, as English is the lingua franca of international scientific communication. Secondly, studies that centered on patients with acute kidney injury, end-stage kidney disease, or those requiring dialysis were excluded. The rationale behind this was to isolate the specific impact of HHcy on GFR in the context of CKD, distinct from the confounding factors and unique pathophysiology associated with more severe renal conditions. Thirdly, studies lacking clear groupings, which could impede meaningful comparison and analysis, were omitted. Additionally, animal studies were excluded as the physiological and pathophysiological mechanisms in animals may not directly translate to human patients, and our focus was on human CKD populations. Finally, studies that employed alternative or idiosyncratic definitions of CKD, such as relying solely on creatinine levels without comprehensive diagnostic criteria, were also excluded to maintain a standardized and consistent understanding of the CKD population under investigation.
Information sources
In the pursuit of a comprehensive and up-to-date evidence base for this study, we systematically scoured multiple premier electronic databases, namely PubMed, Embase, and Cochrane. These databases, renowned for their extensive collections of peer-reviewed scientific literature across diverse medical and health-related disciplines, served as the primary reservoirs of relevant research. Our search was meticulously configured to encompass all studies archived within these platforms, stretching from their inception up until October 2024, when the data collection phase concluded. Notably, no constraints were imposed regarding the types of publications retrieved, thereby ensuring the inclusion of a wide gamut of research outputs, be it original research articles, review papers, case reports, or editorials, so long as they met the eligibility criteria relevant to our research focus.
Search strategy
To maximize the yield of relevant studies, we developed a comprehensive search strategy across PubMed, Cochrane, and Embase databases. The search terms included various expressions related to chronic kidney disease and homocysteine, ensuring a thorough capture of relevant literature on their relationship. For brevity and clarity, the detailed search strings are provided in the Appendix. This approach enhances transparency and reproducibility, allowing others to replicate our search methodology. All databases were searched from their inception to June 2024.
Selection process
The process of sifting through the retrieved studies to identify those that met our stringent inclusion and exclusion criteria was a meticulously orchestrated collaborative effort. Three independent reviewers, namely Wei Chen, Xueming Liang, and Jie Wang, each with their expertise and methodological acumen in the relevant field, undertook the initial screening of the studies. In cases where discrepancies or disagreements arose regarding the eligibility of a particular study, an in-depth discussion was promptly initiated among the reviewers. This iterative and collegial approach ensured that all perspectives were considered, and a consensus was reached based on a comprehensive evaluation of the study’s characteristics, methodology, and relevance to our research question, thereby guaranteeing the integrity and reliability of the final set of selected studies for our meta-analysis.
Data collection process
The data collection phase of this study was executed with meticulous attention to detail and a robust methodological approach, ensuring the integrity and reliability of the information gathered. Three highly trained reviewers, namely Wei Chen, Xueming Liang, and Jie Wang, each bringing their unique analytical skills and subject matter expertise to the table, independently scrutinized the selected studies. In instances where discrepancies or differences in interpretation arose during the review process, a collaborative and in-depth discussion was promptly initiated among the reviewers. This iterative dialogue served as a mechanism to reconcile contrasting viewpoints, leveraging the collective knowledge and insights of the team, and ultimately arriving at a consensus-based decision regarding the data to be incorporated.
Data extraction was carried out in a comprehensive and standardized manner, covering a range of crucial variables. The country of origin of each study was recorded, providing valuable context regarding potential geographical variations in research findings and patient populations. The study period was noted, enabling an understanding of the temporal scope within which the data was collected and the research was conducted, which could potentially influence the generalizability of the results. The year of publication was also documented, facilitating the tracking of the evolution of knowledge in the field over time.
Inclusion criteria specific to each study were meticulously documented, as these criteria are fundamental in shaping the characteristics of the participant cohorts and the nature of the research findings. The definition of hyperhomocysteinemia (HHcy) was a key aspect of data extraction. Across the literature, while a commonly adopted threshold defines HHcy as homocysteine (Hcy) levels exceeding 15 µmol/L (Ye et al., 2016; Tak et al., 2016), it was acknowledged that some degree of variation in this definition existed among different studies. This heterogeneity in the definition was carefully noted, as it could impact the comparability of results across investigations.
Regarding glomerular filtration rate (GFR), the values corresponding to different Hcy levels were extracted. The main outcome metric for our analysis was the standardized mean difference (SMD), which was utilized to prognosticate and quantify the changes in GFR within chronic kidney disease (CKD) populations exhibiting high HCY levels. This metric provides a standardized and statistically meaningful way to compare the differences in GFR between groups with and without HHcy, accounting for potential differences in study design and sample characteristics.
To ensure a consistent and evidence-based classification of CKD, we adhered to the well-established guidelines set forth by the National Kidney Foundation’s Kidney Disease Outcome and Quality Initiative (KDOQI) (Inker et al., 2014). According to these guidelines, CKD was defined as an estimated GFR (eGFR) less than 60 mL/min/1.73 m2 persisting for more than 3 months, or the presence of renal injury markers, such as proteinuria or cystatin, for a duration exceeding 3 months, irrespective of whether a concurrent decrease in GFR was observed.
In prospective cohort studies, the incidence of CKD was defined as individuals who, at baseline, did not have CKD but subsequently experienced a decline in GFR to less than 60 mL/min/1.73 m2, or developed hematuria and proteinuria for a period greater than 3 months during the follow-up period. In contrast, within cross-sectional studies, the incidence of CKD was defined as those individuals who met the diagnostic criteria for CKD as identified during routine physical examinations conducted by community residents and physical examination centers. This nuanced approach to defining CKD incidence across different study designs was essential to accurately capture and compare the prevalence and development of the disease in diverse research settings.
Data items
The standardized mean difference (SMD) value, a crucial metric in our analysis, was computed following a precisely defined formula. Specifically, it was obtained by subtracting the mean glomerular filtration rate (GFR) of the group within the chronic kidney disease (CKD) population with normal homocysteine (HCY) levels from the mean GFR of the group presenting with high HCY levels, and then dividing the resultant difference by the mean standard deviation. This calculation methodology was designed to standardize the comparison across different studies, enabling a more meaningful synthesis of the data despite potential variations in sample characteristics and study designs.
In situations where the GFR value was not explicitly reported in the literature under review, we adopted an alternative approach by substituting the creatinine clearance value in its stead. This substitution was based on established relationships between GFR and creatinine clearance within the context of renal function assessment (Lee, 2018). Subsequently, all the data outcomes, whether derived from direct GFR reporting or creatinine clearance substitution, were amalgamated in a systematic and organized manner to form a comprehensive dataset for further analysis.
When the GFR values were presented in quartiles, as was the case in some of the studies, a conversion process was implemented to transform them into the mean standard deviation format. This transformation was carried out in accordance with well-recognized statistical procedures (Luo et al., 2018), ensuring that all data were expressed in a uniform and comparable metric, thereby facilitating the accurate computation of the SMD and other relevant statistical analyses.
Study risk of bias assessment
To rigorously evaluate the quality and potential biases inherent in the selected cohort and cross-sectional studies, a systematic and standardized assessment protocol was implemented. Two experienced authors were tasked with conducting these evaluations, each employing specific assessment tools tailored to the study design.
For the cohort studies, the Newcastle-Ottawa Scale (NOS) was utilized (Xu et al., 2017). This scale is designed to comprehensively appraise various aspects of a cohort study’s quality, awarding a maximum of nine points across three key domains: study population comparability, quality of selection, and outcomes. Based on the total score achieved, the study quality was classified into one of three categories. Studies scoring between zero and three points were deemed to be of poor quality, indicating significant limitations in one or more of the evaluated aspects. Those with scores ranging from four to six points were considered to be of fair quality, suggesting a moderate level of methodological rigor and appropriate study design choices. Studies attaining scores of seven to nine points were regarded as being of high quality, signifying robust study design, adequate sample selection, and reliable outcome measurement.
In the case of cross-sectional studies, the Agency for Healthcare Research and Quality (AHRQ) tool was employed (Li et al., 2020). This tool comprises 11 items, each of which requires a response in the form of “yes,” “no,” or “not reported.” Only a “yes” response was assigned a score of 1, while “no” and “not reported” responses were scored as 0. Upon completion of the assessment for all 11 items, the total score was calculated. Studies with scores between four and six were rated as being of medium quality, denoting a satisfactory level of methodological soundness, albeit with some areas that could potentially benefit from improvement. Scores of 8 to 11 points were indicative of high quality, suggesting that the cross-sectional study was conducted with a high degree of precision, appropriate sampling, and comprehensive data collection and reporting. This dual assessment approach using the NOS and AHRQ tools ensured a thorough and objective evaluation of the quality and potential biases in the studies included in our meta-analysis, thereby enhancing the reliability of our overall findings.
Effect measures
In order to comprehensively quantify and synthesize the impact of hyperhomocysteinemia on glomerular filtration rate within the context of chronic kidney disease, a meta-analysis focusing on effect size was meticulously conducted, with the standardized mean difference (SMD) serving as the principal metric. This choice of SMD was predicated on its ability to standardize the differences in means across diverse studies, thereby facilitating a more meaningful comparison and aggregation of results, notwithstanding potential disparities in study designs and participant characteristics.
All confidence intervals (CIs) were set at the 95% level, a widely accepted standard in the field of statistical inference. This level of confidence strikes an optimal balance between precision and the allowance for random error, providing a robust framework within which to interpret the variability of our estimates. Statistical significance was determined based on a p-value threshold of less than 0.05, a convention that has been firmly established in the scientific community to distinguish between chance findings and those that are likely to reflect a true underlying effect.
To gauge the presence and extent of between-trial heterogeneity, a two-pronged approach was adopted, employing both the I2 index and the Q test p-value. The I2 index, which quantifies the proportion of total variation across studies that is due to heterogeneity rather than chance, was used in tandem with the p-value derived from the Q test. A p-value below 0.05, coupled with an I2 index exceeding 50%, served as a clear indicator of substantial heterogeneity among the included studies, flagging the need for further exploration and adjustment in subsequent analyses to account for such variability (Higgins & Thompson, 2002).
Synthesis methods
The heterogeneity observed across the studies could potentially stem from a multitude of factors, each warranting careful consideration in our analytical approach. These factors encompassed a broad spectrum, ranging from methodological aspects such as the research design, data collection techniques, and analytical methods employed, to more participant-centric variables including sample size, demographic characteristics (age, gender), geographical location, and clinical parameters (blood pressure, lipid profiles like high-density lipoprotein (HDL) and low-density lipoprotein (LDL), fasting and postprandial blood glucose (FBG, PBG), estimated glomerular filtration rate (eGFR), high-sensitivity C-reactive protein (Hs-CRP), systolic and diastolic blood pressure (SBP, DBP), and pulse pressure (PP)).
To dissect and understand this heterogeneity, we harnessed a suite of advanced analytical techniques. Random-effects models were utilized to account for the inherent variability across studies, providing a more flexible and comprehensive approach to aggregating data compared to fixed-effects models, especially in the presence of significant heterogeneity. Subgroup analyses were performed, stratifying the studies based on relevant variables such as study design, participant demographics, or clinical characteristics, to isolate and examine the sources of heterogeneity within specific subsets of the data. Additionally, meta-regression analyses were conducted to quantitatively explore the relationships between potential sources of heterogeneity and the effect size estimates, thereby identifying the factors that most significantly contributed to the observed variability.
All data analysis and the generation of visual representations, including graphs and plots, were carried out using Stata version 12.0 for the Windows 8 operating system. This software, renowned for its robustness and versatility in handling complex statistical analyses, provided the necessary tools to execute our methodological framework with precision and reproducibility.
Reporting bias assessment
To evaluate the potential presence of publication bias, a critical aspect in ensuring the integrity and representativeness of our meta-analysis, we employed two complementary methods: the construction of funnel plots and the application of Egger regression tests. Funnel plots, with their characteristic funnel-shaped visual representation, provide a graphical means of assessing the symmetry of the distribution of study effect sizes against sample size or precision. Asymmetry in the funnel plot can suggest the existence of publication bias, with smaller, less significant studies potentially being underrepresented or omitted.
Complementing the visual inspection of funnel plots, the Egger regression test was conducted to statistically test for the presence of funnel plot asymmetry (Chen et al., 2023). This test, based on regression analysis, provides a quantitative measure of the likelihood of publication bias, enhancing the objectivity of our assessment and enabling a more nuanced understanding of the potential impact of selective reporting on our overall findings.
Certainty assessment
To appraise the certainty or credibility of the evidence base underpinning our outcomes, we implemented the trimming and filling methodology (Chen et al., 2023). This approach, designed to address potential publication bias and enhance the robustness of our conclusions, involves the systematic adjustment of the data set by either trimming or filling in studies based on the estimated impact of missing or underreported data. By accounting for potential biases in the available evidence, this technique provides a more accurate and reliable assessment of the true effect size, thereby strengthening the confidence in our overall findings and their implications for clinical practice and future research directions.
Results
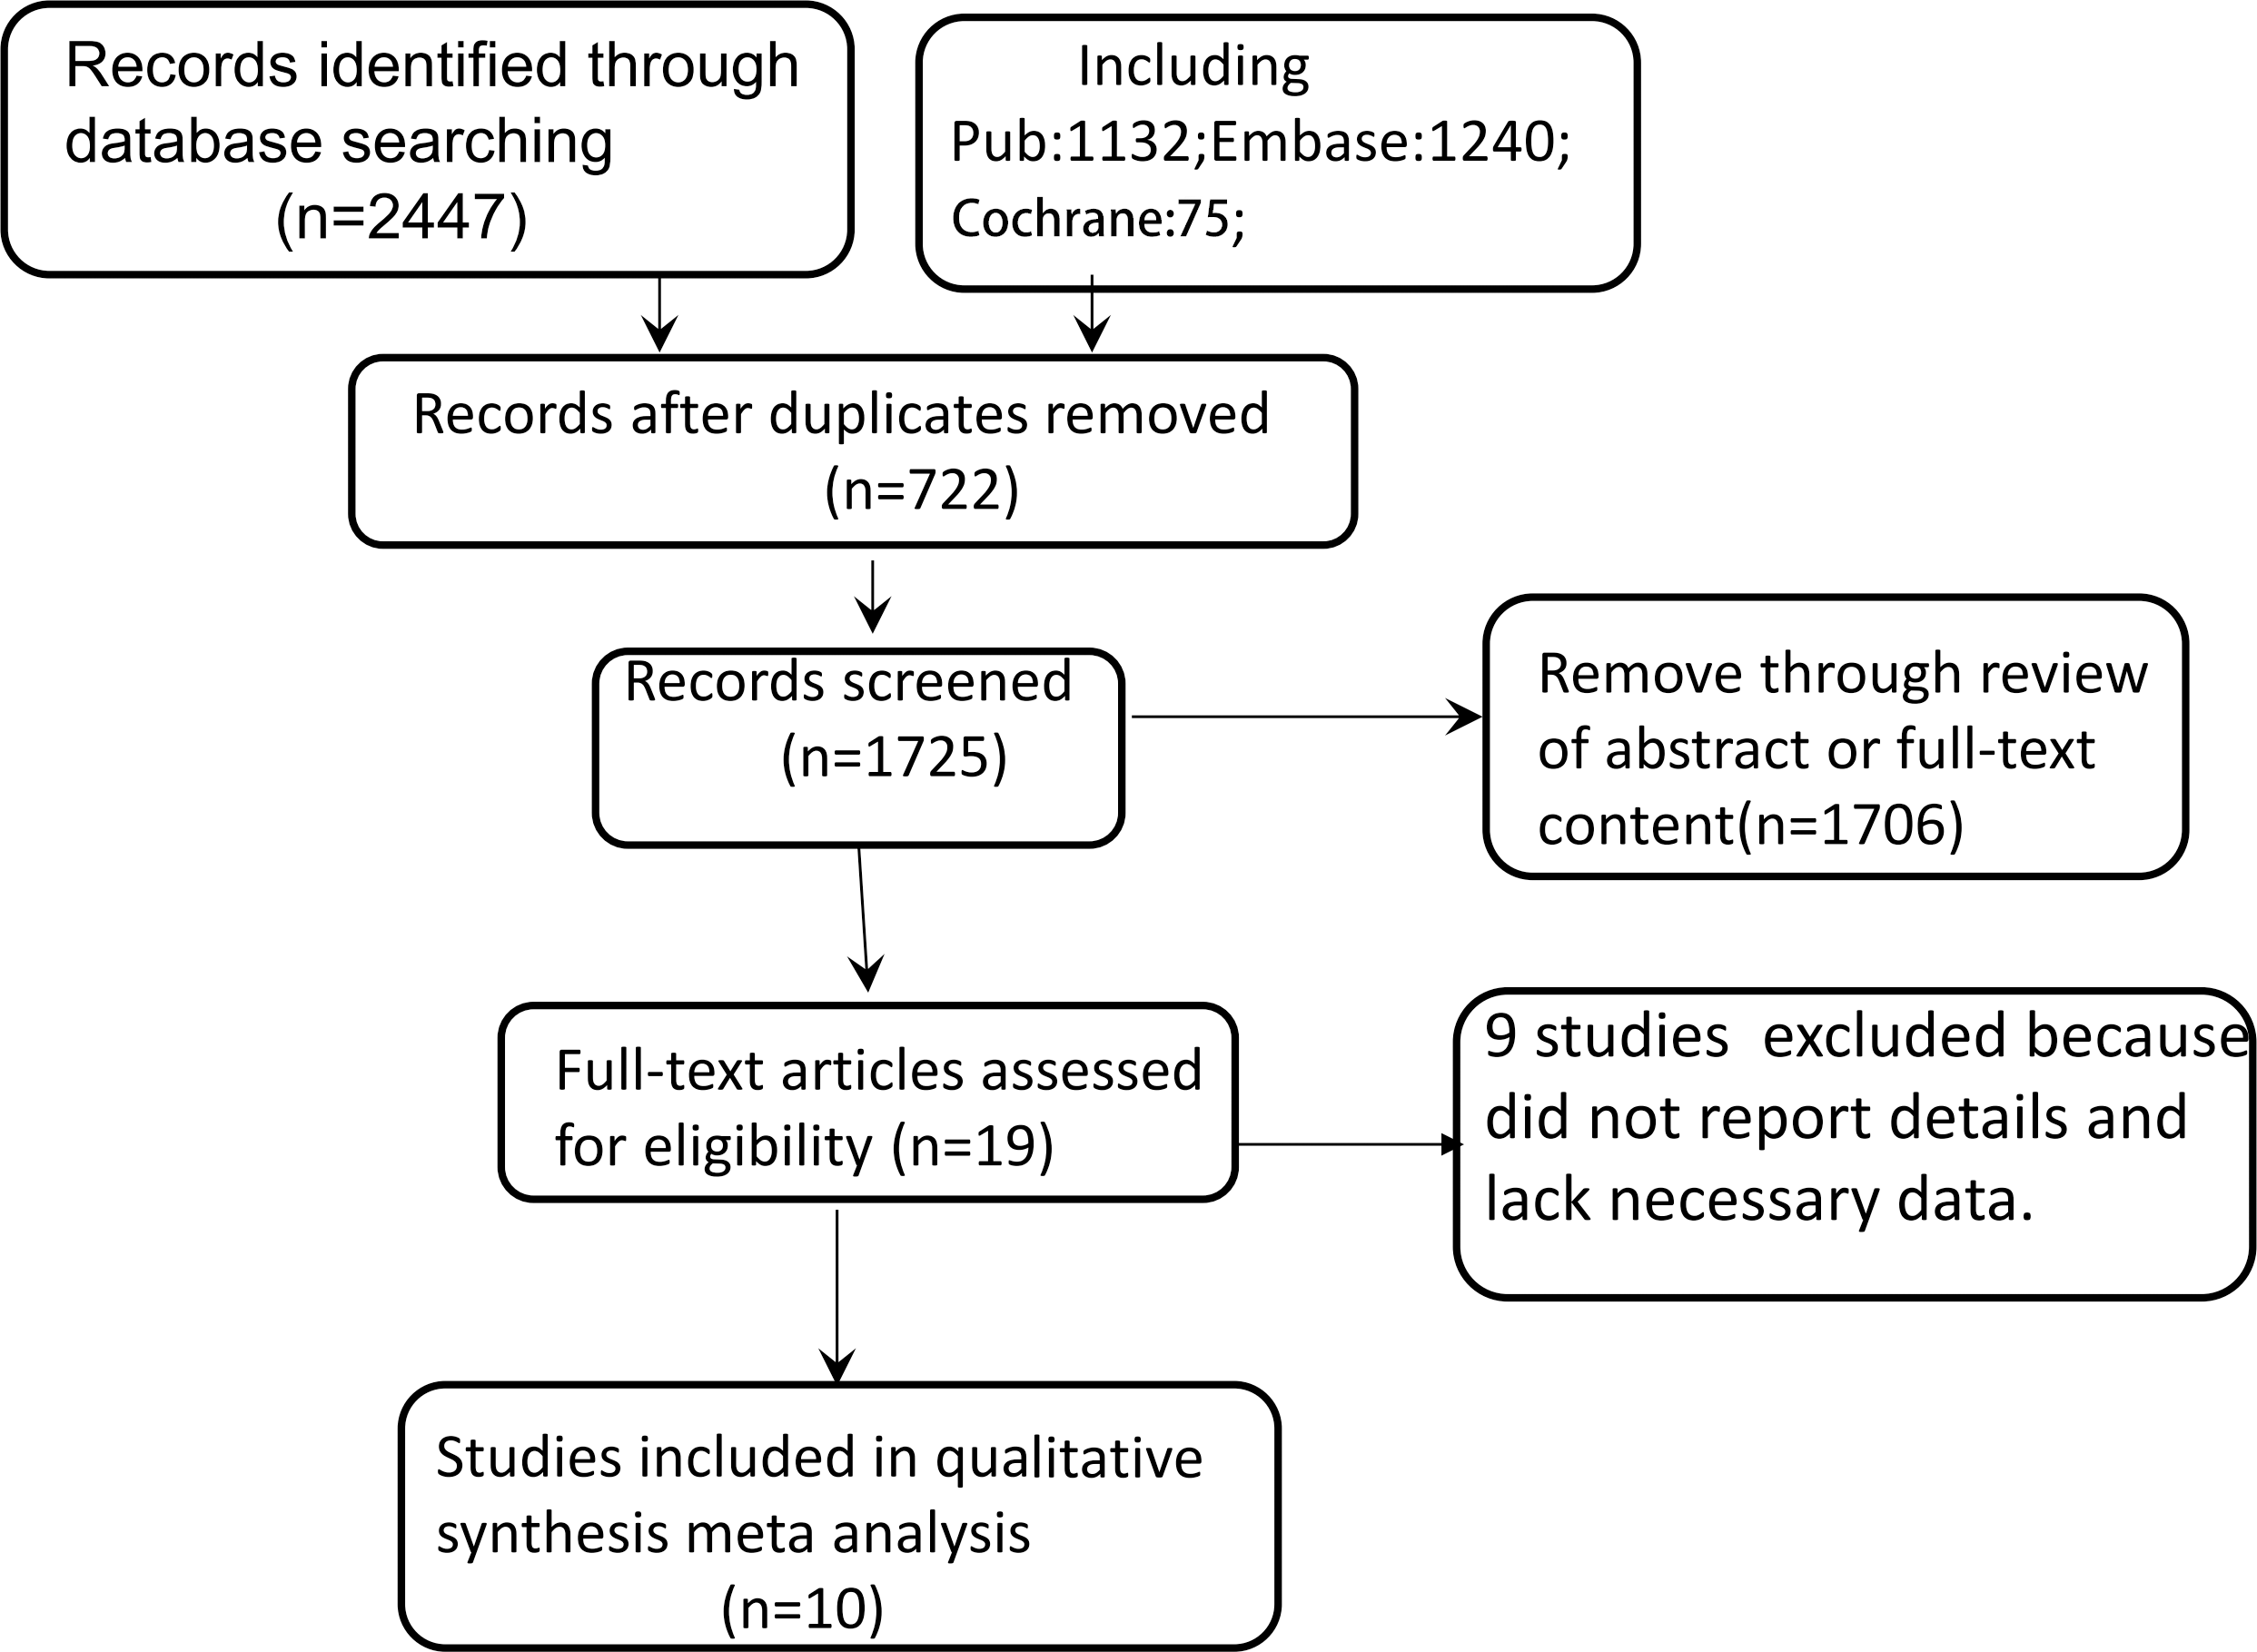
Figure 1 outlines the literature specific screening process. An electronic database search identified 2,447 citations.After removing 722 duplicate literatures, 19 articles were selected for full-text review to understand their relevance to this study after reading the literature abstracts. In the full-text review stage, nine studies excluded becausedid not report details andlack necessary data. Finally, 10 studies were included in the systematicreview. The consistency between researchers during thefull-text review phase was excellent.
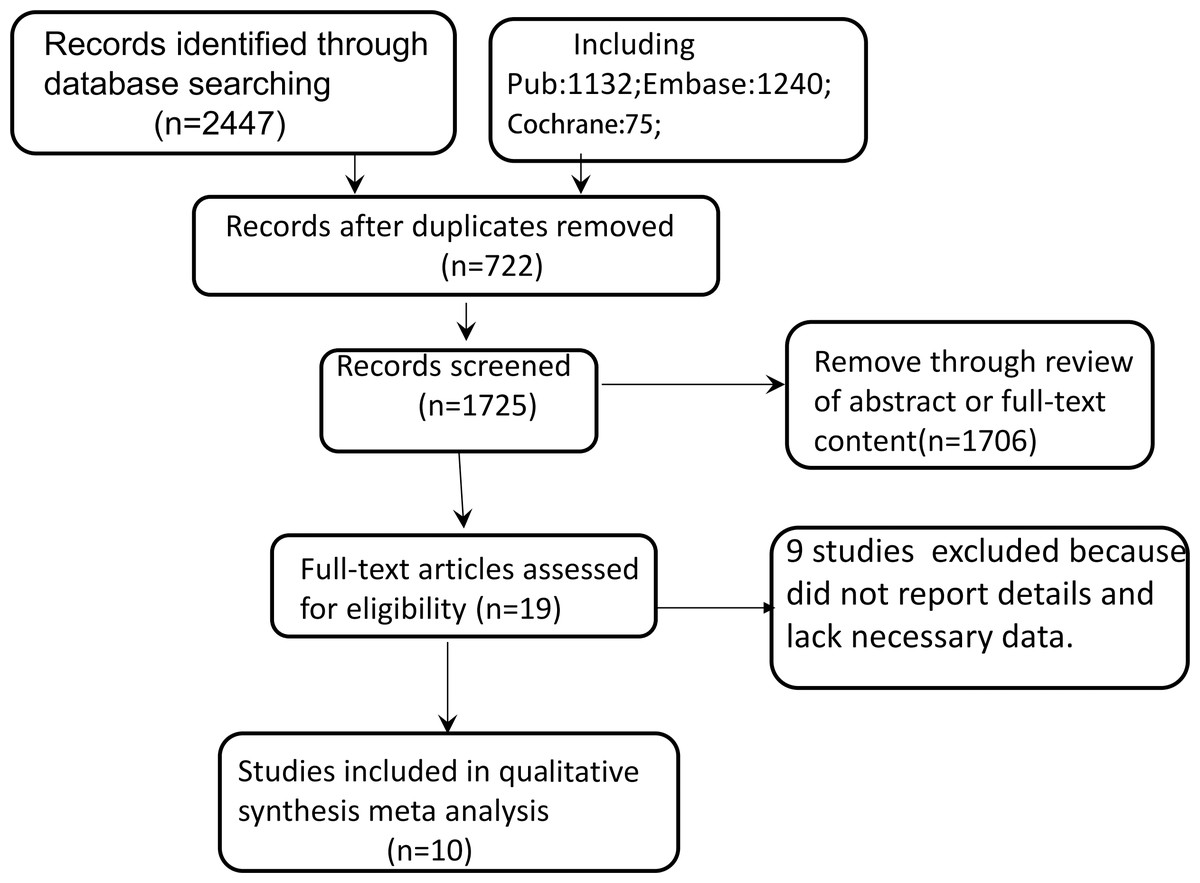
Figure 1: Flowchart of the study selection process.
Study characteristics
The characteristics of the 10 studies are shown in Table 1 (Menon et al., 2005; Menon et al., 2006; Monfared et al., 2014; Ye et al., 2016; Ye et al., 2017; Zhang et al., 2020; Chen et al., 2021; Liu & Chen, 2021; Shen, Zhang & Zhao, 2022; Wu et al., 2022). A total of 7,364 participants were included, The 10 studies included two randomized controlled trial and eight cross sectional studies, seven of which were conducted in Chinese people, two from America, and one from Iran with the subjects obtained from Patients with chronic kidney disease. According to NOS or AHRQ literature quality evaluation, the quality of two RCT studies and seven cross-sectional studies were higher (NOS > 6 or AHRQ ≥ 8). One cross-sectional study was of moderate quality (AHRQ = 7) (Table 1).
The subgroup analysis yielded a pooled standardized mean difference (SMD) of 0.46 with a 95% confidence interval (CI) of (0.4, 0.51), indicating a statistically significant difference in glomerular filtration rate (GFR) between CKD patients with high and normal homocysteine levels, where the former tend to have a lower GFR. Overall, the combined SMD across all studies was 2.26 (95% CI [1.37–3.15]), also showing a significant difference between the relevant groups. However, there was a highly significant heterogeneity among studies (P < 0.01, I2 = 99.5%), meaning that 99.5% of the variation in effect sizes is attributed to differences in study features, populations, or methodologies rather than sampling error (Fig. 2).
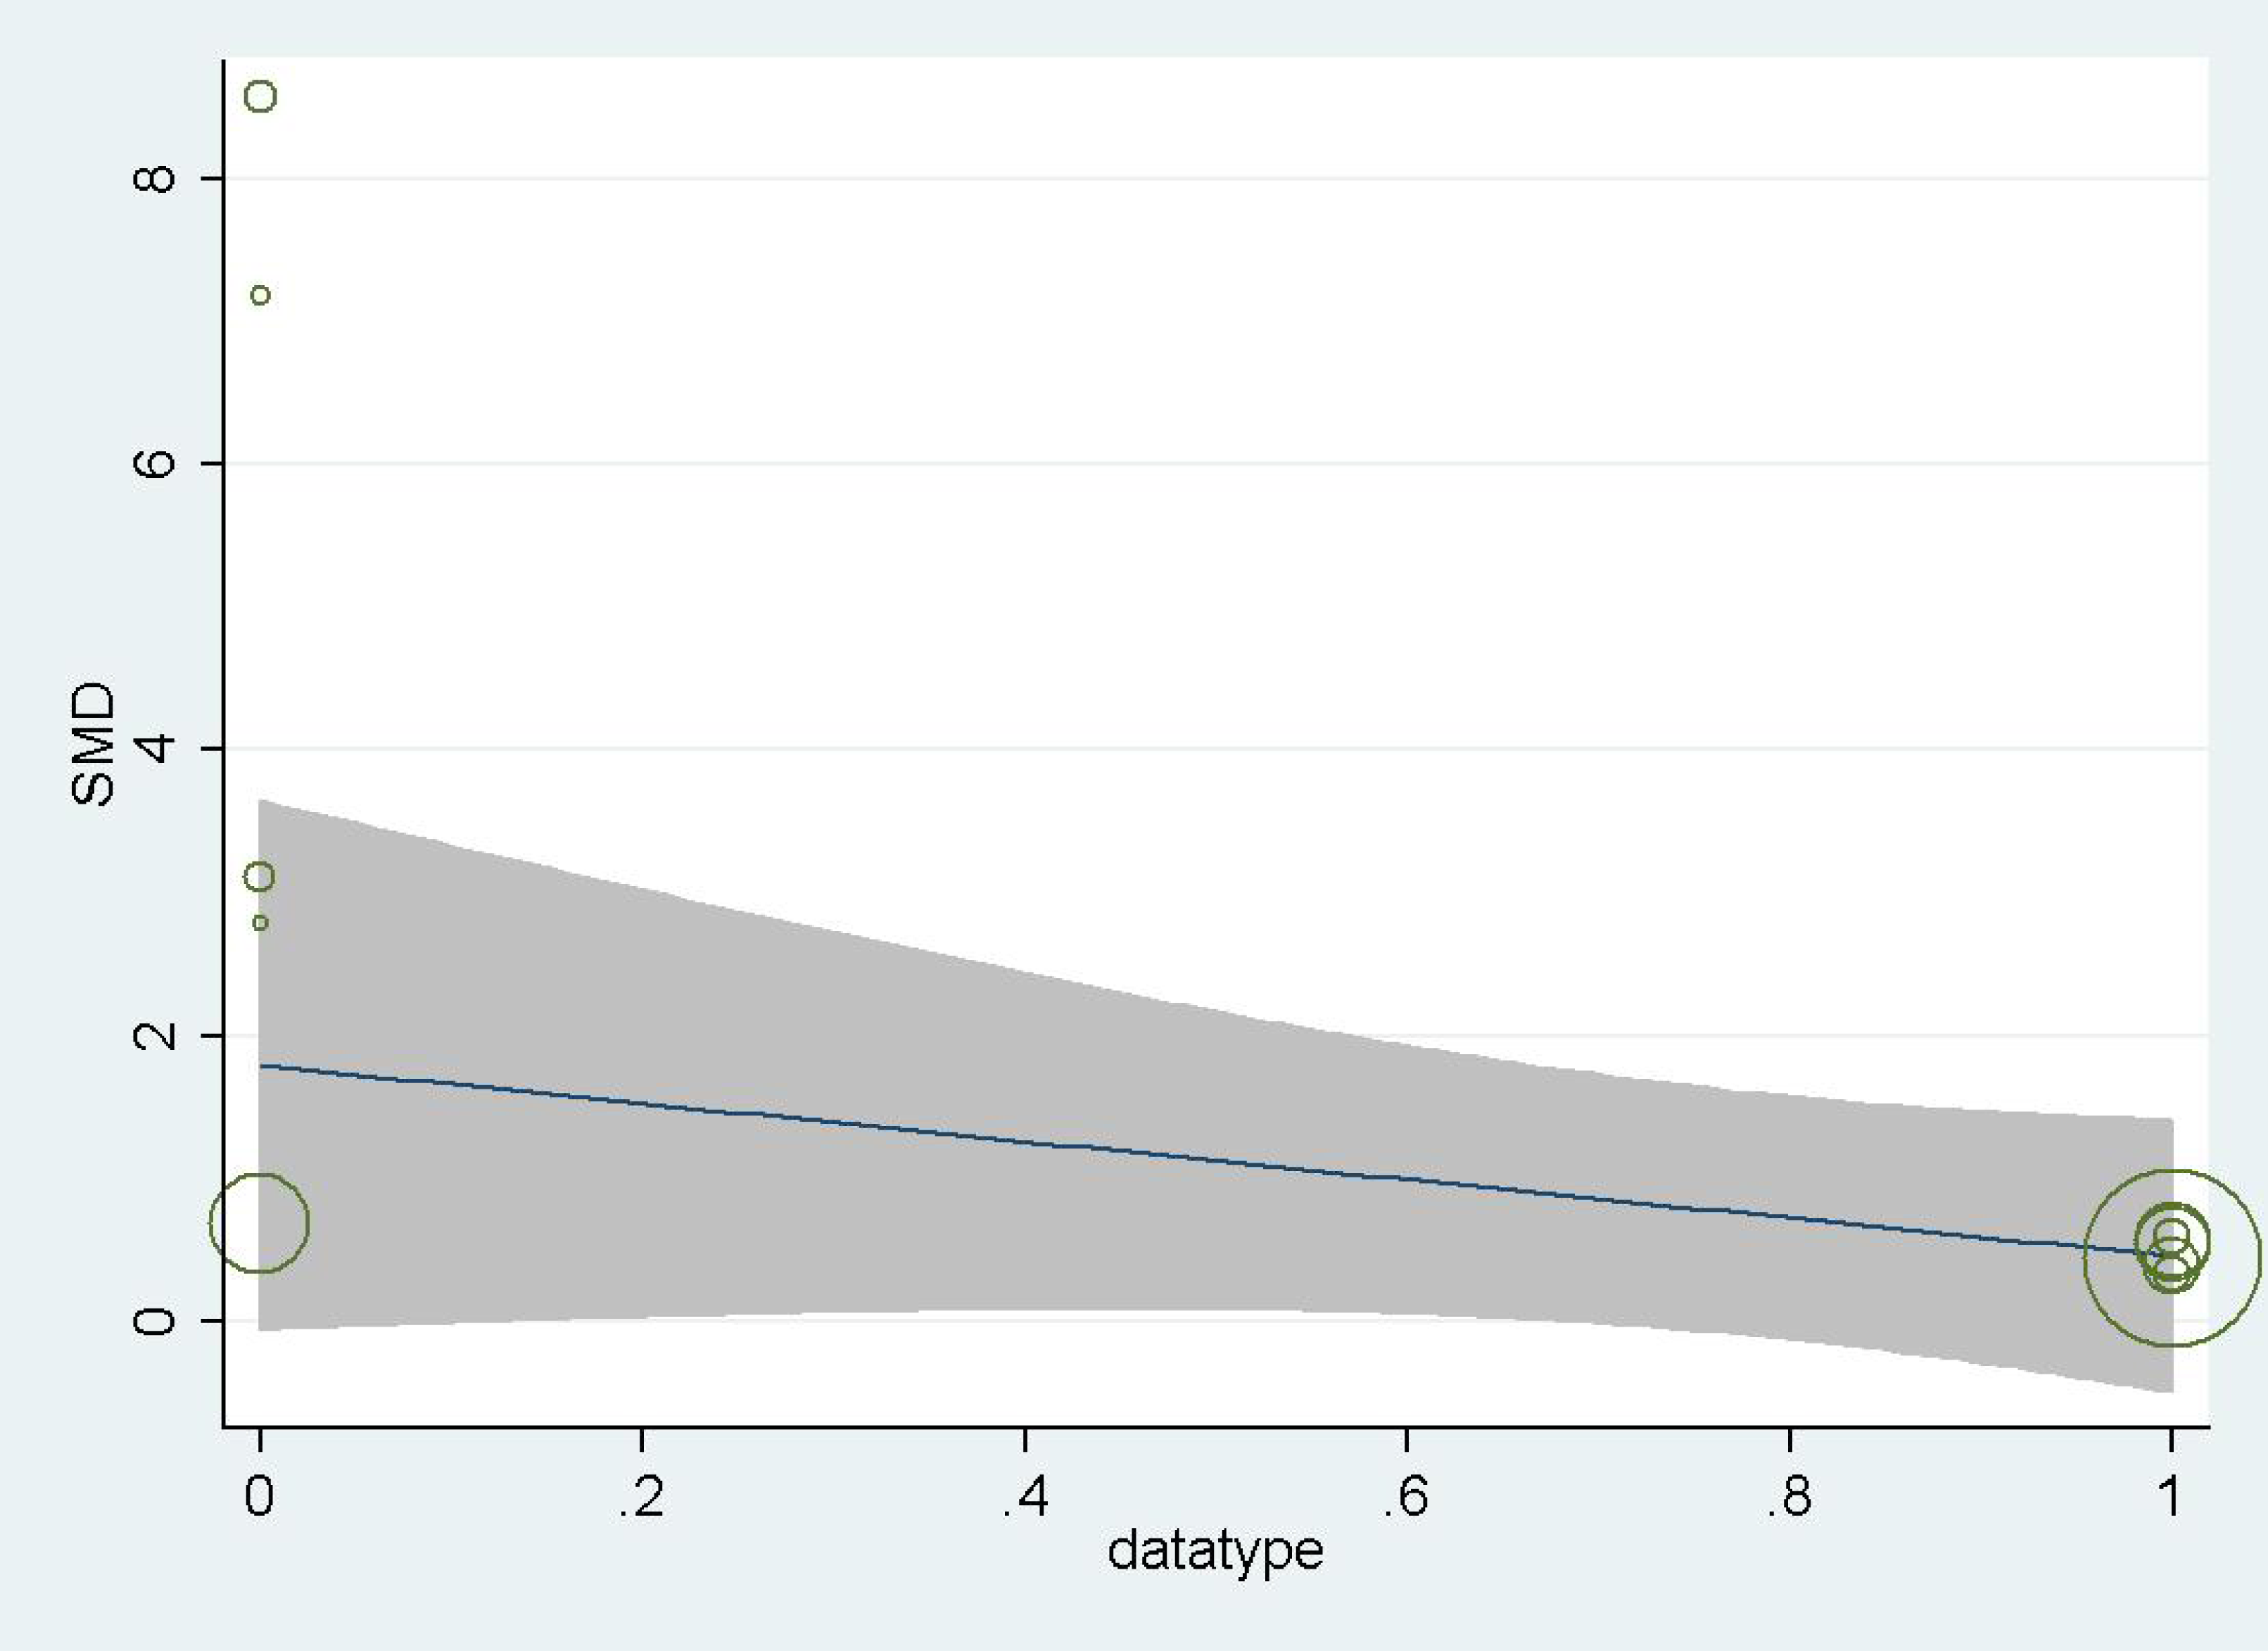
In order to further explore the source of heterogeneity, we found that the mean of Ye, Z 2016, Ye, Z 2017, and Zhang, Y 2020 were converted from quartiles. Shen, Z 2022, Wu, and J 2022 were diabetes-related CKD with a single cause. The data were not representative, so we grouped these five articles into a subgroup for subgroup analysis, and found that the heterogeneity could be eliminated after removing these 5 articles (P = 0.52 I2 = 0.00%). For further confirmation, we performed regression analysis and found that these 5 articles were the source of heterogeneity (P = 0.015 < 0.05) (Fig. 3). We also made a sensitivity analysis graph showing that the exclusion of a single article had little effect on the total effect size (Fig. 4).
| Author/ year |
Country | Study type | Population (H/C) |
Age (year) |
HHcy (umol/L) |
GFR (Mean ± sd) (H/C) |
Quality evaluation NOS or AHRQ |
|---|---|---|---|---|---|---|---|
| Menon et al. (2005) | America | Randomized controlled trial | 559 (310/249) |
18–70 | >15 | 36.6 ± 8.4 41.4 ± 8.8 |
High |
| Menon et al. (2005) | America | Randomized controlled trial | 245 (207/38) |
18–70 | >15 | 18.4 ± 3.4 19.5 ± 3.2 | High |
| Menon et al. (2006) | America | Randomized controlled trial | 536 (268/268) |
52 ± 12 | ≥14.7 | 32.69 ± 11.18 38.72 ± 11.22 | High |
| Monfared et al. (2014) | Iran | Cross sectional study |
148 (104/44) |
44.07 ± 11.52 | ≥12 | 67.17 ± 16.35 77.75 ± 21.73 | High |
| Ye et al., (2016a) | China | Cross sectional study |
1,042 (550/492) |
14–75 | ≥15 | 11.63 ± 5 87.68 ± 11.77 |
High |
| Ye et al. (2017) | China | Cross sectional study |
289 (90/199) |
14–75 | ≥15 | 39.11 ± 10.01 109.77 ± 9.75 |
High |
| Zhang et al. (2020) | China | Cross sectional study |
54 (27/27) |
37.02 ± 11.04 | >13.01 | 74.23 ± 8.75 100.52 ± 10.08 |
High |
| Chen et al. (2021) | China | Cross sectional study |
5,917 (153/153) |
19∼82 | ≥11.6 | 103.04 ± 21.44 111.01 ± 20.21 |
High |
| Liu & Chen (2021) | China | Cross sectional study |
2,969 (1,509/1,460) |
58 ± 7 | >11.7 | 83 ± 20 91 ± 17 |
High |
| Shen, Zhang & Zhao (2022) | China | Cross sectional study |
1,018 (417/601) |
59.9 ± 13.1 | >10 | 69.0 ± 40.1 94.3 ± 35.1 | High |
| Wu et al. (2022) | China | Cross sectional study |
198 (95/103) |
>18 | >15 | 47.53 ± 8.76 75.11 ± 8.97 |
Medium |
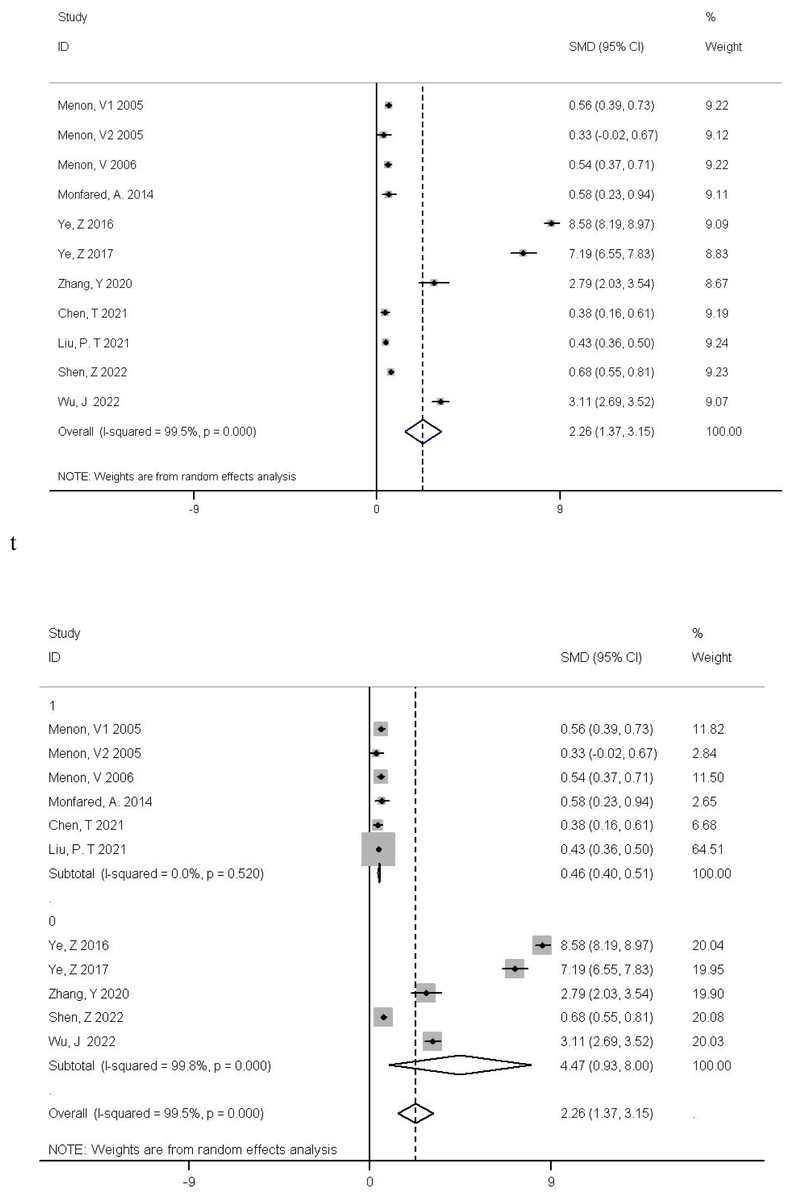
Figure 2: The relationship between Hcy level and GFR was investigated by meta-analysis of Forest-plot studies.
Menon et al., 2005; Menon et al., 2006; Monfared et al., 2014; Ye et al., 2016; Ye et al., 2017; Zhang et al., 2020; Chen et al., 2021; Liu & Chen, 2021; Shen, Zhang & Zhao, 2022; Wu et al., 2022.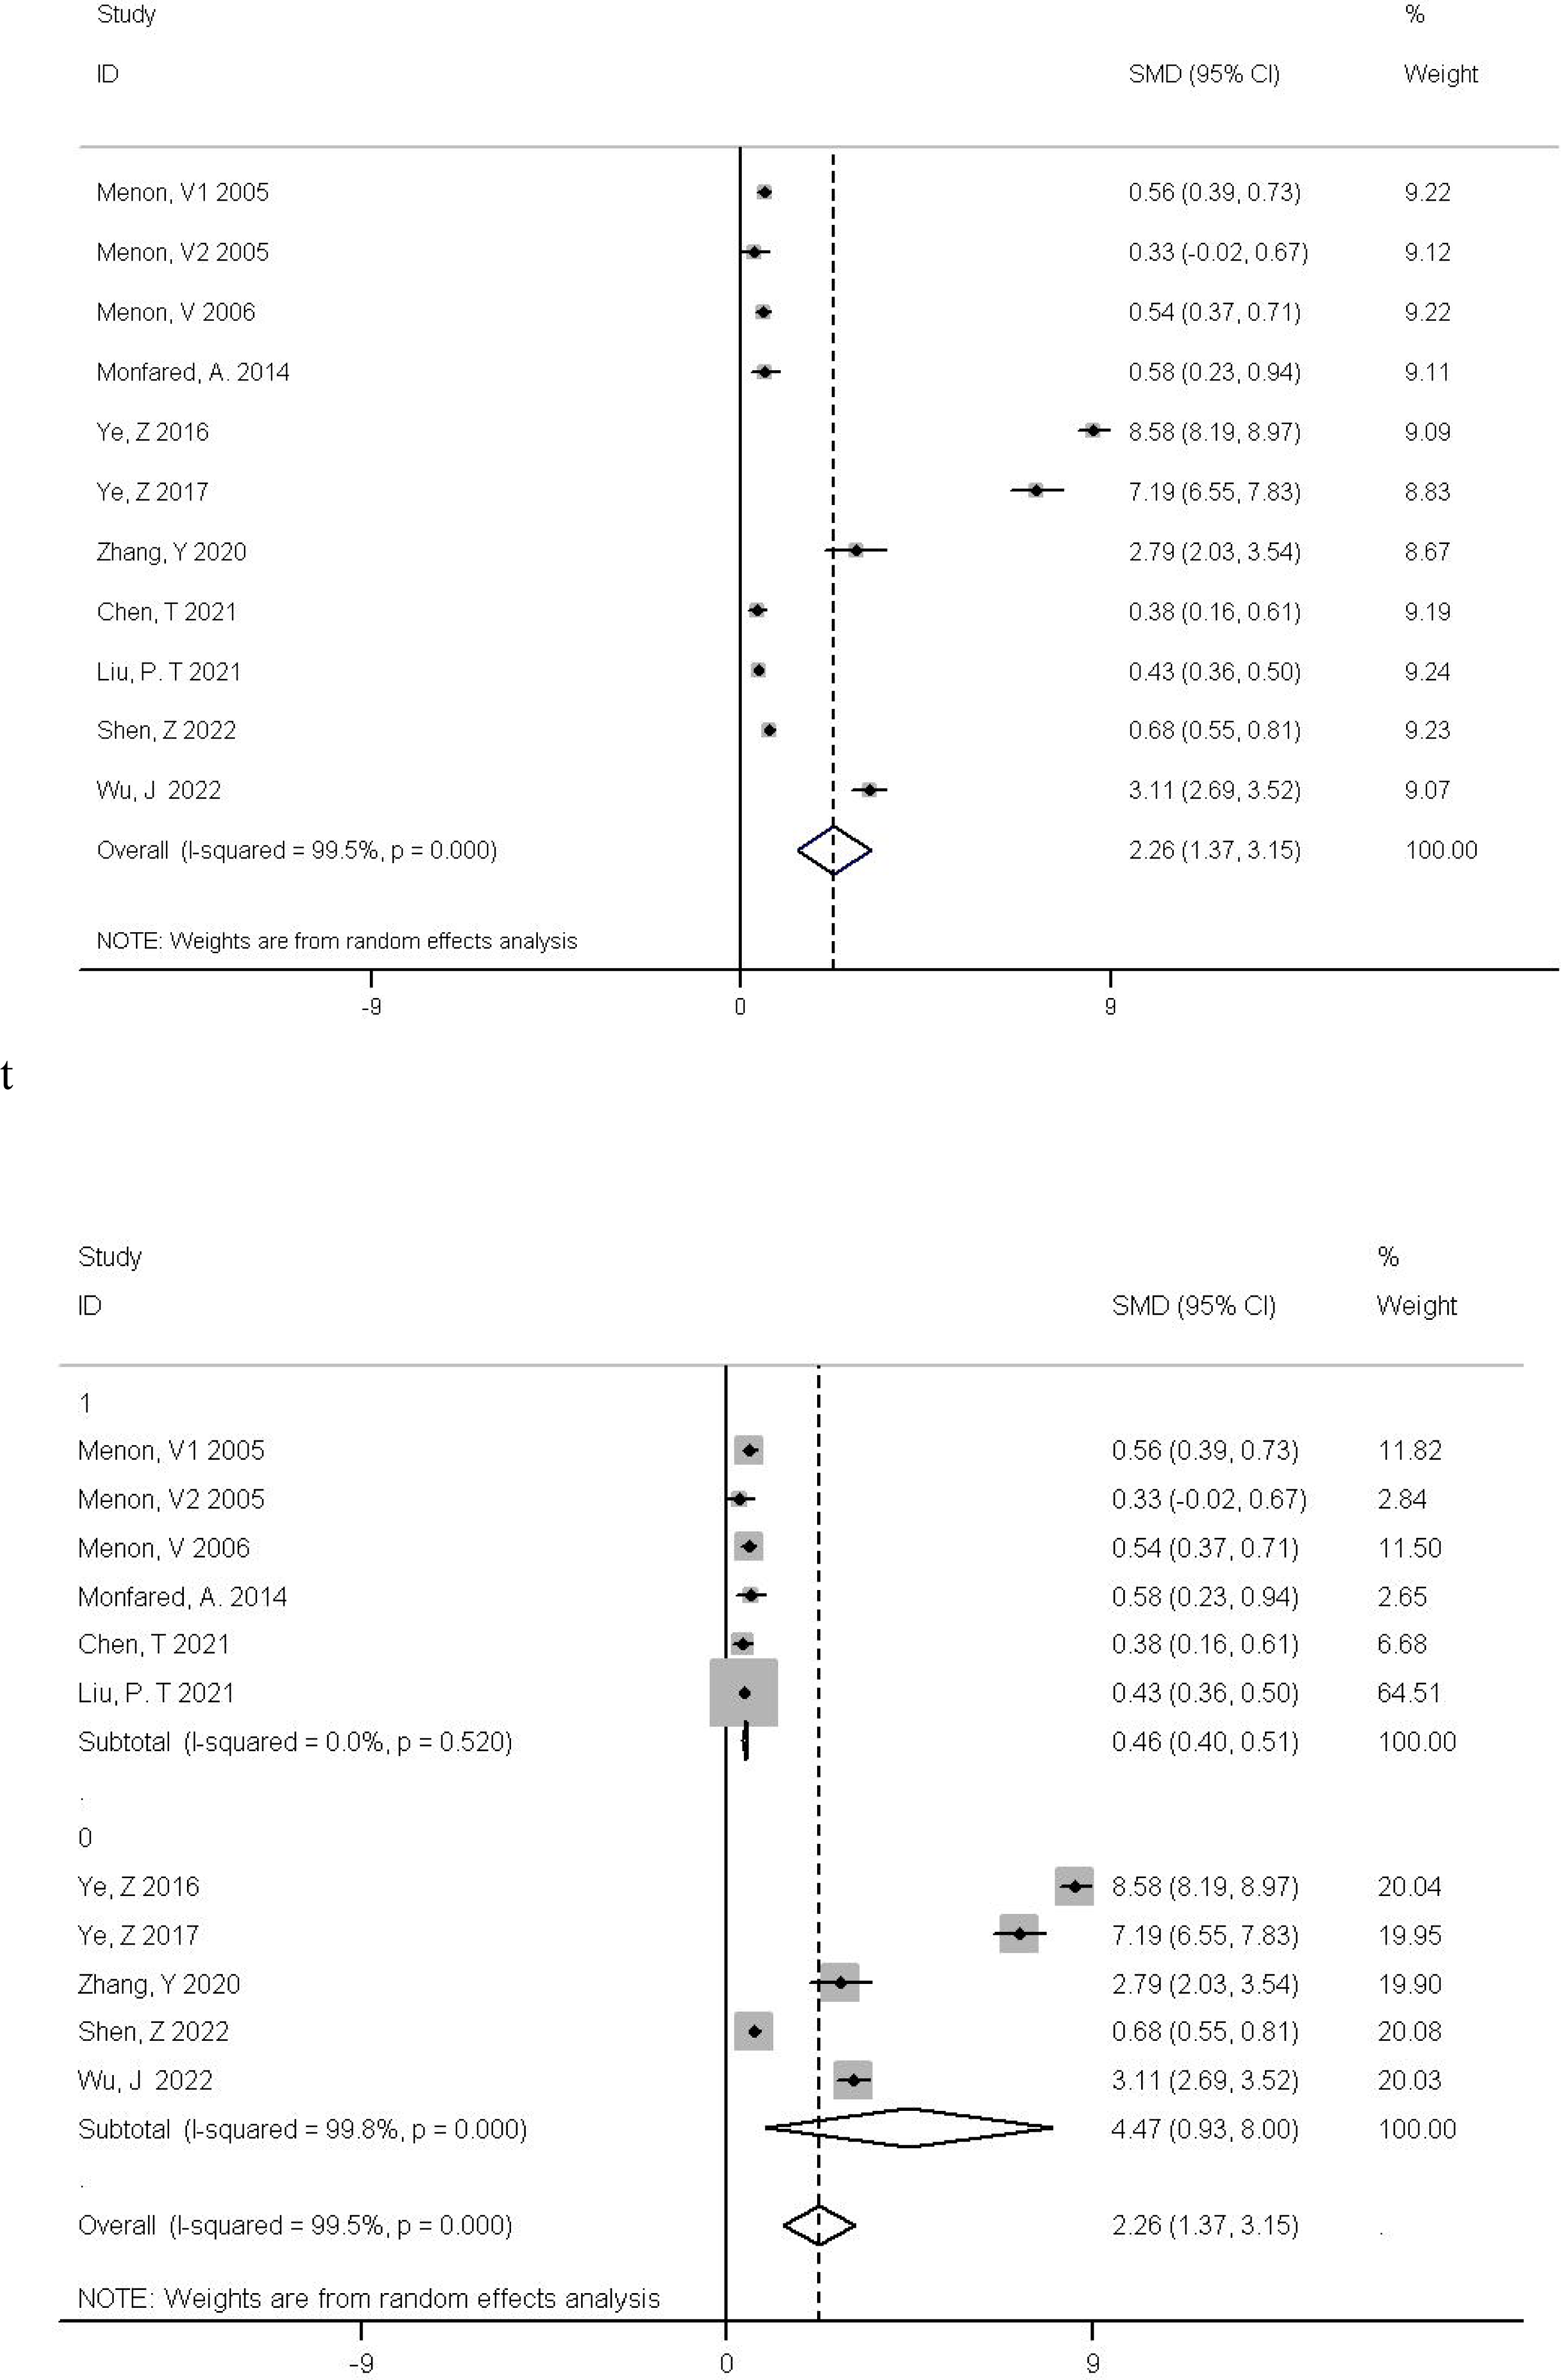
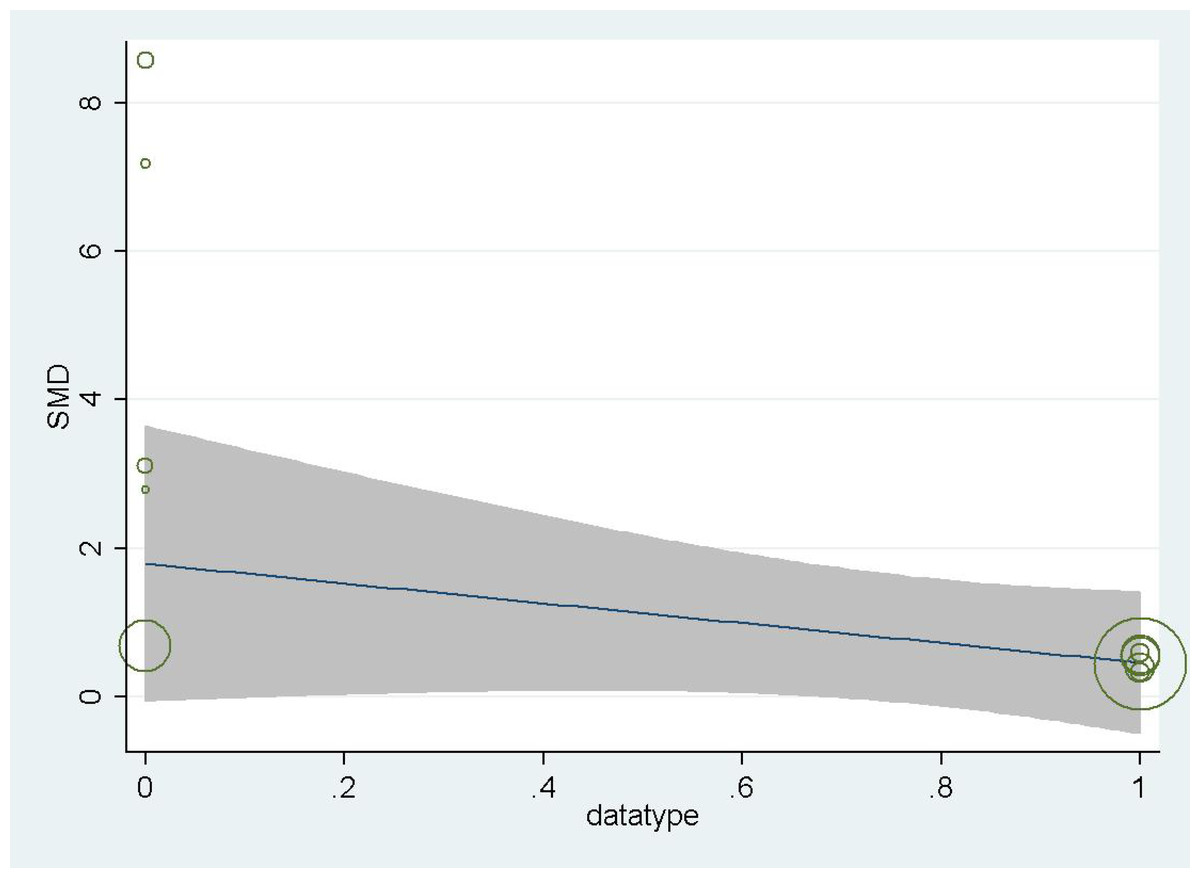
Figure 3: Meta-analysis forest plot for subgroup analysis by study category (0 for a cross-sectional study, 1 for a cohort study).
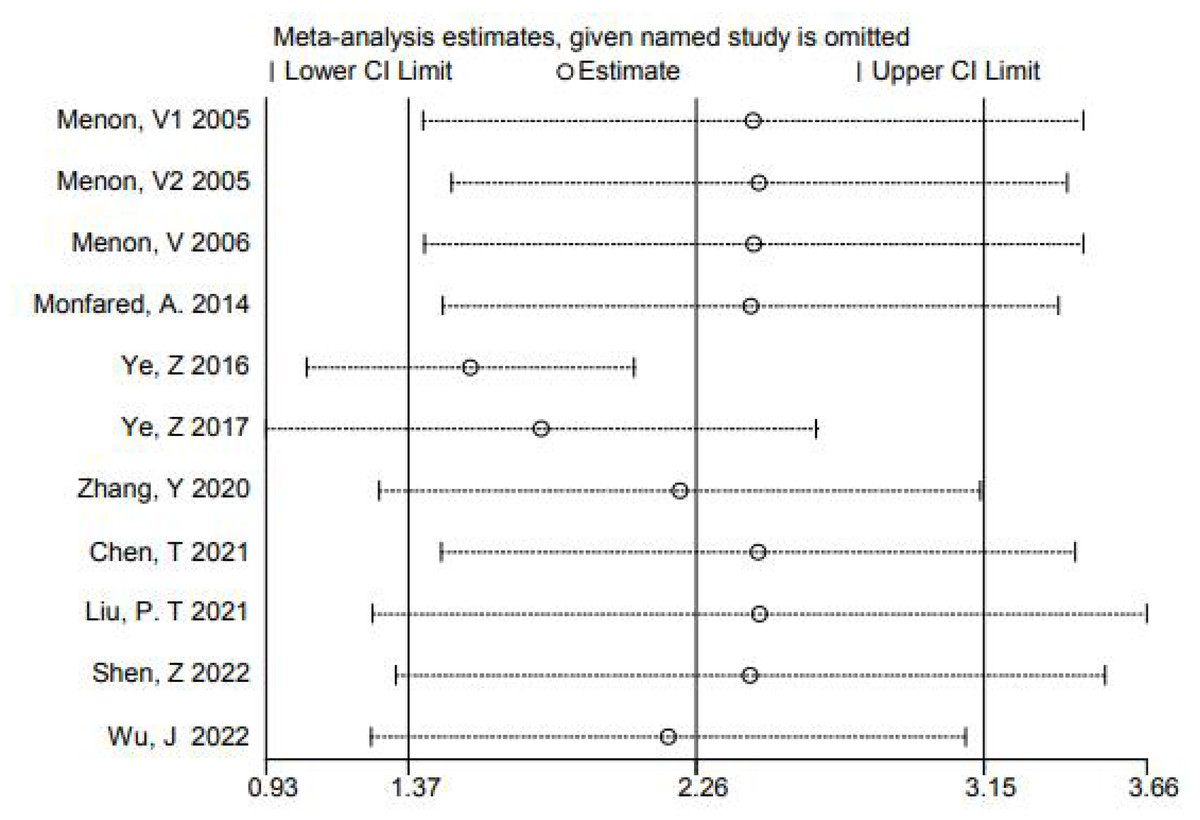
Figure 4: Sensitivity analysis chart studies.
Menon et al., 2005; Menon et al., 2006; Monfared et al., 2014; Ye et al., 2016; Ye et al., 2017; Zhang et al., 2020; Chen et al., 2021; Liu & Chen, 2021; Shen, Zhang & Zhao, 2022; Wu et al., 2022.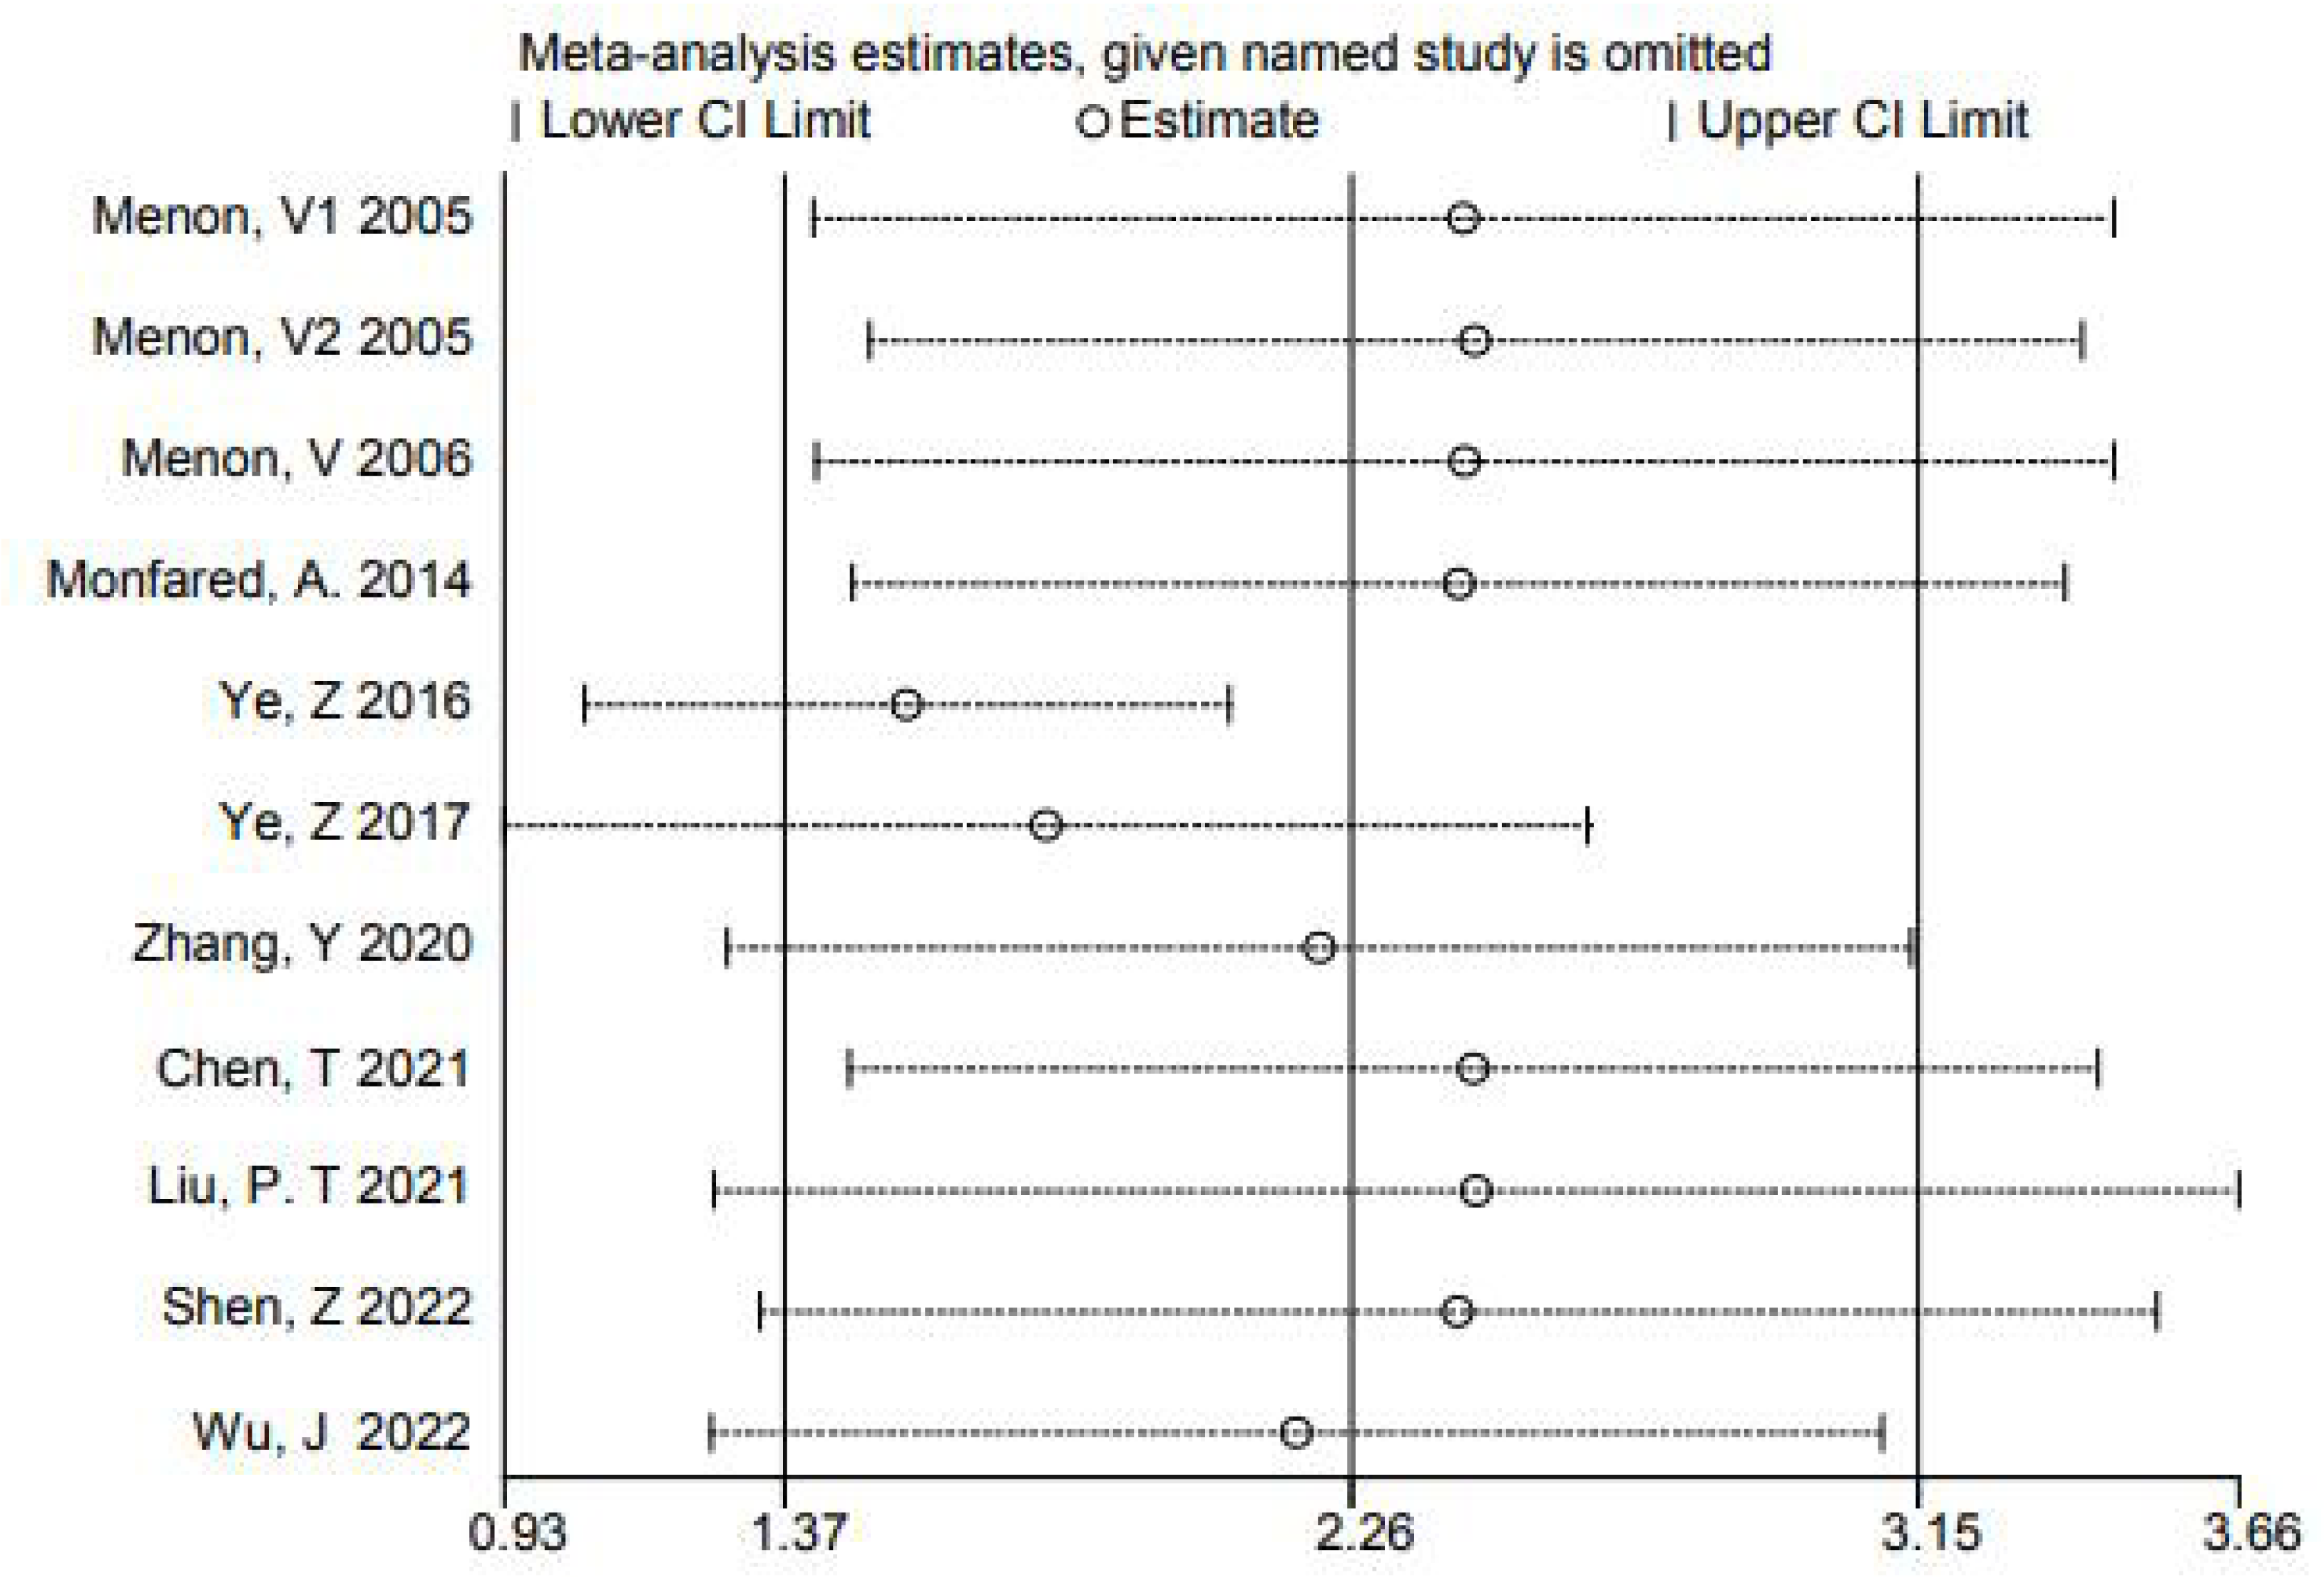
Publication bias
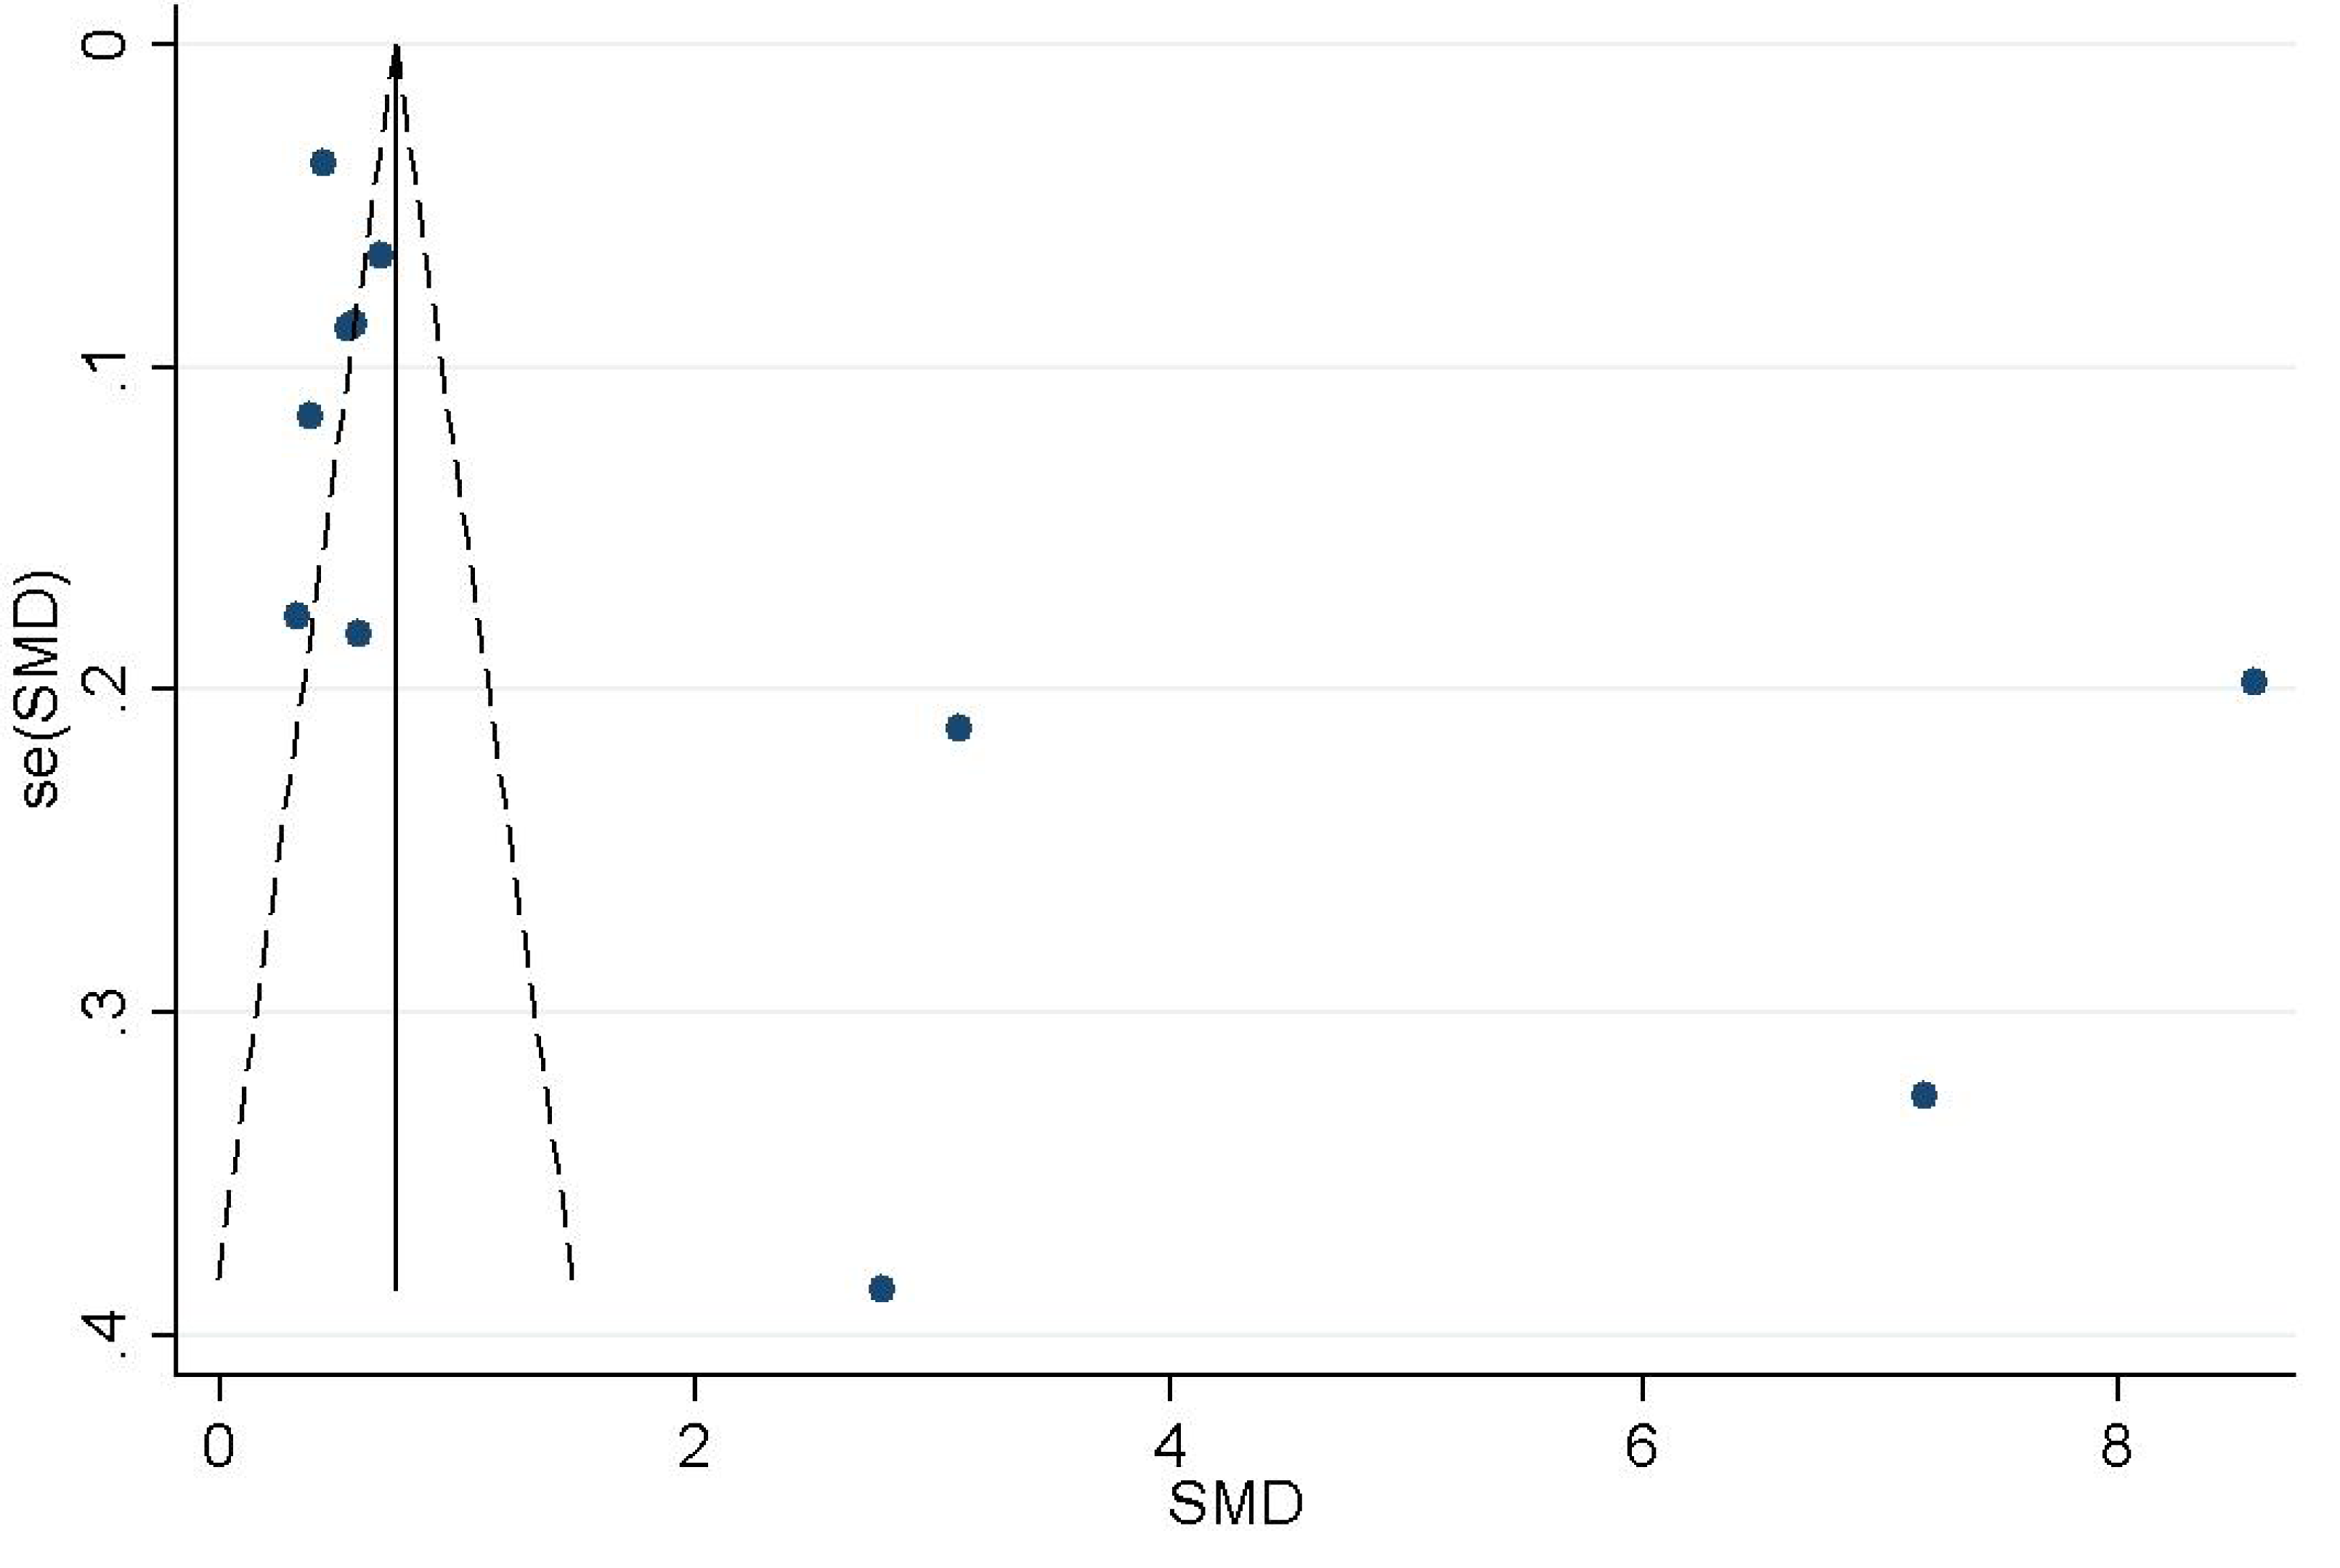
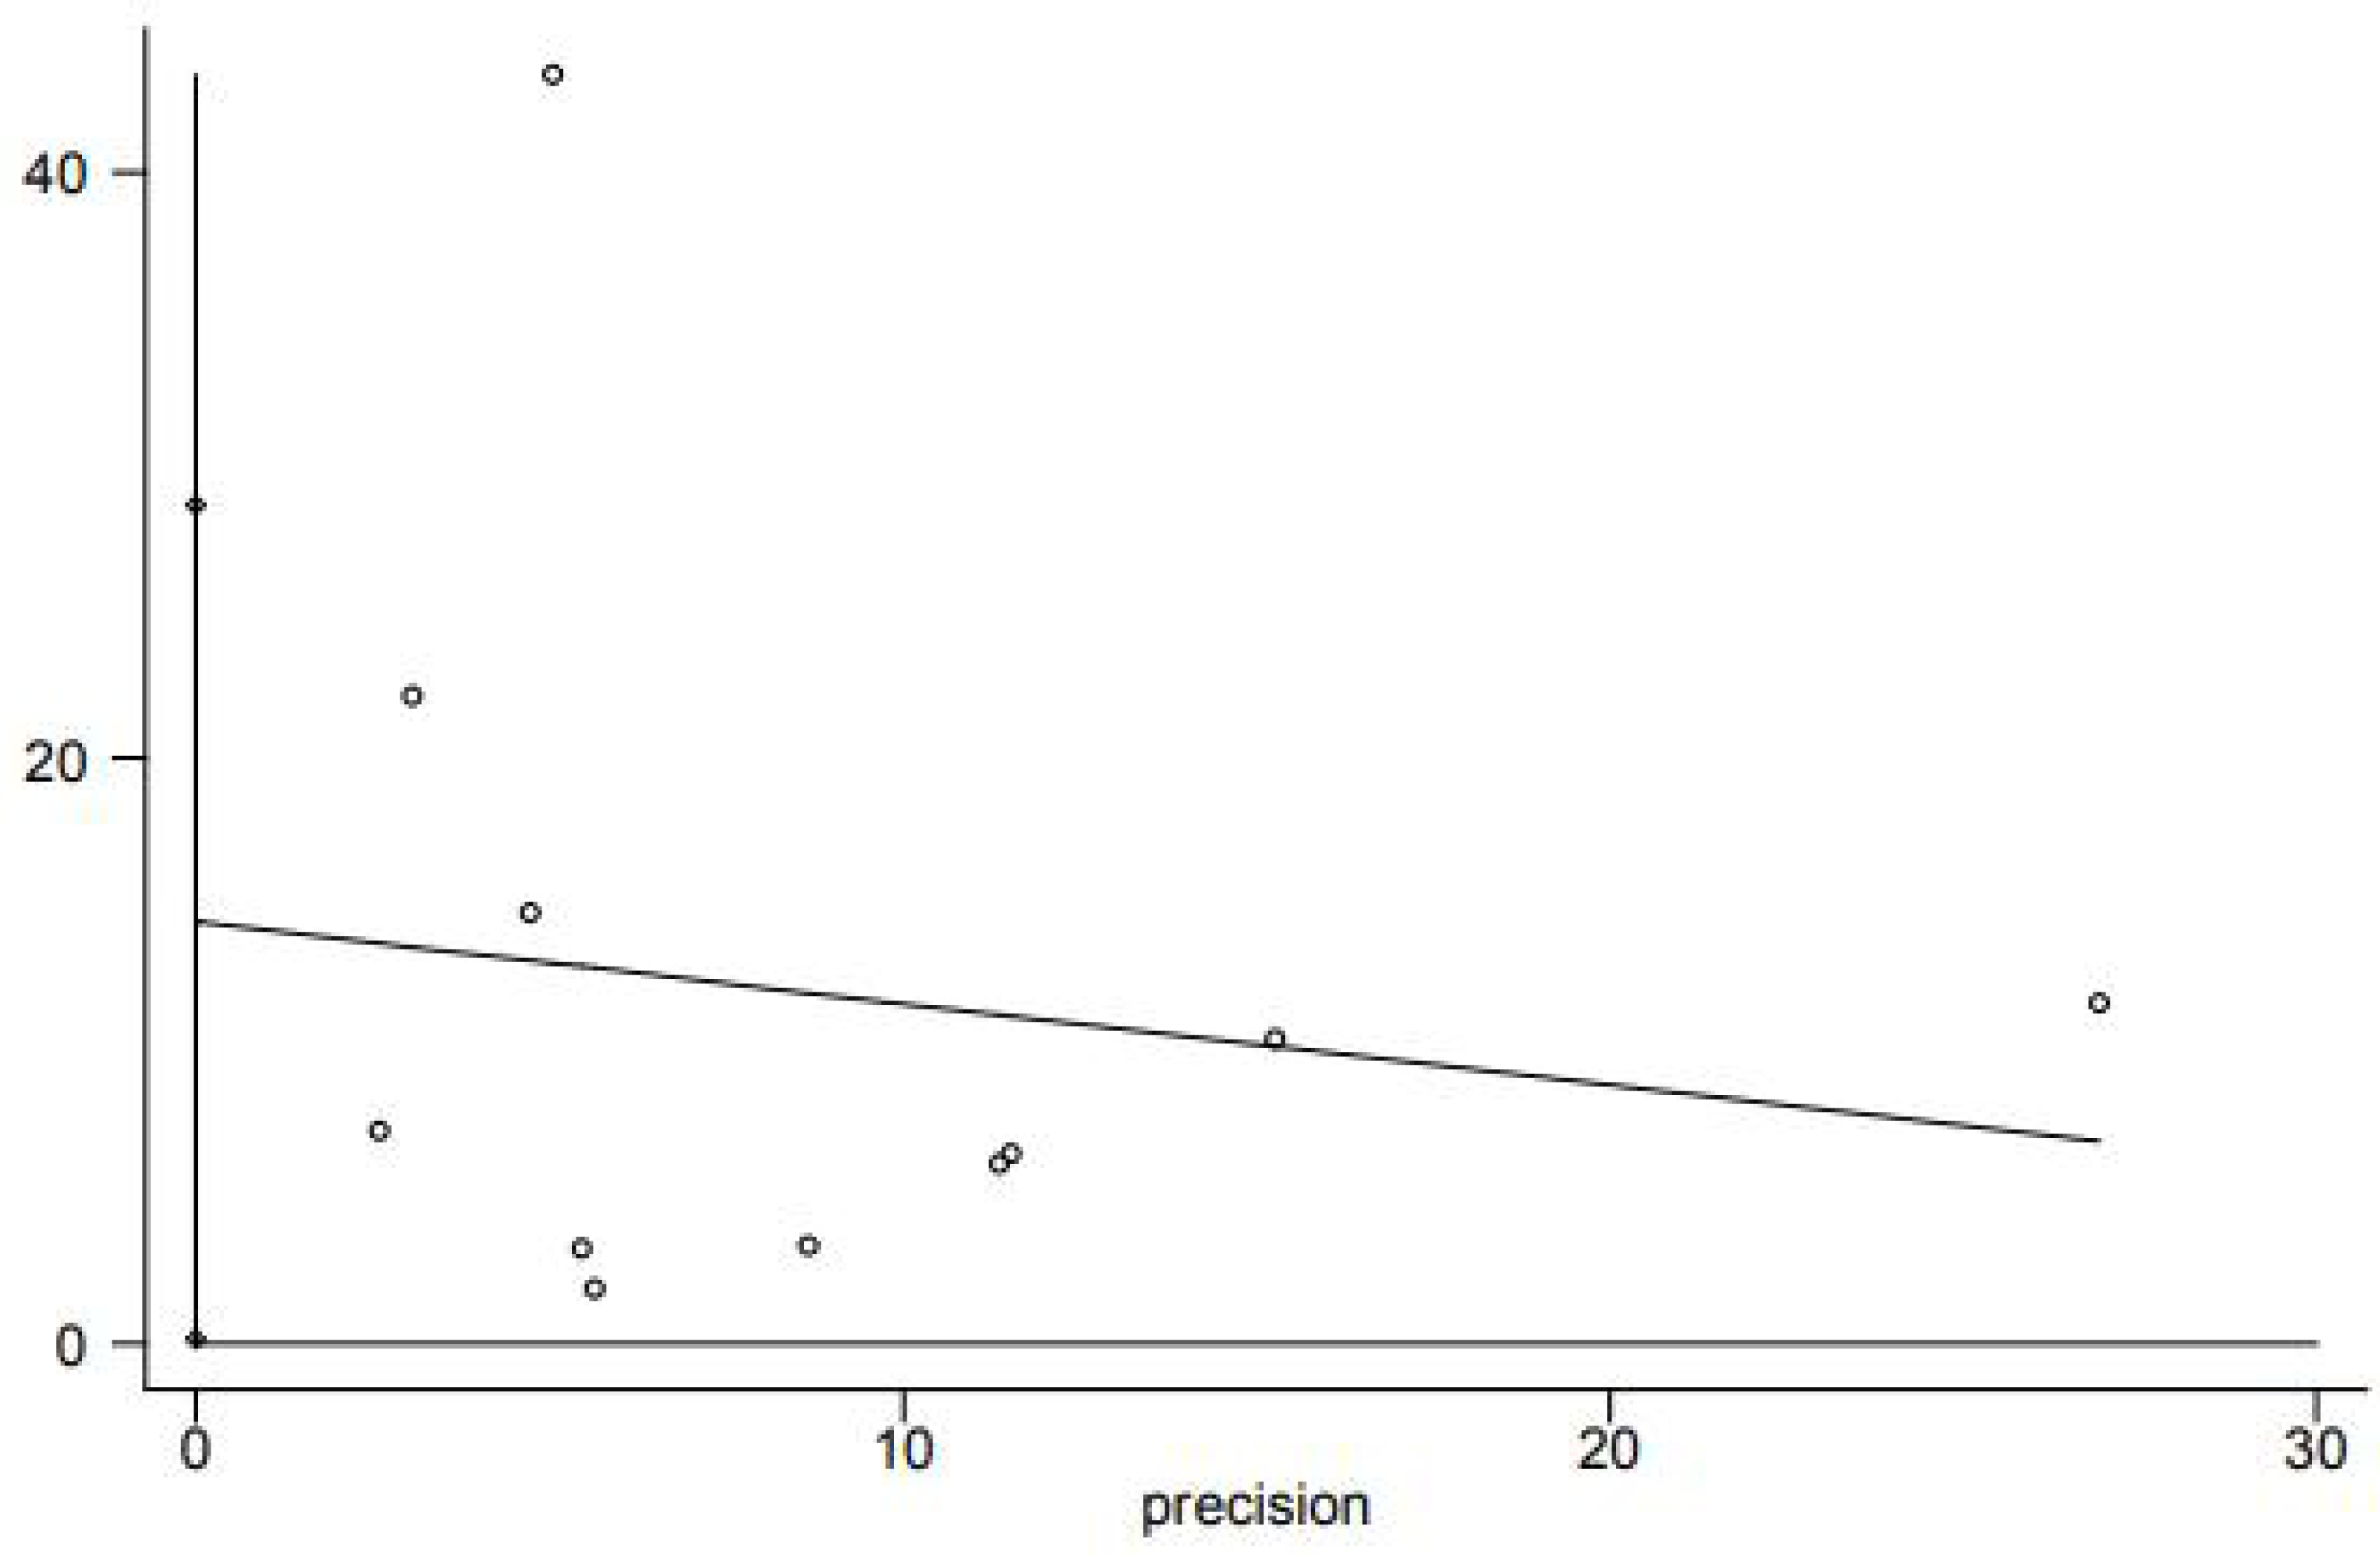
Funnel plot analysis qualitatively revealed the asymmetrical shape (Fig. 5), suggesting that the association between homocysteine levels and GFR decline may be influenced by publication bias. Egger tests showed publication bias (P < 0.05) (Fig. 6). In order to determine whether the total effect results are stable, the scissors graph is used for analysis. Results are stable (P < 0.01) (Fig. 7).
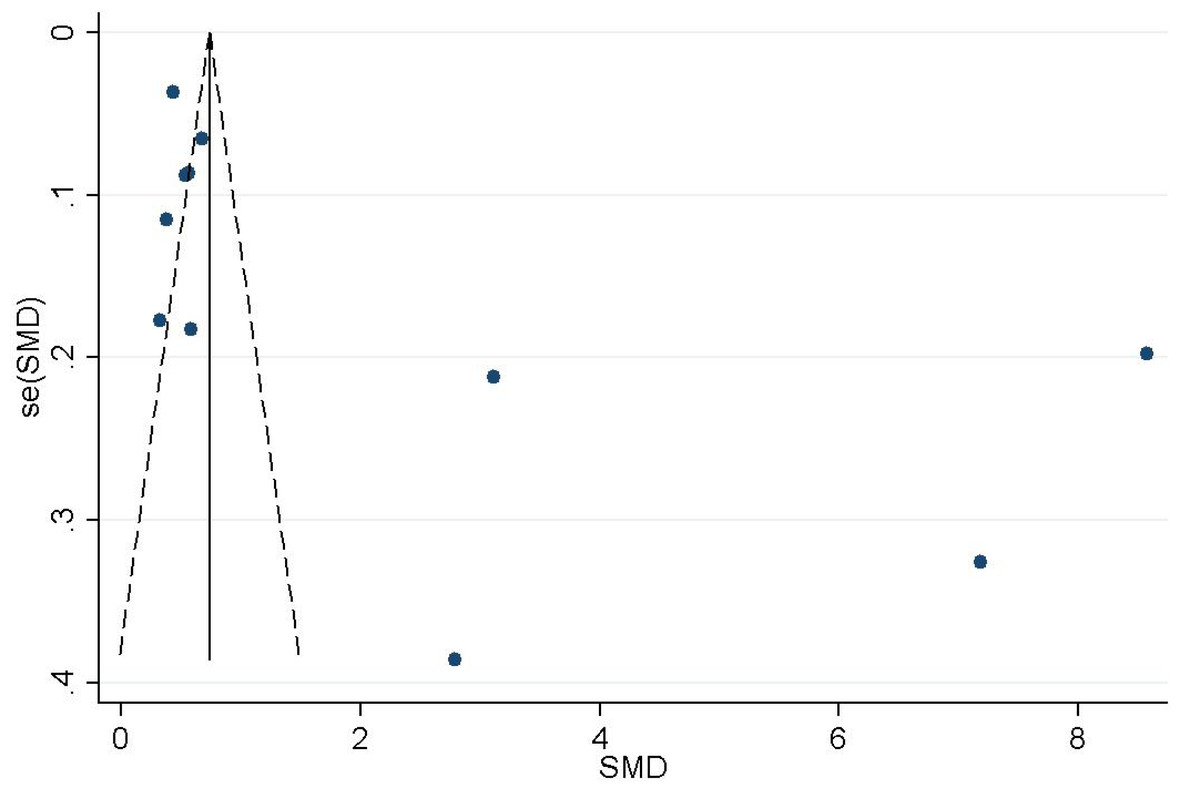
Figure 5: Funnel plot of the association between Hcy and GFR.
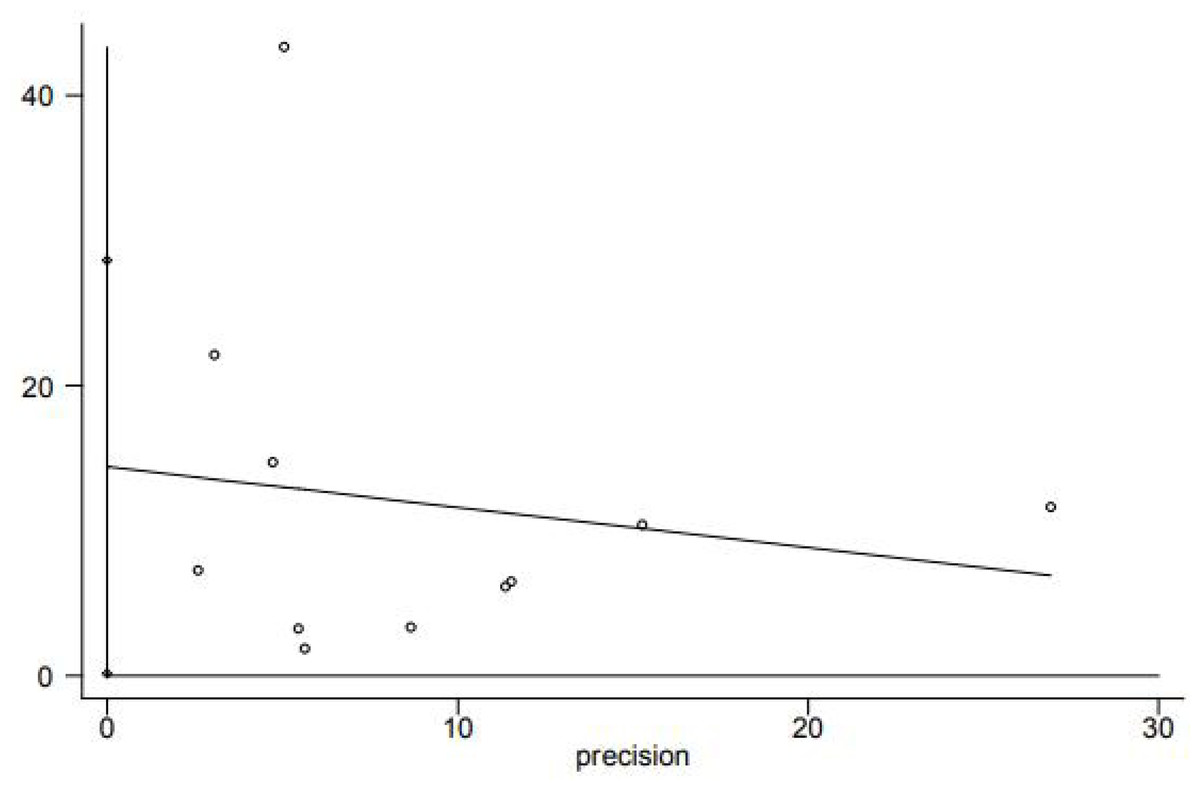
Figure 6: Egger’s publication bias plot.
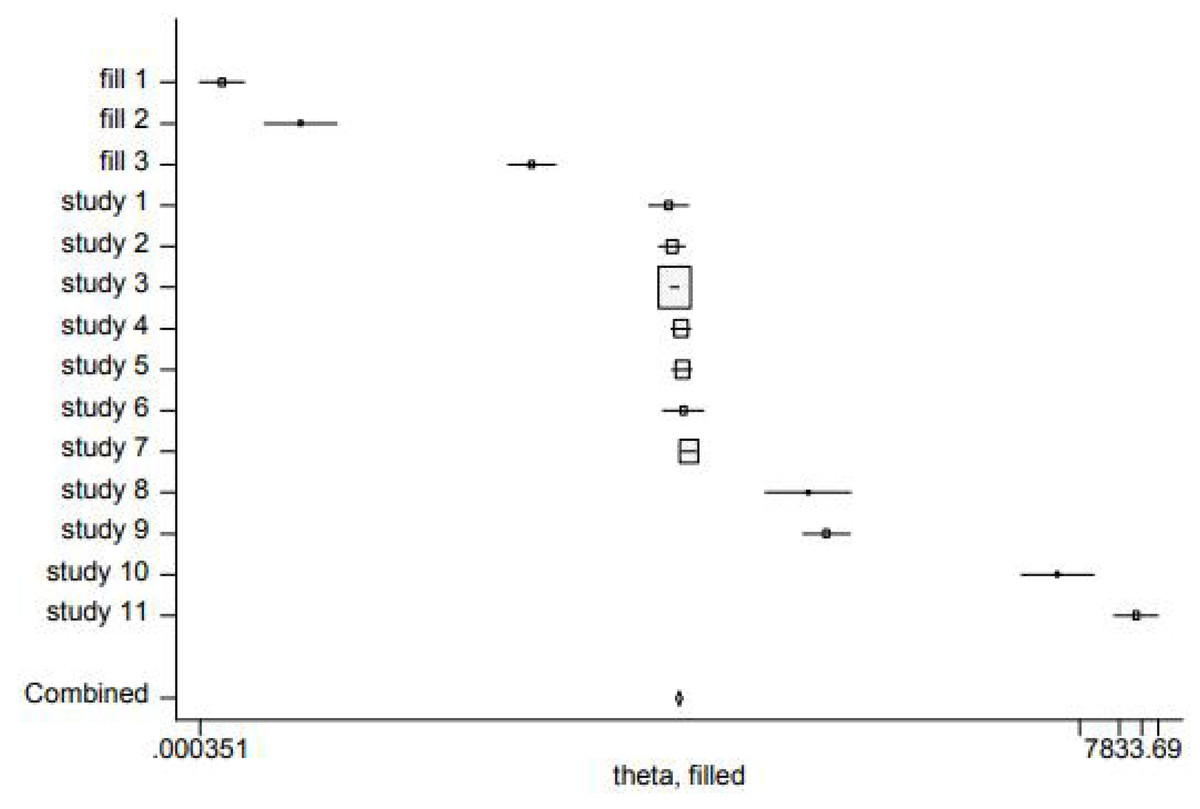
Figure 7: Trimming and filling chart.
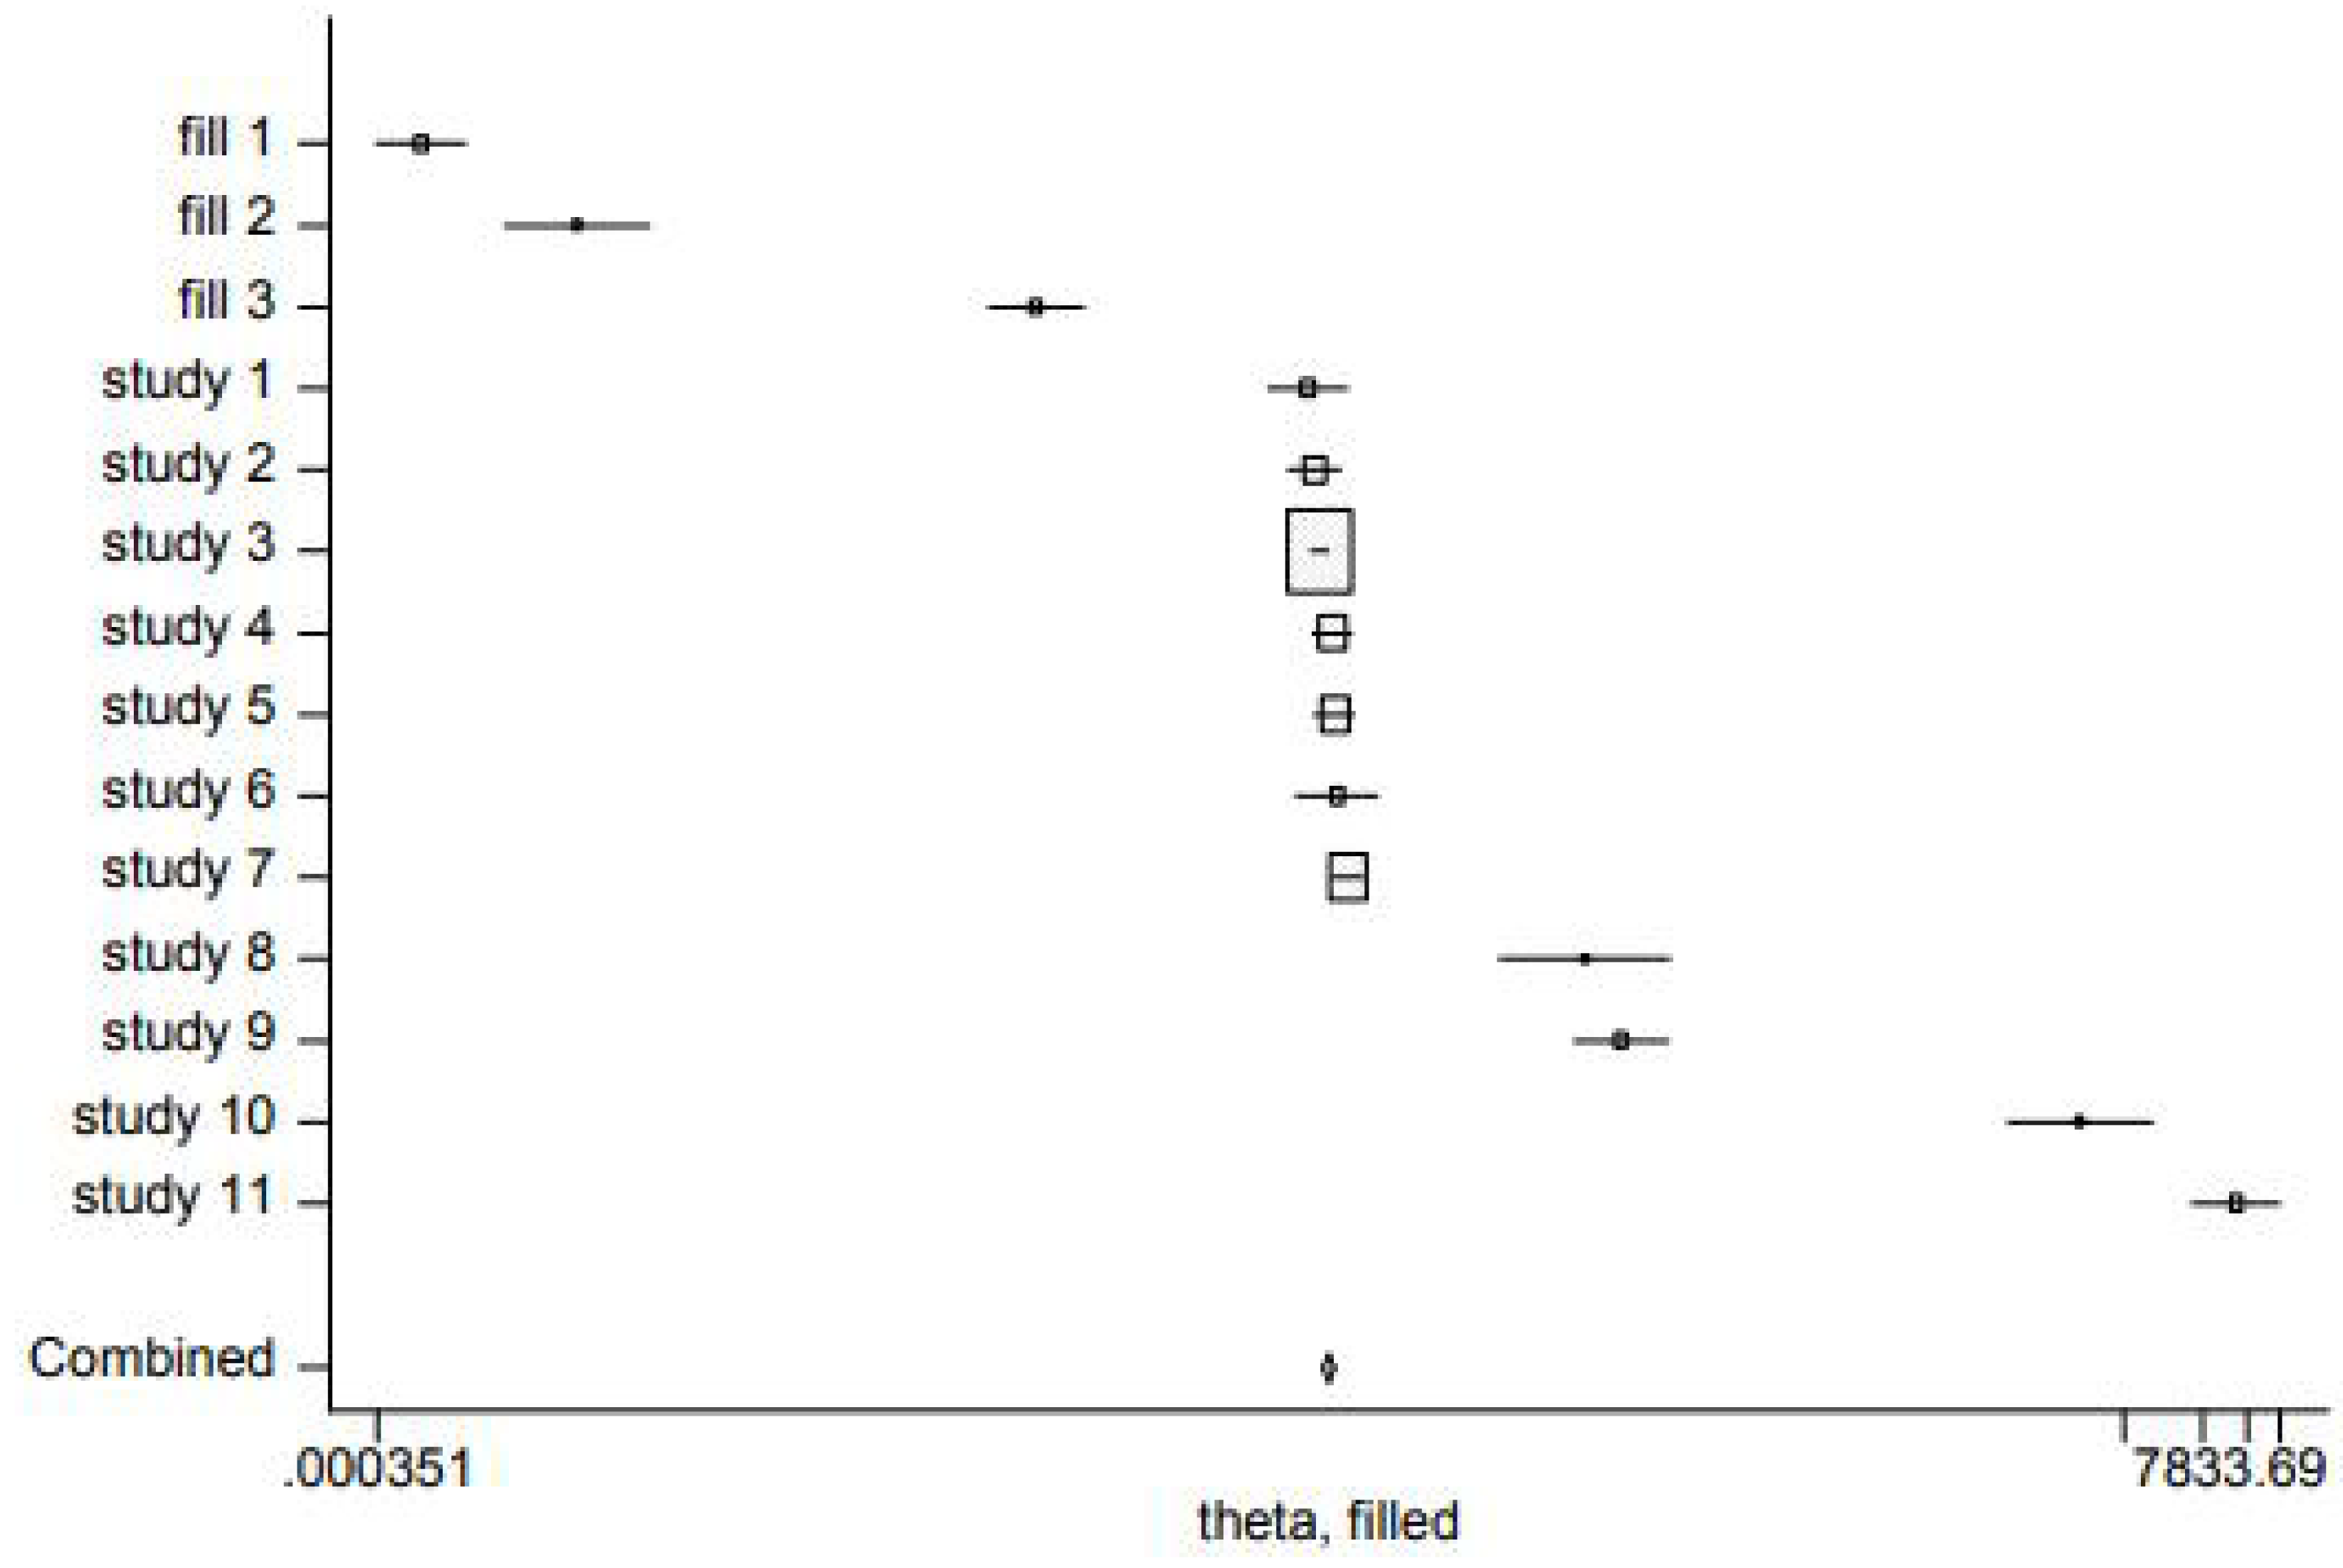
Discussion
This meta-analysis aimed to comprehensively explore the relationship between hyperhomocysteinemia (HHcy) and glomerular filtration rate (GFR) in chronic kidney disease (CKD) patients. Given the inconsistent results in the field, our synthesis was essential.
Our findings revealed a significant negative correlation between HHcy and GFR, which has important clinical implications. Elevated homocysteine (Hcy) levels can serve as an early warning sign of deteriorating renal function, allowing for timely intervention. For example, dietary modifications, such as increasing folate, vitamin B12, and vitamin B6 intake, may help slow the decline in GFR (Liu, Yao & Wang, 2025). Healthcare providers can use this information to develop more personalized treatment plans for CKD patients.
Scientifically, this correlation provides a basis for further research into the pathophysiological mechanisms. HHcy is known to induce endothelial dysfunction, oxidative stress, and inflammation, which damage the kidney’s glomerular and tubular structures (Inagi et al., 2005; Kubo et al., 2003). Future studies could focus on disrupting these harmful pathways. For instance, developing drugs that specifically target Hcy-induced processes, such as inhibiting oxidative stress-related enzymes, may offer new therapeutic strategies for CKD (Zhang et al., 2021).
Despite the large number of included studies, which enhanced the reliability of our findings, the cross-sectional nature of most studies limits our ability to determine causality. Longitudinal studies are needed to establish the cause–effect relationship between Hcy and CKD. Additionally, residual heterogeneity remains despite subgroup analysis, indicating that unaccounted factors still influence the relationship. Future research should strive to standardize study designs, patient selection, and measurement methods to reduce variability.
A significant gap in our analysis is the lack of gender-based comparisons. Given the known role of gender in CKD prevalence and progression, future studies should consider gender differences (Cobo et al., 2016). Understanding how sex hormones interact with Hcy in the context of CKD could lead to more effective prevention and treatment strategies tailored to different genders.
Conclusion
Our meta-analysis suggests a potential association between HHcy and a reduced GFR in CKD patients.These findings have far-reaching implications for clinical practice, underlining the indispensability of factoring in Hcy levels during the management and risk stratification of CKD patients. However, the road ahead is paved with opportunities for further research, which should be directed towards unraveling the pathophysiological intricacies and clinical ramifications of this relationship in greater detail, as well as devising more efficacious preventive and therapeutic strategies for CKD management. Such endeavors will not only enhance our understanding of this complex disease but also hold the promise of improving patient outcomes and alleviating the global burden of CKD.