Associations between maternal glycemic level and lipid profile and adverse pregnancy outcomes in women with type 2 diabetes mellitus: a retrospective study from China
- Published
- Accepted
- Received
- Academic Editor
- Stefano Menini
- Subject Areas
- Diabetes and Endocrinology, Global Health, Gynecology and Obstetrics, Nutrition, Women’s Health
- Keywords
- Pregestational diabetes mellitus, HbA1c, Lipid profiles, Adverse pregnancy outcomes
- Copyright
- © 2025 Xue et al.
- Licence
- This is an open access article distributed under the terms of the Creative Commons Attribution License, which permits using, remixing, and building upon the work non-commercially, as long as it is properly attributed. For attribution, the original author(s), title, publication source (PeerJ) and either DOI or URL of the article must be cited.
- Cite this article
- 2025. Associations between maternal glycemic level and lipid profile and adverse pregnancy outcomes in women with type 2 diabetes mellitus: a retrospective study from China. PeerJ 13:e19502 https://doi.org/10.7717/peerj.19502
Abstract
Purpose
To investigate the associations between maternal glucose and lipid metabolism and adverse pregnancy outcomes in women with type 2 diabetes mellitus (T2DM).
Methods
A retrospective cohort of pregnant women with T2DM who delivered at Peking University First Hospital was included. Univariate and multivariate logistic regression were used to identify risk factors. ROC curves were applied to determine optimal cut-off points for predicting adverse pregnancy outcomes.
Results
A total of 398 pairs of pregnant women and newborns from 2019 to 2023 were included. The key complications included large-for-gestational-age (LGA, 21.6%), preeclampsia (PE, 14.3%), preterm birth (14.3%) and birth defects (11.6%). The achievement rates for both glycated hemoglobin A1c (HbA1c) and lipid levels in early pregnancy were approximately 50%. HbA1c in the third trimester was significantly associated with increased birth weight (for LGA, aOR = 3.819, 95% CI [1.534–9.509]). Elevated triglyceride (TG) in early pregnancy were critical risk factors for LGA, PE, and preterm birth (aOR = 2.627, 2.478, 2.233; all p < 0.05). The optimal cut-off point for third-trimester HbA1c predicting LGA was ≤5.95%. The optimal cut-off points for first-trimester TG predicting LGA, PE, and preterm birth were separately ≤1.51, ≤1.67, and ≤1.46 mmol/L.
Conclusions
In Chinese pregnant women with T2DM, elevated plasma glucose and lipid levels at different pregnancy stages were independently linked to adverse outcomes, especially third-trimester HbA1c and first-trimester TG. TG level in early pregnancy lower than currently recommended may be beneficial to improve adverse outcomes.
Introduction
The prevalence of type 2 diabetes mellitus (T2DM) has increased alongside rising rates of overweight and obesity in the general population, resulting in a continuous rise in pregestational diabetes mellitus (PGDM) among women of childbearing age (Mackin et al., 2018; Gorsch et al., 2023). Given its longer duration and more severe nature, PGDM is often linked to a higher incidence of both short- and long-term adverse pregnancy outcomes compared to gestational diabetes mellitus (GDM). The types and incidence rates of PGDM differ across countries: type 1 diabetes mellitus (T1DM) has a higher incidence in European countries, wheras T2DM is more prevalent in Asians (Nolan et al., 1995). Previous studies suggest that pre-pregnancy management in diabetic patients is often less than satisfactory. In the UK, approximately 63.5% of T2DM patients cannot achieve optimal glycemic levels before pregnancy (Murphy et al., 2021), let alone in some developing countries—quite a few individuals are unaware of their diabetes status before pregnancy (Wei et al., 2019). T1DM is more frequently associated with neonatal hypoglycemia, whereas T2DM is linked to a higher incidence of congenital anomalies and neonatal mortality (Lemaitre et al., 2022; Newman et al., 2022; Fujikawa Shingu et al., 2022). This underscores a tough public health concern, as suboptimal glycemic control is likely prevalent, highlighting the necessity of optimizing pregestational diabetes care. Much attention has been given to GDM, but few articles have focused on the more severe PGDM. Investigations in Asian populations remain particularly limited. A recent study from Japan revealed that, although glycemic control among individuals with PGDM has improved over the past four decades, advancements in perinatal outcomes have been minimal (Fujikawa Shingu et al., 2022). Considering the variations in dietary habits and ethnic backgrounds across countries, and the rising number of PGDM cases in China, there is an urgent need for well-designed studies focusing on this population.
Poor glycemic control is a critical risk factor for adverse outcomes in both GDM and PGDM patients (Murphy et al., 2021; Newman et al., 2022). However, recent studies have observed that even with satisfactory blood glucose control in GDM populations, the incidence of large-for-gestational-age (LGA) infants remains high (González-Quintero et al., 2007). Maternal metabolic disorders, particularly those affecting placental nutrient regulation, contribute substantially to pregnancy outcomes. Excessive free fatty acids and other nutrients in maternal circulation exacerbate these metabolic disturbances, especially T2DM (McIntyre et al., 2019; Furse et al., 2019). In fact, management strategies targeting maternal lipid levels has been awfully neglected to date. It is well established that hormonal changes during pregnancy lead to physiological hyperlipidemia. Regrettably, the majority of research on lipid levels during pregnancy has been concentrated on the general population, with limited attention given to diabetic populations. Only in recent years have studies begun to explore the importance of lipid management in pregnant women with diabetes (Barrett et al., 2014). Nonetheless, data on lipid levels in pregnant women with T2DM are scarce, with only a few small-scale studies reported (Göbl et al., 2010). This is why our study was designed to focus primarily on the T2DM population. Previous research has indicated that, compared with women born in Europe and Australia, Asian-born women exhibit a stronger association between maternal lipid levels during pregnancy and neonatal birth weight (Samsuddin et al., 2020). Accordingly, we will perform a comprehensive analysis of HbA1c and lipid profiles across different gestational stages, aiming to evaluate the metabolic control status in pregnant women with T2DM from multiple perspectives and to identify potential risk factors for adverse pregnancy outcomes. Our findings may offer valuable reference for clinicians not only in Asia but also globally.
The aim of our retrospective cohort study was as follows: first, to report the current status of blood glucose and lipid profiles in pregnant women with T2DM, and to explore their relationship with adverse pregnancy outcomes; second, to determine the appropriate ranges of modifiable risk factors for this population by plotting ROC curves.
Methods
Subjects and study design
A retrospective cohort study was conducted among pregnant women who were registered and delivered at Peking University First Hospital between January 1, 2019, and December 31, 2023. The study protocol was approved by the Institutional Review Board of Peking University First Hospital (identification number 2023-521-003) prior to enrollment. Informed consent was waived by our Institutional Review Board because of the retrospective nature of our study. The inclusion criteria for study population were as follows: (1) delivery after 28 weeks of gestation; (2) singleton pregnancy; (3) pregestational type 2 diabetes mellitus; and (4) availability of comprehensive medical records. Exclusion criteria included: (1) abortion or stillbirth; (2) multiple pregnancies; (3) pregestational type 1 diabetes mellitus or specific types of diabetes due to other causes; (4) severely incomplete information. A total of 398 pregnant woman-newborn pairs were included. Maternal baseline characteristics, delivery details, and neonatal outcomes were meticulously documented by professionally trained obstetricians via the electronic medical records system. All participants received standardized outpatient prenatal care and weight management at our hospital, and laboratory indicators were subject to rigorous quality control, ensuring good consistency. Two obstetricians were responsible for data entry and quality assurance to ensure the accuracy and reliability of all recorded information.
Definitions
PGDM was diagnosed in accordance with the American Diabetes Association (ADA) Professional Practice Committee and the Chinese Guidelines for the Diagnosis and Treatment of Diabetes Mellitus in Pregnancy (Obstetrics Subgroup, Chinese Society of Obstetrics and Gynecology, Chinese Medical Association, Chinese Society of Perinatal Medicine, Chinese Medical Association, Commitee of Pregnancy with Diabetes Mellitus, China Maternal and Child Health Association, 2022; ElSayed et al., 2024). The proposed criteria were as follows: (1) Fasting plasma glucose ≥126 mg/dL (7.0 mmol/L), (2) Presence of typical hyperglycemia symptoms or hyperglycemic crisis, with any random plasma glucose level ≥200 mg/dL (11.1 mmol/L), (3) glycosylated hemoglobin A1c (HbA1c) ≥6.5% (48 mmol/mol), or (4) a 2-hour value of the oral glucose tolerance test (75 g OGTT) ≥200 mg/dL (11.1 mmol/L). A diagnosis of PGDM was made if any of the aforementioned criteria were met. For individuals diagnosed with PGDM, routine screening of insulin and C-peptide levels was recommended. In cases where T1DM was suspected, testing for islet autoantibodies has been conducted.
Biochemical information from early, middle, and late pregnancy was obtained by retrieving records during prenatal check-ups and hospital stays. Glycemic levels were measured by HbA1c and lipid profiles included triglyceride (TG), total cholesterol (CHO), high-density lipoprotein cholesterol (HDL), and low-density lipoprotein cholesterol (LDL) levels. All analyzed samples were derived from fasting venous blood. Body mass index (BMI) was calculated by body weight in kilograms divided by the square of height in meters. Maternal pre-pregnancy BMI was categorized into four groups on the basis of the Chinese BMI classification (Pan, Wang & Pan, 2021). With respect to the duration of diabetes, if the diagnosis was made less than one year before pregnancy or during pregnancy, it was recorded as 0 years.
Preeclampsia (PE) can be classified into two subtypes: hypertension (systolic blood pressure ≥140 mmHg and/or diastolic blood pressure ≥90 mmHg) occurring at or after 20 gestational weeks with significant proteinuria (urine protein ≥300 mg/24 h or positive results in random urine protein tests) and chronic hypertension with superimposed preeclampsia (Metoki et al., 2022). Birth defects referred to structural abnormalities identified through prenatal ultrasound or discovered after birth that required repeated medical checkups or surgical treatment. Newborns were classified into appropriate for gestational age (AGA), small for gestational age (SGA) or large for gestational age (LGA) on the basis of the INTERGROWTH-21st curves (Villar et al., 2014). Birth weights below the 10th percentile were classified as SGA, and those above the 90th percentile were classified as LGA. Preterm birth was defined as the birth of newborns less than 37 weeks of gestational age.
In this study, HbA1c <6.5%, 6.0%, and 6.0% in the first, second, and third trimesters, respectively, was considered to be a parameter for glycemic control (ElSayed et al., 2024). Since there has been no clear guidelines for lipid targets during pregnancy, this study referred to the latest edition of “Williams Obstetrics (25th edition)” for standards (Leveno et al., 2018). Combined with the results of previous studies, we defined the lipid target standards as TG, CHO, and LDL below the upper limit of the specified range and HDL above the lower limit (Table S1) (Wang et al., 2018). Individuals who met all four indicators in the same period were defined as achieving lipid target levels.
Statistical analysis
Normally distributed, continuous variables were presented as mean ± standard deviation (SD) and skewed data were presented as median (interquartile range, IQR). Categorical variables were summarized as numbers and percentages. Continuous variables were tested using independent sample t-tests for data of equal variance and normal distribution and the Mann–Whitney test for non-parametric data. Data with a skewed continuous distribution, such as TG and other lipid indices levels, were considered approximately normally distributed after logarithmic transformation. Categorical variables were tested via Chi-square tests and Fisher’s exact test. Univariate logistic regression analysis was performed with different adverse pregnancy outcomes as dependent variables. Variables with p < 0.1 in the univariate analysis were included in the multivariate logistic regression model, adjusting for covariates such as maternal age, pre-pregnancy BMI, gestational weight gain, medication before and during pregnancy, and duration of diabetes. The results were expressed as odds ratios (ORs) and their 95% confidence intervals (CIs). Receiver operating characteristic (ROC) curve analysis was conducted for the identified independent risk factors, and the optimal cutoff point for predicting adverse pregnancy outcomes was determined by maximizing the Youden index. Statistical analyses were performed using SPSS 27.0 (SPSS Inc., Chicago, IL, USA), and p-value <0.05 was considered statistically significant.
Results
Characteristics of the study population
The baseline data, maternal and neonatal information, delivery details and adverse pregnancy outcomes of the study subjects were shown in Table 1. Among the 398 mothers, the average age at delivery was 34.50 ± 4.15 years, and 73.1% were primiparas. Before pregnancy, only 26.6% of the pregnant women had normal BMI, and the proportions of overweight and obesity were 41.5% and 30.4%, respectively. The median duration of diabetes was 1 year. Only 37.7% of participants needed medication before pregnancy, but the proportion of medication during pregnancy increased significantly (84.4%). The most common adverse pregnancy outcomes were LGA (21.6%), preeclampsia (14.3%), preterm birth (14.3%) and birth defects (11.6%). The incidence rates of other complications are detailed in Table 1.
| Characteristics | All (n = 398) |
|---|---|
| Maternal characteristics | |
| Age at delivery (year) | 34.50 ± 4.15 |
| Primipara | 291 (73.1%) |
| Pre-pregnancy BMI (kg/m2) | 26.52 ± 4.64 |
| Underweight (<18.5) | 6 (1.5%) |
| Normal weight (18.5–24.0) | 106 (26.6%) |
| Overweight (24.0–28.0) | 165 (41.5%) |
| Obese (≥28.0) | 121 (30.4%) |
| Gestational weight gain (kg) | 10.0 (7.2, 12.9) |
| Duration of diabetes (year) | 1 (0,3) |
| <1 | 194 (48.9%) |
| 1–5 | 138 (34.8%) |
| ≥5 | 65 (16.4%) |
| Medication before pregnancy | 150 (37.7%) |
| Medication during pregnancy | 336 (84.4%) |
| Insulin | 326 (81.9%) |
| Metformin | 72 (18.1%) |
| Insulin+Metformin | 64 (16.1%) |
| Delivery information | |
| Fetal distress | 77 (19.3%) |
| Premature rupture of fetal membranes | 52 (13.1%) |
| Intrauterine infection | 42 (10.6%) |
| Cesarean | 262 (65.8%) |
| Infant sex (boy/girl) | 202 (50.8%)/196 (49.2%) |
| Birth weight (g) | 3,180 (2,800, 3,553) |
| Adverse pregnancy outcomes | |
| Preeclampsia | 57 (14.3%) |
| Postpartum hemorrhage | 39 (9.8%) |
| Large for gestational age | 88 (21.6%) |
| Small for gestational age | 24 (6.0%) |
| Macrosomia | 19 (4.8%) |
| Preterm birth | 57 (14.3%) |
| Neonatal asphyxia | 22 (5.5%) |
| Neonatal hypoglycemia | 23 (5.8%) |
| Birth defects | 46 (11.6%) |
| Pediatric department admission | 30 (7.5%) |
Plasma glucose and lipid control status and target achievement rates by trimester
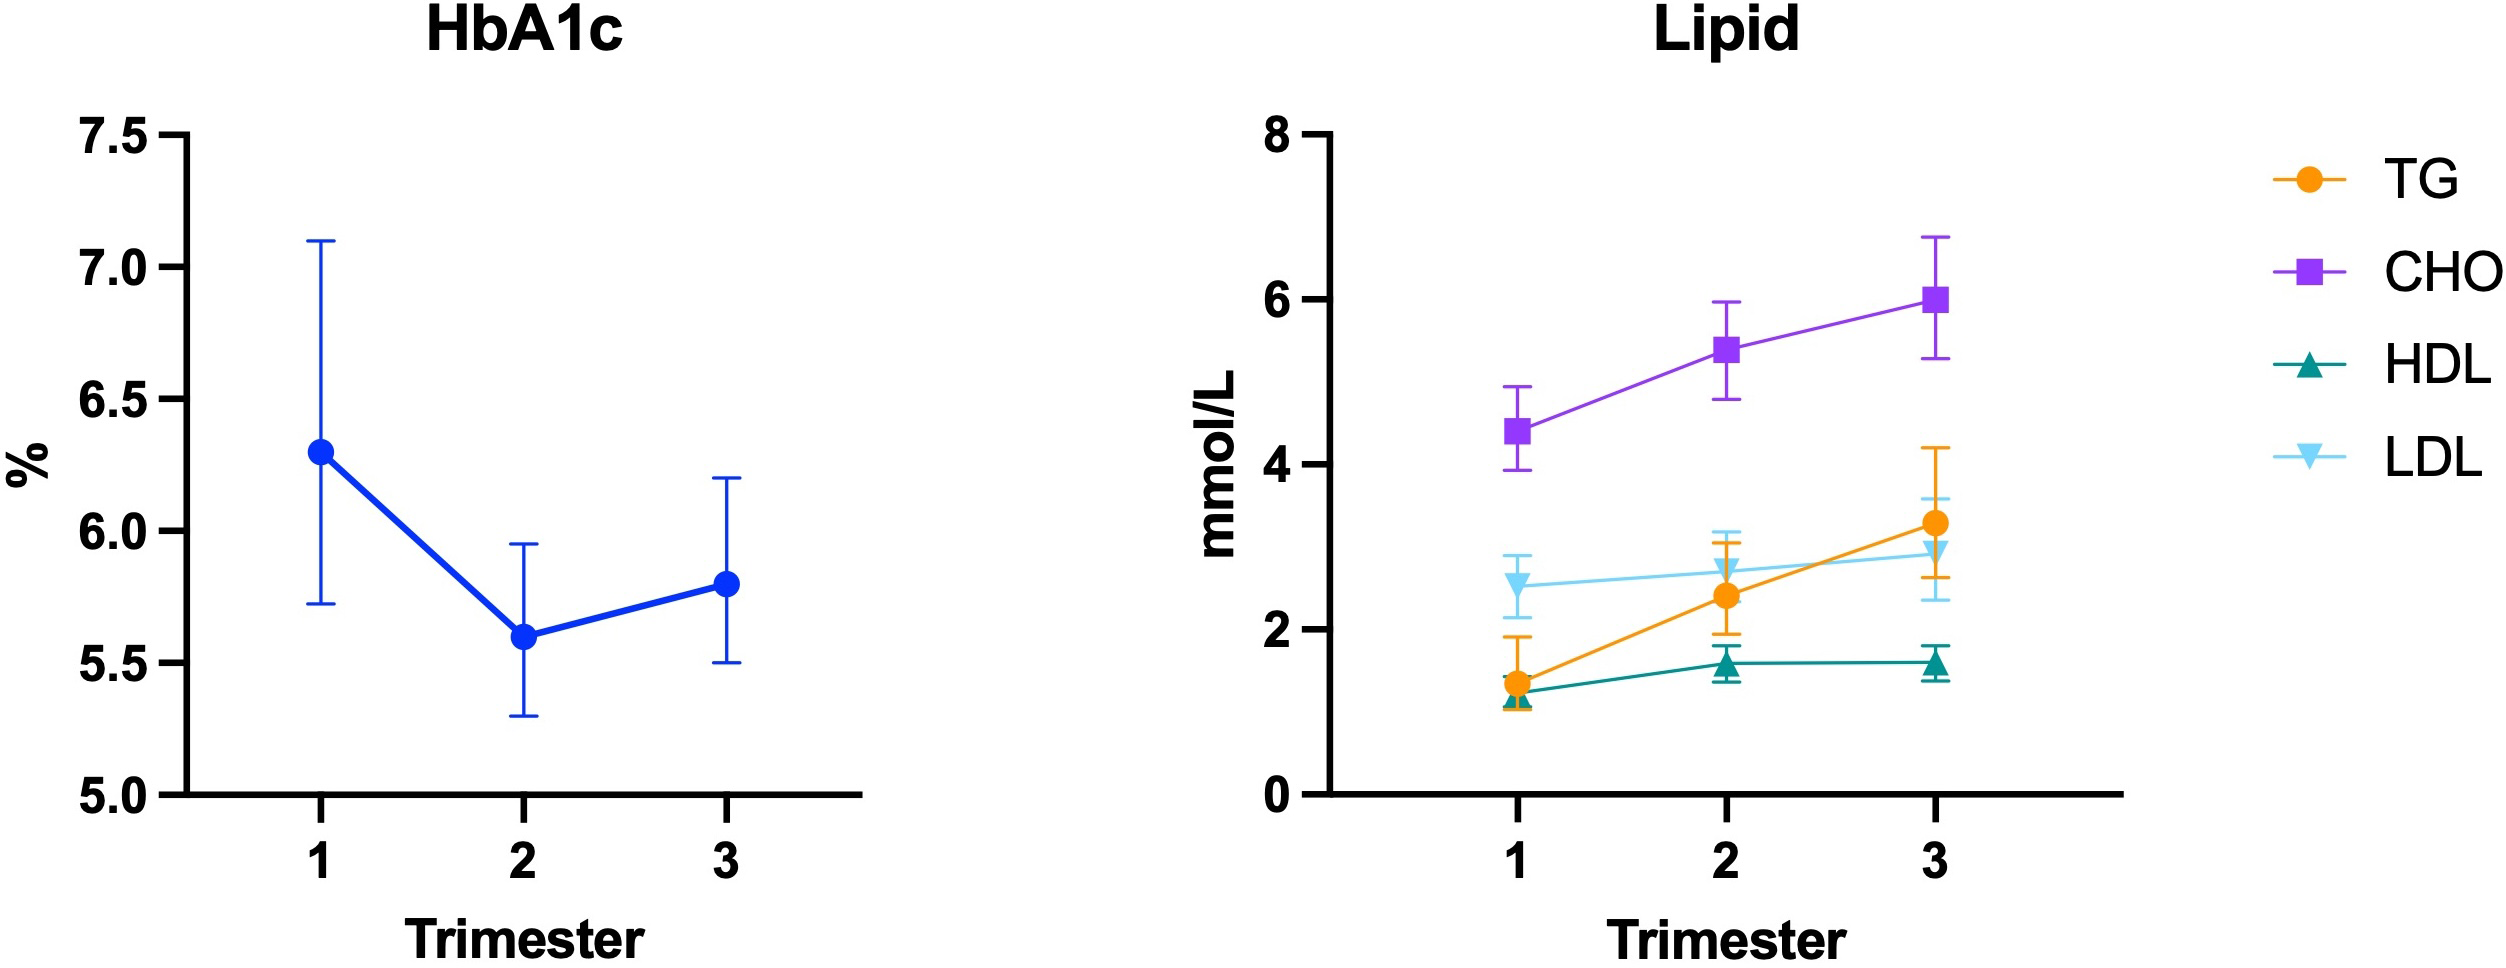
In the study population, HbA1c levels were highest in the first trimester, decreased in the second trimester, and gradually increased in the third trimester (Fig. 1). Adequate glycemic control was achieved by 54.5%, 74.8%, and 63.2% in the first, second, and third trimesters, respectively. Additionally, there was a significant amount of missing data (36.3%) for early pregnancy, as some individuals were diagnosed with PGDM only after the 26–28 week OGTT, and HbA1c screening is not routinely performed on those with normal fasting plasma glucose at the first prenatal visit.
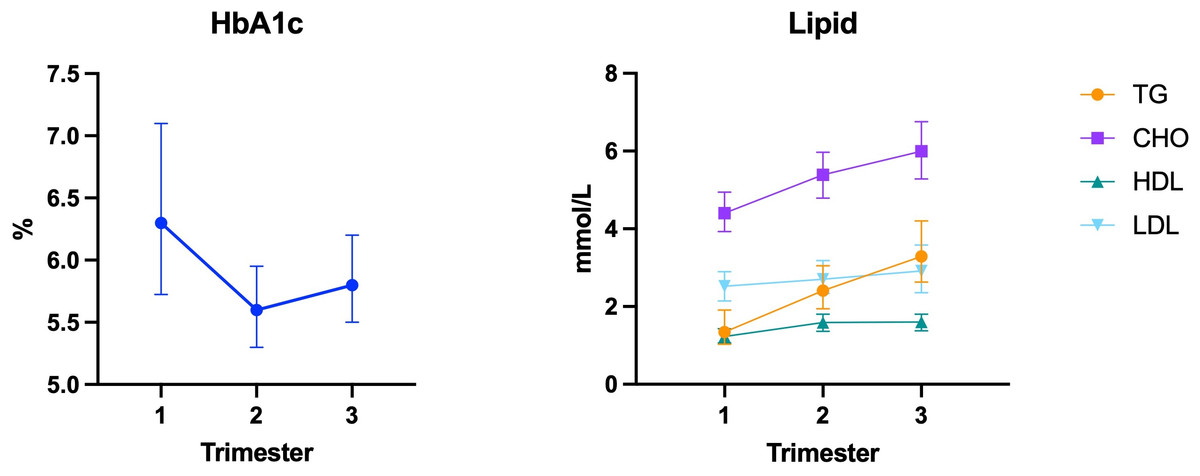
Figure 1: Changes in HbA1c and lipid levels throughout pregnancy.
With respect to lipid levels, all indicators showed an upward trend with increasing gestational age (Fig. 1). In the first trimester, only 54.0% of individuals had lipid levels within the target range, with most noncompliant cases attributed to excessively high TG levels. The lipid target achievement rate in the second trimester was 67.2%, however, the lack of routine lipid screening during this period resulted in fewer valid data (46.0%). As a result, these indexes were not included in subsequent risk factor analyses. In the third trimester, the lipid target achievement rate increased to 80.8% and most cases failed to meet the standards due to elevated TG levels as well (Table 2).
| Trimester | Biochemical index | M (P25, P75) | Available data | Achievement rate |
|---|---|---|---|---|
| First | HbA1c | 6.30 (5.70, 7.10) | 257 (64.6) | 140 (54.5) |
| Second | HbA1c | 5.60 (5.30, 6.00) | 318 (79.9) | 238 (74.8) |
| Third | HbA1c | 5.80 (5.43, 6.20) | 356 (89.6) | 225 (63.2) |
| First | TG | 1.35 (1.03, 1.95) | 346 (86.9) | 243 (70.2) |
| CHO | 4.41 (3.93, 4.94) | 346 (86.9) | 310 (89.6) | |
| HDL | 1.24 (1.07, 1.43) | 346 (86.9) | 275 (79.5) | |
| LDL | 2.52 (2.14, 2.91) | 346 (86.9) | 336 (97.1) | |
| Lipid profile | – | 346 (86.9) | 187 (54.0) | |
| Second | TG | 2.41 (1.96, 3.05) | 183 (46.0) | 170 (92.9) |
| CHO | 5.35 (4.72, 5.97) | 183 (46.0) | 179 (97.8) | |
| HDL | 1.58 (1.34, 1.80) | 183 (46.0) | 137 (76.9) | |
| LDL | 2.68 (2.28, 3.17) | 183 (46.0) | 181 (98.9) | |
| Lipid profile | – | 183 (46.0) | 123 (67.2) | |
| Third | TG | 3.26 (2.62, 4.18) | 365 (91.7) | 320 (87.7) |
| CHO | 5.97 (5.21, 6.75) | 365 (91.7) | 360 (98.6) | |
| HDL | 1.59 (1.39, 1.80) | 365 (91.7) | 325 (89.0) | |
| LDL | 2.89 (2.32, 3.58) | 365 (91.7) | 364 (99.7) | |
| Lipid profile | – | 365 (91.7) | 295 (80.8) |
Notes:
First: the first trimester of pregnancy (0–13+6 weeks).
Second: the second trimester of pregnancy (14–27+6 weeks).
Third: the third trimester of pregnancy (≥ 28 weeks).
Lipid profile: all four indicators in the same period have been achieved lipid target levels.
Association between plasma glucose and lipid levels and adverse pregnancy outcomes
The predictive factors for the four major adverse pregnancy outcomes with the highest incidence—LGA, PE, preterm birth, and birth defects—were presented in Table 3. Regarding the risk factors for LGA, after adjustment, 1st-trimester TG and 3rd-trimester HbA1c emerged as independent risk factors. For example, every unit increase in 3rd-trimester HbA1c was associated with an increased risk of LGA (p = 0.004, aOR = 3.819, 95% CI [1.534–9.509]). Similarly, an increase in 1st-trimester lnTG significantly impacted the occurrence of LGA (p = 0.028, aOR = 2.627, 95% CI [1.111–6.209]). For PE, although 3rd-trimester HbA1c and 1st-trimester lnTG and lnLDL levels were identified as risk factors in univariate analysis, only 1st-trimester lnTG remained as independent risk factors after adjustment (p = 0.037, aOR = 2.478, 95% CI [1.056–5.812]). For preterm birth, the primary risk factor was TG in the early pregnancy. After adjusting for confounders, every unit increase in the 1st-trimester lnTG increased the incidence of preterm birth by approximately 2.2 times (p = 0.045, aOR = 2.233, 95% CI [1.018–4.902]). For birth defects, 1st-trimester HbA1c and total cholesterol might be its risk factors (p < 0.1), but their relationship was not observed in the adjusted multivariate regression model.
| Model 1 | Model 2* | ||||
|---|---|---|---|---|---|
| Outcomes | Possible factor | OR (95% CI) | p value | aOR (95% CI) | p value |
| LGA | Age | 1.063 (1.003, 1.127) | 0.041 | 1.090 (1.003, 1.184) | 0.043 |
| Pre-pregnancy BMI | 1.052 (1.001, 1.105) | 0.046 | – | NS | |
| GWG | 1.080 (1.024, 1.140) | 0.005 | 1.103 (1.014, 1.199) | 0.022 | |
| 2nd-trimester HbA1c | 1.973 (1.250, 3.116) | 0.004 | – | NS | |
| 3rd-trimester HbA1c | 2.121 (1.396, 3.223) | <0.001 | 3.819 (1.534, 9.509) | 0.004 | |
| 1st-trimester lnTG | 1.841 (1.064, 3.185) | 0.029 | 2.627 (1.111, 6.209) | 0.028 | |
| 3rd-trimester lnHDL | 0.254 (0.077, 0.831) | 0.023 | – | NS | |
| PE | Pre-pregnancy BMI | 1.104 (1.044, 1.168) | <0.001 | 1.097 (1.017, 1.183) | 0.017 |
| 3rd-trimester HbA1c | 1.719 (1.070, 2.760) | 0.025 | – | NS | |
| 1st-trimester lnTG | 2.380 (1.275, 4.442) | 0.006 | 2.478 (1.056, 5.812) | 0.037 | |
| 1st-trimester lnLDL | 5.928 (1.714, 20.499) | 0.005 | – | NS | |
| Preterm birth | Age | 1.070 (0.999, 1.146) | 0.052 | – | NS |
| Medication before pregnancy | 0.440 (0.228, 0.847) | 0.014 | 0.311 (0.125, 0.777) | 0.012 | |
| 1st-trimester lnTG | 3.403 (1.731, 6.689) | <0.001 | 2.233 (1.018, 4.902) | 0.045 | |
| 3rd-trimester InHDL | 0.274 (0.065, 1.154) | 0.078 | – | NS | |
| Birth defects | 1st-trimester HbA1c | 1.282 (0.973, 1.687) | 0.077 | – | NS |
| 1st-trimester InCHO | 5.048 (0.760, 33.523) | 0.094 | – | NS | |
Notes:
NS, no significant difference.
Optimal cut-off points for predicting adverse pregnancy outcomes based on the ROC curves
The most appropriate cut-off values for predicting adverse pregnancy outcomes are shown in Table 4, where we primarily analyzed the biochemical indices suggested as independent risk factors in Table 3. According to the ROC curves, the optimal cut-off points proposed in predicting LGA for 3rd-trimester HbA1c and 1st-trimester TG were separately ≥5.95% and ≥1.51 mmol/L. The optimal threshold predicting PE for 1st-trimester TG was ≥1.67 mmol/L. The 1st-trimester TG level demonstrated the strongest predictive ability for preterm birth with the largest area under the curve (AUC) [0.673 (95% CI [0.580–0.765])] and the threshold was ≥1.46 mmol/L.
| AUC (95%CI) | Sensitivity (%) | Specificity (%) | Youden index | Cut-off point | |
|---|---|---|---|---|---|
| LGA | |||||
| 3rd HbA1c (%) | 0.645 (0.577, 0.712) | 55.0 | 68.5 | 0.235 | 5.95 |
| 1st TG (mmol/L) | 0.602 (0.532, 0.673) | 58.6 | 63.8 | 0.224 | 1.51 |
| Preeclampsia | |||||
| 1st TG (mmol/L) | 0.619 (0.536, 0.703) | 52.0 | 69.6 | 0.216 | 1.67 |
| Preterm birth | |||||
| 1st TG (mmol/L) | 0.673 (0.580, 0.765) | 70.5 | 61.3 | 0.318 | 1.46 |
Discussion
This study comprehensively provides an overview of plasma glucose and lipid control levels and pregnancy outcomes in patients with T2DM under the management of our gestational diabetes center over the past five years. To our knowledge, this study is the first with a relatively large sample size from a single center to statistically analyze the achievement rates of maternal plasma glucose and lipid targets across all pregnancy stages in women with T2DM.
Maternal HbA1c levels and adverse pregnancy outcomes
HbA1c served as a measure of plasma glucose control in our study, formed by the non-enzymatic reaction between hemoglobin and glucose in erythrocytes. The trend of HbA1c levels throughout pregnancy in women with T2DM roughly aligns with that observed in the normal pregnancies, with lower levels in the second trimester than in the first trimester and a slight increase in the third trimester (O’Connor et al., 2011). Despite stringent management, only 54.5% of individuals achieved the target HbA1c level in the first trimester, and this number increased only slightly to 63.2% by late pregnancy. Previously, a large-scale cohort study from Ireland involving the PGDM population reported that only one-third of patients achieved HbA1c levels below 6.5% before pregnancy (Newman et al., 2022), highlighting the challenges in achieving optimal plasma glucose control in this population. Given the significant gap in HbA1c levels during early pregnancy, we categorized the group with normal plasma glucose control throughout mid to late pregnancy as the well-controlled group, which comprised about 61.3% of the participants. Notably, overweight and obese mothers before pregnancy faced greater challenges in maintaining optimal plasma glucose levels during pregnancy. In terms of pregnancy outcomes, the birth weights and percentiles of infants in the poorly controlled group were significantly greater than those in the well-controlled group, with PE and LGA rates also showing significant increases. This seems to suggest that, irrespective of early pregnancy plasma glucose control, effective control during mid to late pregnancy can still improve pregnancy outcomes. In the analysis of risk factors, we found that 3rd-trimester HbA1c had the most significant predictive effect on LGA in pregnant women with T2DM. Hauffe et al. (2020) also observed that even if 1st-trimester HbA1c targets of ≤ 6.5% (48 mmol/mol) are not met, good glycemic control later in pregnancy can compensate and reduce the incidence of LGA, which is consistent with our conclusion.
Recently, an increasing number of studies have suggested that poor glycemic control in early pregnancy may be associated with birth defects, potentially affecting placental development (Dude et al., 2021; Koefoed et al., 2024). Although we did not find a significant correlation between early pregnancy HbA1c levels and birth defects in our study (p = 0.077 in the univariate analysis), this may be attributed to our inclusion criteria, which only enrolled live births after 28 weeks. A considerable number of patients who underwent termination of pregnancy in the early or mid-pregnancy due to fetal chromosomal abnormalities or lethal malformations were not included, resulting in selection bias.
The mechanisms by which maternal hyperglycemia in the first and third trimesters leads to different adverse pregnancy outcomes are primarily due to differences in fetal sensitivity to metabolic factors during distinct developmental stages. During early pregnancy, fetal growth focuses on organ formation rather than fat accumulation. At this stage, the fetal pancreas remains immature, weight gain is minimal, and metabolic disturbances predominantly increase the risk of congenital malformations (Koefoed et al., 2024). In contrast, the third trimester represents a critical period of rapid fetal growth, during which the fetal pancreas becomes functionally mature (Sandovici et al., 2013). Exposure to hyperglycemia during this phase triggers β-cell hypersecretion of insulin, promoting excessive adipose tissue deposition and tissue hyperplasia, thereby elevating the risk of LGA (Xu, Liang & Wang, 2011; McIntyre et al., 2019).
Maternal lipid profile and adverse pregnancy outcomes
Lipid levels in the T2DM population also generally followed physiological trends during pregnancy (Zheng et al., 2022). However, the target achievement rate for lipids in the first trimester was suboptimal, with only 54.2% of participants meeting the recommended standards. Subsequent analysis revealed that 1st-trimester TG levels were independent risk factors for PE, LGA and preterm birth. In the general pregnancy population, early pregnancy TG levels are associated with newborn birth weight (Wang et al., 2015; Zhu et al., 2022). Harmon et al. (2011) noted that 1st-trimester TG levels are the most important predictors of infant body fat. Similarly, a prospective cohort study in Malaysia indicated that maternal TG levels in mid-pregnancy are better predictors of neonatal obesity than plasma glucose levels (Samsuddin et al., 2020). These findings suggest that maternal lipid metabolism plays a crucial role in shaping fetal growth and development. The underlying mechanisms are complex and involve multiple biological pathways. Maternal hyperlipidemia may influence the expression of lipid transporters, thereby altering both the quantity and composition of lipids delivered to the fetus (Larqué et al., 2011; Song et al., 2017; Hirschmugl et al., 2021). Aberrations in the supply of essential fatty acids, particularly n-3 long-chain polyunsaturated fatty acids, may lead to changes in placental and fetal gene expression profiles through epigenetic mechanisms such as DNA methylation, histone modification, and non-coding RNA regulation, thereby elevating the risk of obesity and metabolic disorders in the offspring during adulthood (Lendvai et al., 2016; Srinivas et al., 2021). Although the impact of plasma lipids has been widely studied, the PGDM population is often excluded, despite T2DM typically leading to more severe hypertriglyceridemia during pregnancy.
Importantly, another point that cannot be overlooked is that 1st-trimester TG is also a significant risk factor for preterm birth. Previously, a cohort study of normal pregnancies conducted in southern China reported that maternal TG was identified as an independent risk factor for preterm birth (Lin et al., 2019). Our findings can serve as a complementary study specifically focusing on the T2DM population. A previous study in Denmark analyzed modifiable factors for preterm birth in PGDM and reported that preeclampsia and pre-existing kidney involvement were predictors for preterm birth, although lipid factors were not considered (Søholm et al., 2021). This omission does not contradict our results, as preeclampsia is strongly associated with 1st-trimester TG levels.
The relationship between PE and TG is easier to understand, as elevated TG and LDL are closely associated with hypertensive disorders. Excess lipids deposit in the arterial walls, leading to atherosclerotic plaques. Although the precise mechanism behind PE remains unclear, current evidence suggests that lipid metabolism disorders play a critical role in its development (Jin et al., 2016). Similar to how excessive lipid accumulation disrupts pancreatic β-cell function, it can also induce apoptosis in placental trophoblast cells, thereby altering placental structure and function and leading to adverse pregnancy outcomes (Natarajan et al., 2021; Plötz & Lenzen, 2024).
In current study, the lipid target achievement rates were based on the standards in “Williams Obstetrics”, but recent years have seen other suggestions for reference ranges for plasma lipids during pregnancy. For example, Wang et al. (2018) used the 5th and 95th percentiles to define reference ranges, while Zheng et al. (2022) applied the Hoffmann method, a statistical technique for indirectly estimating reference intervals from clinical laboratory results to provide reference standards in the normal pregnant population in Beijing, China. Using ROC curves, Jin et al. (2016) identified a cut-off value of 3.53 mmol/L for 3rd-trimester TG to predict LGA, which is significantly lower than the upper limit (5.11 mmol/L) specified in Williams Obstetrics. Our study employed the same method and proposed that optimal cut-off points for first-trimester TG predicting LGA, PE, and preterm birth were separately ≤1.51, ≤1.67, and ≤1.46 mmol/L, values also lower than the upper limits (1.80 mmol/L) reported in most current studies for normal pregnant women, suggesting that lipid control during pregnancy might need to be more stringent. In summary, our findings underscore the necessity of focusing not only on plasma glucose levels in the T2DM population but also on lipid management.
Strengths and limitations
Compared with other studies on T2DM populations, our research offers a comprehensive analysis of various biochemical markers during pregnancy, including HbA1c and all parameters of lipids. This is the first study to examine the control status of the T2DM pregnancy population from multiple perspectives, attempting to identify risk factors for adverse pregnancy outcomes. This research fills a gap in current research on Asian populations and may provide valuable guidance for clinicians. Although the data were obtained from a single center, our laboratory, affiliated with one of the largest and earliest established gestational diabetes management centers in China, performing HbA1c and lipid measurements ensures a robust and consistent dataset.
However, as a retrospective study, we encountered missing plasma glucose and lipid data for certain periods, which could generate a lack of power in statistical comparisons. There is a need to strengthen the standardized management of this population and implement routine lipid screening in mid-pregnancy. Additionally, some individuals in our study population were diagnosed via OGTT, and we did not conduct a 42-day follow-up with OGTT revalidation, which may introduce some bias. Besides, we collected data from pregnant women with singleton live births delivered at 28 weeks of gestation or later, excluding cases of abortion and stillbirth. The exclusion of these cases was necessitated by our study design, which relied on inpatient delivery records where early/mid-pregnancy losses were typically managed in outpatient settings. Glucose and free fatty acids (particularly long-chain fatty acids) play an important role in placental formation and development, and have been implicated in adverse outcomes such as miscarriage and fetal growth restriction (Illsley & Baumann, 2020; Duttaroy & Basak, 2020). However, due to the limitations of our clinical data, we were unable to collect information on specific FFA subtypes, which may have limited the comprehensiveness of our analysis. Last but not least, a multicenter prospective clinical cohort is currently under development. With improved follow-up and study design, we aim to enroll more miscarriage and stillbirth cases and to incorporate additional biochemical markers, such as FFAs.
Conclusion
In summary, achieving ideal plasma glucose and lipid levels throughout pregnancy can be challenging for individuals with T2DM. However, it is essential to focus on controlling HbA1c levels during late pregnancy, as good control can significantly reduce the occurrence of adverse outcomes. In early pregnancy, in addition to managing plasma glucose to prevent potential birth defects, monitoring elevated lipid levels, particularly TGs, is crucial. According to our study, the glycemic cut-off point for predicting adverse outcomes in pregnant women with T2DM was consistent with current guidelines, but the lipid threshold in the first trimester was lower than the current standard range. In the future, more attention should be paid to the importance of blood lipids and various methods should be applied to clarify the reasonable range of blood lipids during pregnancy.
Supplemental Information
Reference range of serum lipid levels of normal pregnancy
Refer to Williams Obstetrics, 25th edition.
Basic information for all 398 individuals
Categorical variables are represented by numerical codes, and the corresponding meanings are presented in the heading column of the first row.