Identification and validation of three diagnostic autophagy-related genes associated with advanced plaques and immune cell infiltration in carotid atherosclerosis based on integrated bioinformatics analyses
- Published
- Accepted
- Received
- Academic Editor
- Steven Buyske
- Subject Areas
- Genetics, Genomics, Cardiology
- Keywords
- Carotid atherosclerosis, Autophagy, Immune cell infiltration, Bioinformatics analyses, Immunohistochemistry
- Copyright
- © 2024 Huang et al.
- Licence
- This is an open access article distributed under the terms of the Creative Commons Attribution License, which permits using, remixing, and building upon the work non-commercially, as long as it is properly attributed. For attribution, the original author(s), title, publication source (PeerJ) and either DOI or URL of the article must be cited.
- Cite this article
- 2024. Identification and validation of three diagnostic autophagy-related genes associated with advanced plaques and immune cell infiltration in carotid atherosclerosis based on integrated bioinformatics analyses. PeerJ 12:e18543 https://doi.org/10.7717/peerj.18543
Abstract
Background
Autophagy plays a key role in the development of carotid atherosclerosis (CAS). This study aimed to identify key autophagy-related genes (ATGs) related with CAS using bioinformatics analysis, in vivo AS mouse model, and in vitro experiments.
Methods
The GSE100927 and GSE28829 datasets were downloaded from the Gene Expression Omnibus (GEO) database. An integrated bioinformatics analyses of differentially expressed ATGs (DE-ATGs) was conducted. Gene ontology (GO) and Kyoto Encyclopedia of Genes and Genomes (KEGG) enrichment analyses were performed to identify the biological processes and pathways associated with DE-ATGs. Protein-protein interaction (PPI) network was constructed with the DE-ATGs to identify the key CAS-related DE-ATGs. Receiver operating characteristic (ROC) curve analysis was used to determine the diagnostic value of the key CAS-related DE-ATGs. CIBERSORT analysis was performed to determine the infiltration status of 22 immune cell types and their correlation with the expression levels of the key CAS-related DE-ATGs. Hematoxylin and eosin (HE) staining was used to estimate the plaque histology in the AS mouse model. Western blotting, quantitative real-time PCR (qRT-PCR), and immunohistochemistry (IHC) were performed to validate the protein and mRNA expression levels of the key CAS-related DE-ATGs in the in vitro and in vivo models.
Results
We compared transcriptome profiles of 12 early CAS plaques and 29 advanced CAS plaques in the GSE100927 dataset and identified 41 DE-ATGs (33 up-regulated and eight down-regulated). Functional enrichment analysis showed that the DE-ATGs were closely related with apoptosis, autophagy, and immune activation. ROC curve analysis showed that the area under the curve (AUC) values for the three key CAS-related DE-ATGs (CCL2, LAMP2, and CTSB) were 0.707, 0.977, and 0.951, respectively. CIBERSORT analyses showed close association between the three key CAS-related DE-ATGs and the infiltration of immune cell types in the plaques. Finally, the western blot, qRT-PCR, and IHC staining confirmed that CCL2, LAMP2, and CTSB were highly expressed in the plaques of the AS model mice or ox-LDL-treated human umbilical vein endothelial cells (HUVECs) and human aorta vascular smooth muscle cells (HAoSMCs).
Conclusion
We identified and validated three key CAS-associated ATGs, namely, CCL2, LAMP2, and CTSB with high diagnostic value. These three key CAS-associated ATGs are promising diagnostic markers and therapeutic targets for patients with CAS.
Introduction
Carotid atherosclerosis (CAS) is a chronic inflammatory disease of the carotid artery (Kong et al., 2022; Stary et al., 1995; Tedgui & Mallat, 2006) and plays a vital role in the cerebral ischemic events, including ischemic strokes (Bos et al., 2021; Saba et al., 2019). The pathophysiology of CAS is not clearly established. However, several studies have shown that CAS is linked with inflammation, lipid metabolism disorders, as well as dysfunction of the endothelial cells and smooth muscle cells (Lu & Daugherty, 2015). Autophagy plays a critical role in the development of CAS, but the precise mechanism by which autophagy regulates CAS development and progression is unclear.
Autophagy is a process of self-eating in which damaged cellular proteins and organelles are degraded in the lysosomes; this process is regulated by the autophagy-related genes (ATGs) (Grootaert et al., 2018; Levine & Kroemer, 2019). Autophagy is categorized into three types: chaperone-mediated autophagy, microautophagy, and macroautophagy (Mahapatra et al., 2021). Autophagy dysregulation is implicated in the pathogenesis of inflammatory diseases, neurodegenerative diseases, cancers, and autoimmune disorders (Mizushima & Levine, 2020; Yamamoto, Zhang & Mizushima, 2023).
Autophagy maintains intracellular homeostasis of several cardiovascular cell types, including the vascular smooth muscle cells (VSMCs) and endothelial cells (Bravo-San Pedro, Kroemer & Galluzzi, 2017). Several studies have demonstrated that aberrant expression of several ATGs is significantly associated with the progression of CAS. For example, ATG7 silencing in the VSMCs and mice inhibited autophagy and accelerated atherosclerotic development (Osonoi et al., 2018). Furthermore, defective autophagy accelerated atherosclerosis in the ATG5 knockout macrophages and mice (Liao et al., 2012).
Ischemic stroke (IS) is one of the major causes of disability worldwide. IS is mainly caused by CAS. Carotid endarterectomy and stenting are well-established clinical procedures for preventing ischemic stroke (Masuhr & Busch, 2004; Zhu et al., 2022). However, recent advances in technology have resulted in the emergence of alternative approaches such as nanocarriers (Azadi et al., 2021), stem cell therapy (Ma et al., 2023), and neural repair (Chopp, Li & Zhang, 2009) for preventing stroke or effective treatment of patients with CAS. Carotid endarterectomy is associated with a significant risk of postoperative complications, and early intervention of CAS involves a high procedural cost. Therefore, there is an urgent need of developing highly effective diagnostic biomarkers for the early indication of CAS. Several studies have demonstrated the significance of autophagy in CAS. However, autophagic biomarkers with clinical importance for the early detection, prognosis, and treatment of CAS have not been established.
This study performed in-depth bioinformatics analysis of the transcriptome data from the early and advanced CAS plaques to identify key differentially expressed ATGs (DE-ATGs) that were associated with CAS progression. We also assessed the relationship between the key CAS-related DE-ATGs and the immune cells. We also investigated the diagnostic value of the key CAS-related DE-ATGs. The expression levels of the key CAS-related DE-ATGs were further validated in the in vitro and in vivo experiments.
Materials and Methods
Data acquisition and processing
We acquired 222 autophagy-related genes (ATGs) from the human autophagy database (http://www.autophagy.lu/index.html). Two CAS mRNA expression profiles (GSE100927 and GSE28829) were downloaded from the GEO database (http://www.ncbi.nlm.nih.gov/geo/). The GSE100927 dataset was based on the GPL17077 platform (Agilent-039494 SurePrint G3 Human GE v2 8x60K Microarray 039381) and consisted of 35 early plaques and 69 advanced plaques. We chose 12 early CAS plaques and 29 advanced CAS plaques from the GSE100927 dataset for our analysis (Steenman et al., 2018). The GSE28829 dataset was based on the GPL570 platform (Affymetrix Human Genome U133 Plus 2.0 Array) and consisted of 13 early CAS plaques and 16 advanced CAS plaques. Sample collection and processing for GSE100927 and GSE28829 were performed in accordance with the guidelines of the guidelines of the Medical and Ethical Committee in Nantes, France and the Code for Proper Secondary Use of Human Tissue, respectively, and written informed consent was obtained from all patients and from next of kin for all organ donors. The probe IDs in the expression matrix were processed into gene symbols using the annotation file in the gene chip.
Identification of differentially expressed ATGs (DE-ATGs)
Principal component analysis (PCA) was performed using the “FactoMineR” and “factoextra” packages. The differentially expressed genes were identified between early and advanced atherosclerotic plaques using the “limma” package with |log2FC| > 0.5 and P-value < 0.05 as the threshold parameters. The heatmap, volcano plots, and boxplots were generated with the “heatmap” and “ggplot2” packages. The DE-ATGs were identified by taking intersections of the DEGs with the 222 ATGs through an online web tool (https://bioinformatics.psb.ugent.be/webtools/Venn/).
Functional enrichment analysis of DE-ATGs
GO and KEGG enrichment analyses of the DE-ATGs were performed using the “clusterProfiler” and “GOplot” packages in the R software and the results were visualized using bubble plots and the chord diagram.
Protein-protein interaction (PPI) analysis and identification of key CAS-related DE-ATGs
PPI network of the DE-ATGs was constructed using the STRING online database (https://string-db.org/). Interactions between the DE-ATGs were visualized using the Cytoscape software (version 3.9.1). The key CAS-related DE-ATGs were extracted using the cytoHubba plugin. The GSE28829 dataset was used to validate the statistical significance of these key CAS-related DE-ATGs in the early and advanced CAS plaques.
Diagnostic value of the key CAS-related DE-ATGs
The “pROC” package was used to test the diagnostic value of these key CAS-related DE-ATGs in the GSE100927 dataset. Furthermore, the logistic regression model of the key DE-ATGs was generated and tested using the GSE100927 dataset. The GSE28829 dataset was used as the external validation dataset.
Immune cell infiltration analysis
CIBERSORT is a bioinformatic tool to determine the cellular composition of tissues based on their gene expression profiles (Ke et al., 2024). The proportion of 22 immune cell types, including B cells, T cells, macrophages, and NK cells, in the early and advanced CAS samples of GSE100927 were analyzed with CIBERSORT using the LM22 signature matrix as reference (Newman et al., 2015). We performed up to 1,000 permutations and retained samples with P < 0.05 to ensure accuracy of the results. The sum of various immune cells was set as 1. The results from CIBERSORT were visualized using the ggbarplot, ggplot2, ggcorrplot, and heatmap R packages.
Cell culture
Human umbilical vein endothelial cells (HUVECs; AW-CNH488) and human aorta vascular smooth muscle cells (HAoSMCs; AW-YCH013) were purchased for this study from Abiowell Biotechnology Co. Ltd (Changsha, China). HUVECs and HAoSMCs were grown in Dulbecco’s Modified Eagle Medium (105690010; Gibco, Grand Island, NY, USA) at 37 °C and 5% CO2 in a humidified incubator. The cells in the AS group were treated with 50 μg/mL ox-LDL (YB-002; Yiyuan Biotechnologies, Guangzhou, China) for 24 h after they reached 70–80% confluence. The cells grown in normal medium were regarded as the control group.
Western blotting
The cells were lysed in the RIPA buffer (SL1020; Coolaber, Bernards, NJ, USA) and the protein lysates were quantified. Equal amounts of protein lysates were electrophoresed on the SDS-PAGE. The separated proteins were transferred onto the PVDF membranes. The membranes were blocked with 5% skimmed milk for 1 h at room temperature. Subsequently, the membranes were incubated overnight at 4 °C with the following rabbit polyclonal primary antibodies against CCL2 (A7277; Abclonal, Woburn, MA, USA), LAMP2 (ab199947; Abcam, Cambridge, UK), CTSB (12216-1-AP; Proteintech, Rosemont, IL, USA), and β-actin (20536-1-AP; Proteintech, Rosemont, IL, USA). Then, the membranes were incubated with the anti-rabbit IgG-HRP antibody (A21020; Abbkine, Atlanta, GA, USA). The protein band signals were developed using the ECL Detection System (WBKLS0500; Merck Millipore, Burlington, MA, USA).
Quantitative real-time PCR (qRT-PCR)
Total RNA samples were prepared using the Trizol reagent (15596026; Invitrogen, Waltham, MA, USA). Then, cDNA was generated from the total RNA using the RevertAid First Strand cDNA Synthesis Kit (K1622; Thermofisher, Waltham, MA, USA). Real-time qPCR was performed using the SYBR Green Master Mix (11201ES08; Yeasen Biotechnology, Shanghai, China). The individual mRNA expression levels were normalized to GAPDH. All the primer sequences are listed in Table S1.
Animals
All animal experiments were approved by the Animal Care and Use Committee of the University of South China (permission No. USC2023XS085) and conducted in accordance with the National Institutes of Health Guide. Six male 8-week-old ApoE−/− mice on a C57BL/6J background and six wild-type C57BL/6J mice were purchased from the Vital River Laboratory Animal Center (Beijing, China) and housed under a 12 h light/dark cycle with free access to drinking water and food in an environmentally controlled room (20–26 °C, 60% humidity). Among these, six wild-type C57BL/6J mice fed on normal chow diet containing 4% fat and 0% cholesterol were considered as the control group, and six ApoE−/− mice fed on a Western diet containing 20% fat and 1.25% cholesterol were considered as the AS group. After 12 weeks, the experimental mice were euthanized by CO2 asphyxiation. Stack experimental animals in the euthanasia box, and introduce CO2 to the animal. There were no mice left in this study and were used for experiments. The mice were anaesthetized and sacrificed for collection of aortic tissue and follow-up examinations.
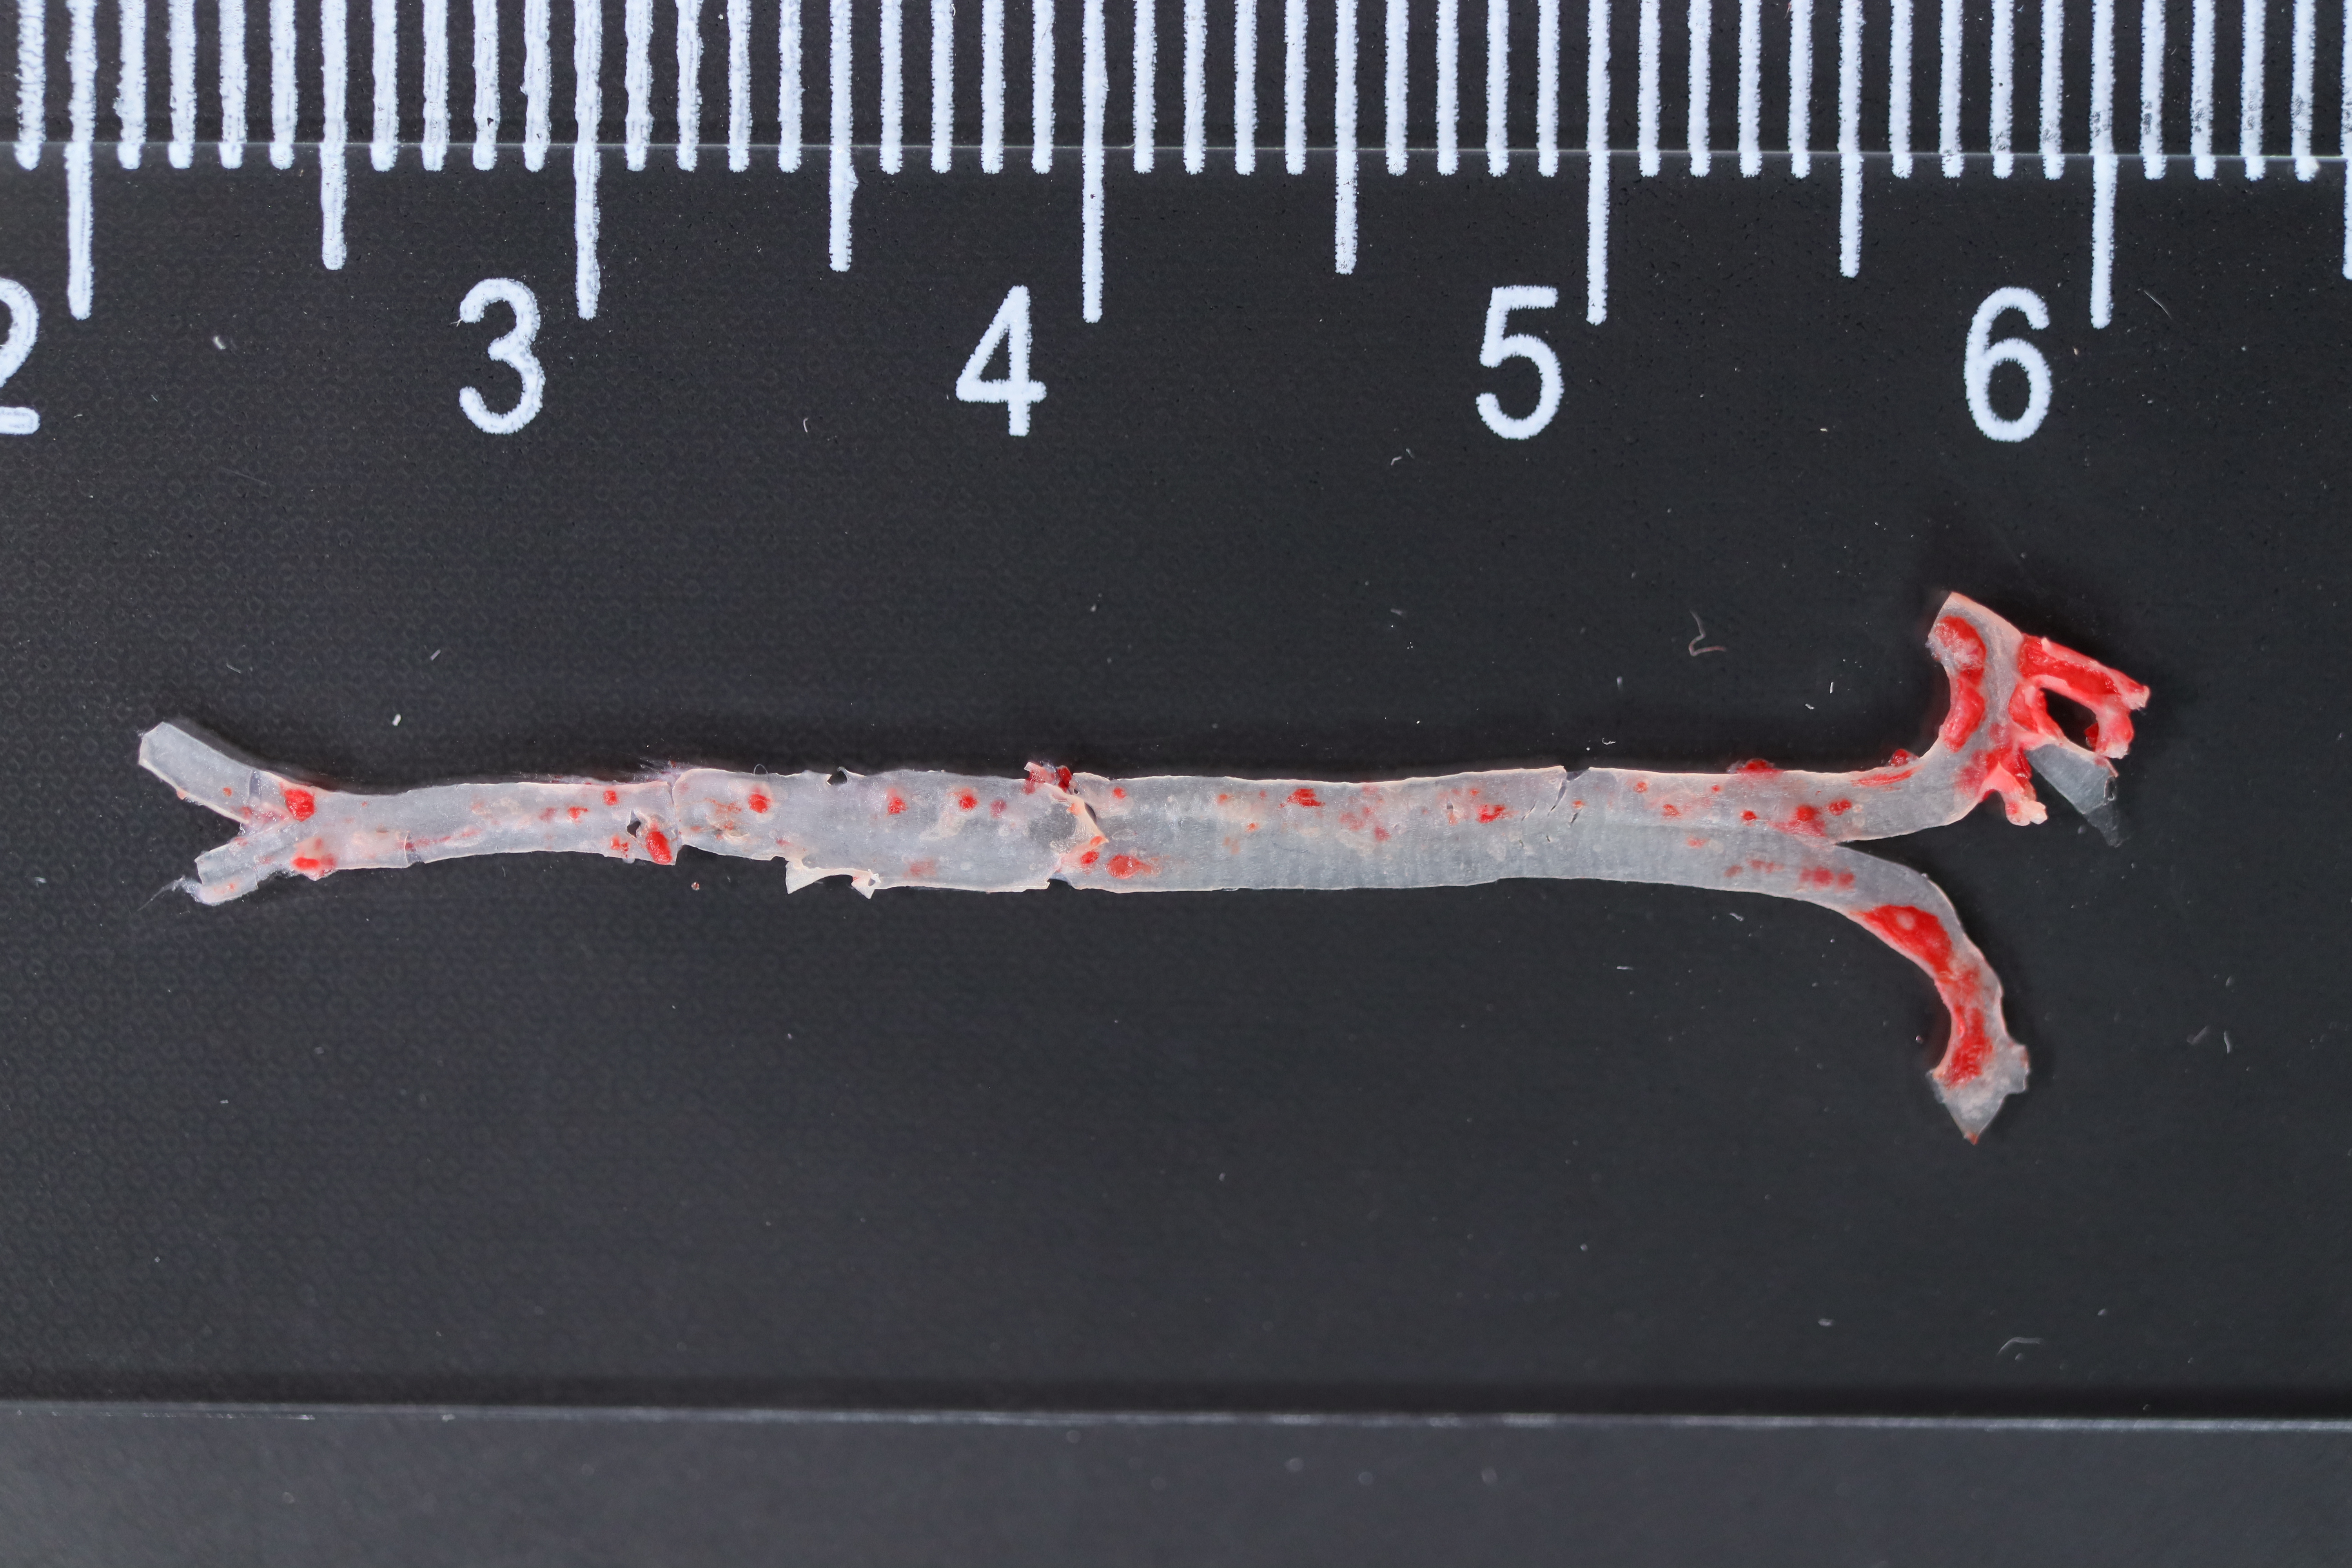
Oil Red O (ORO) staining
The entire aorta from the ascending aorta to the bifurcation of the iliac arteries was isolated, stripped of peripheral vascular fat, and incised longitudinally. Then, it was stained with the ORO dye (G1015; Servicebio, Hubei, China) and photographed with a digital camera. The percentage of area occupied by the ORO-positive area was assessed using the ImageJ software (NIH).
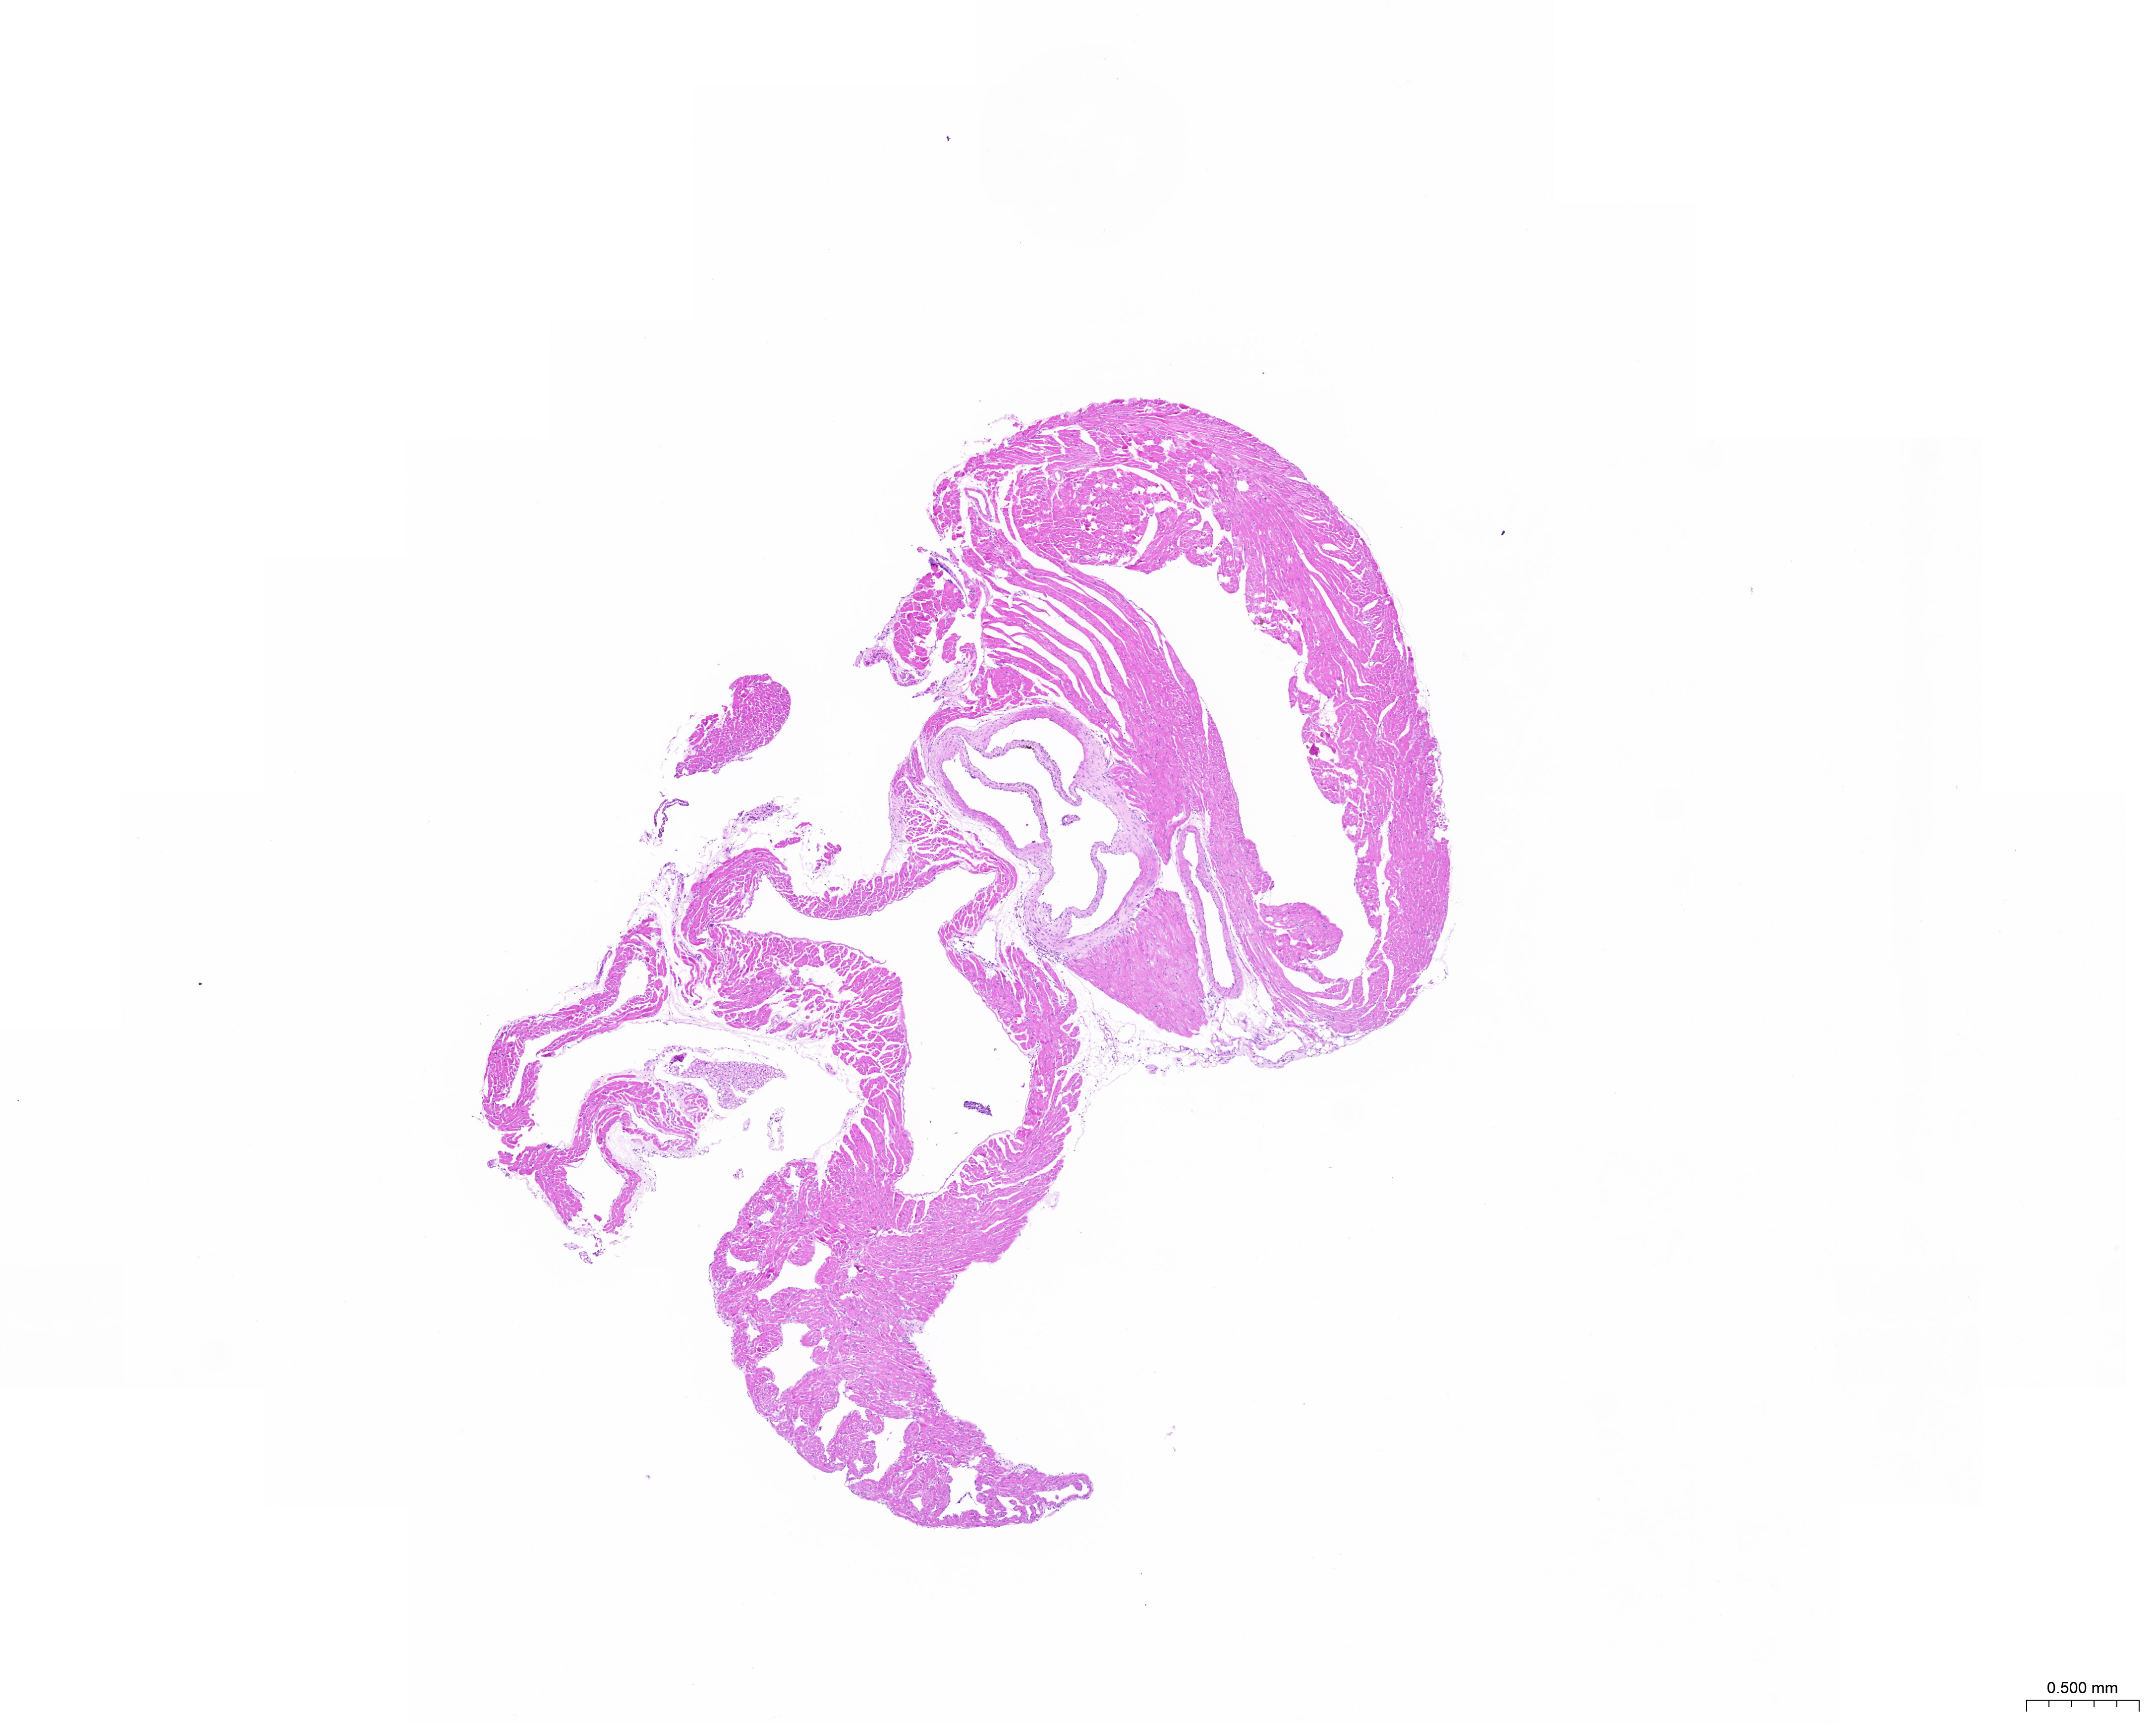
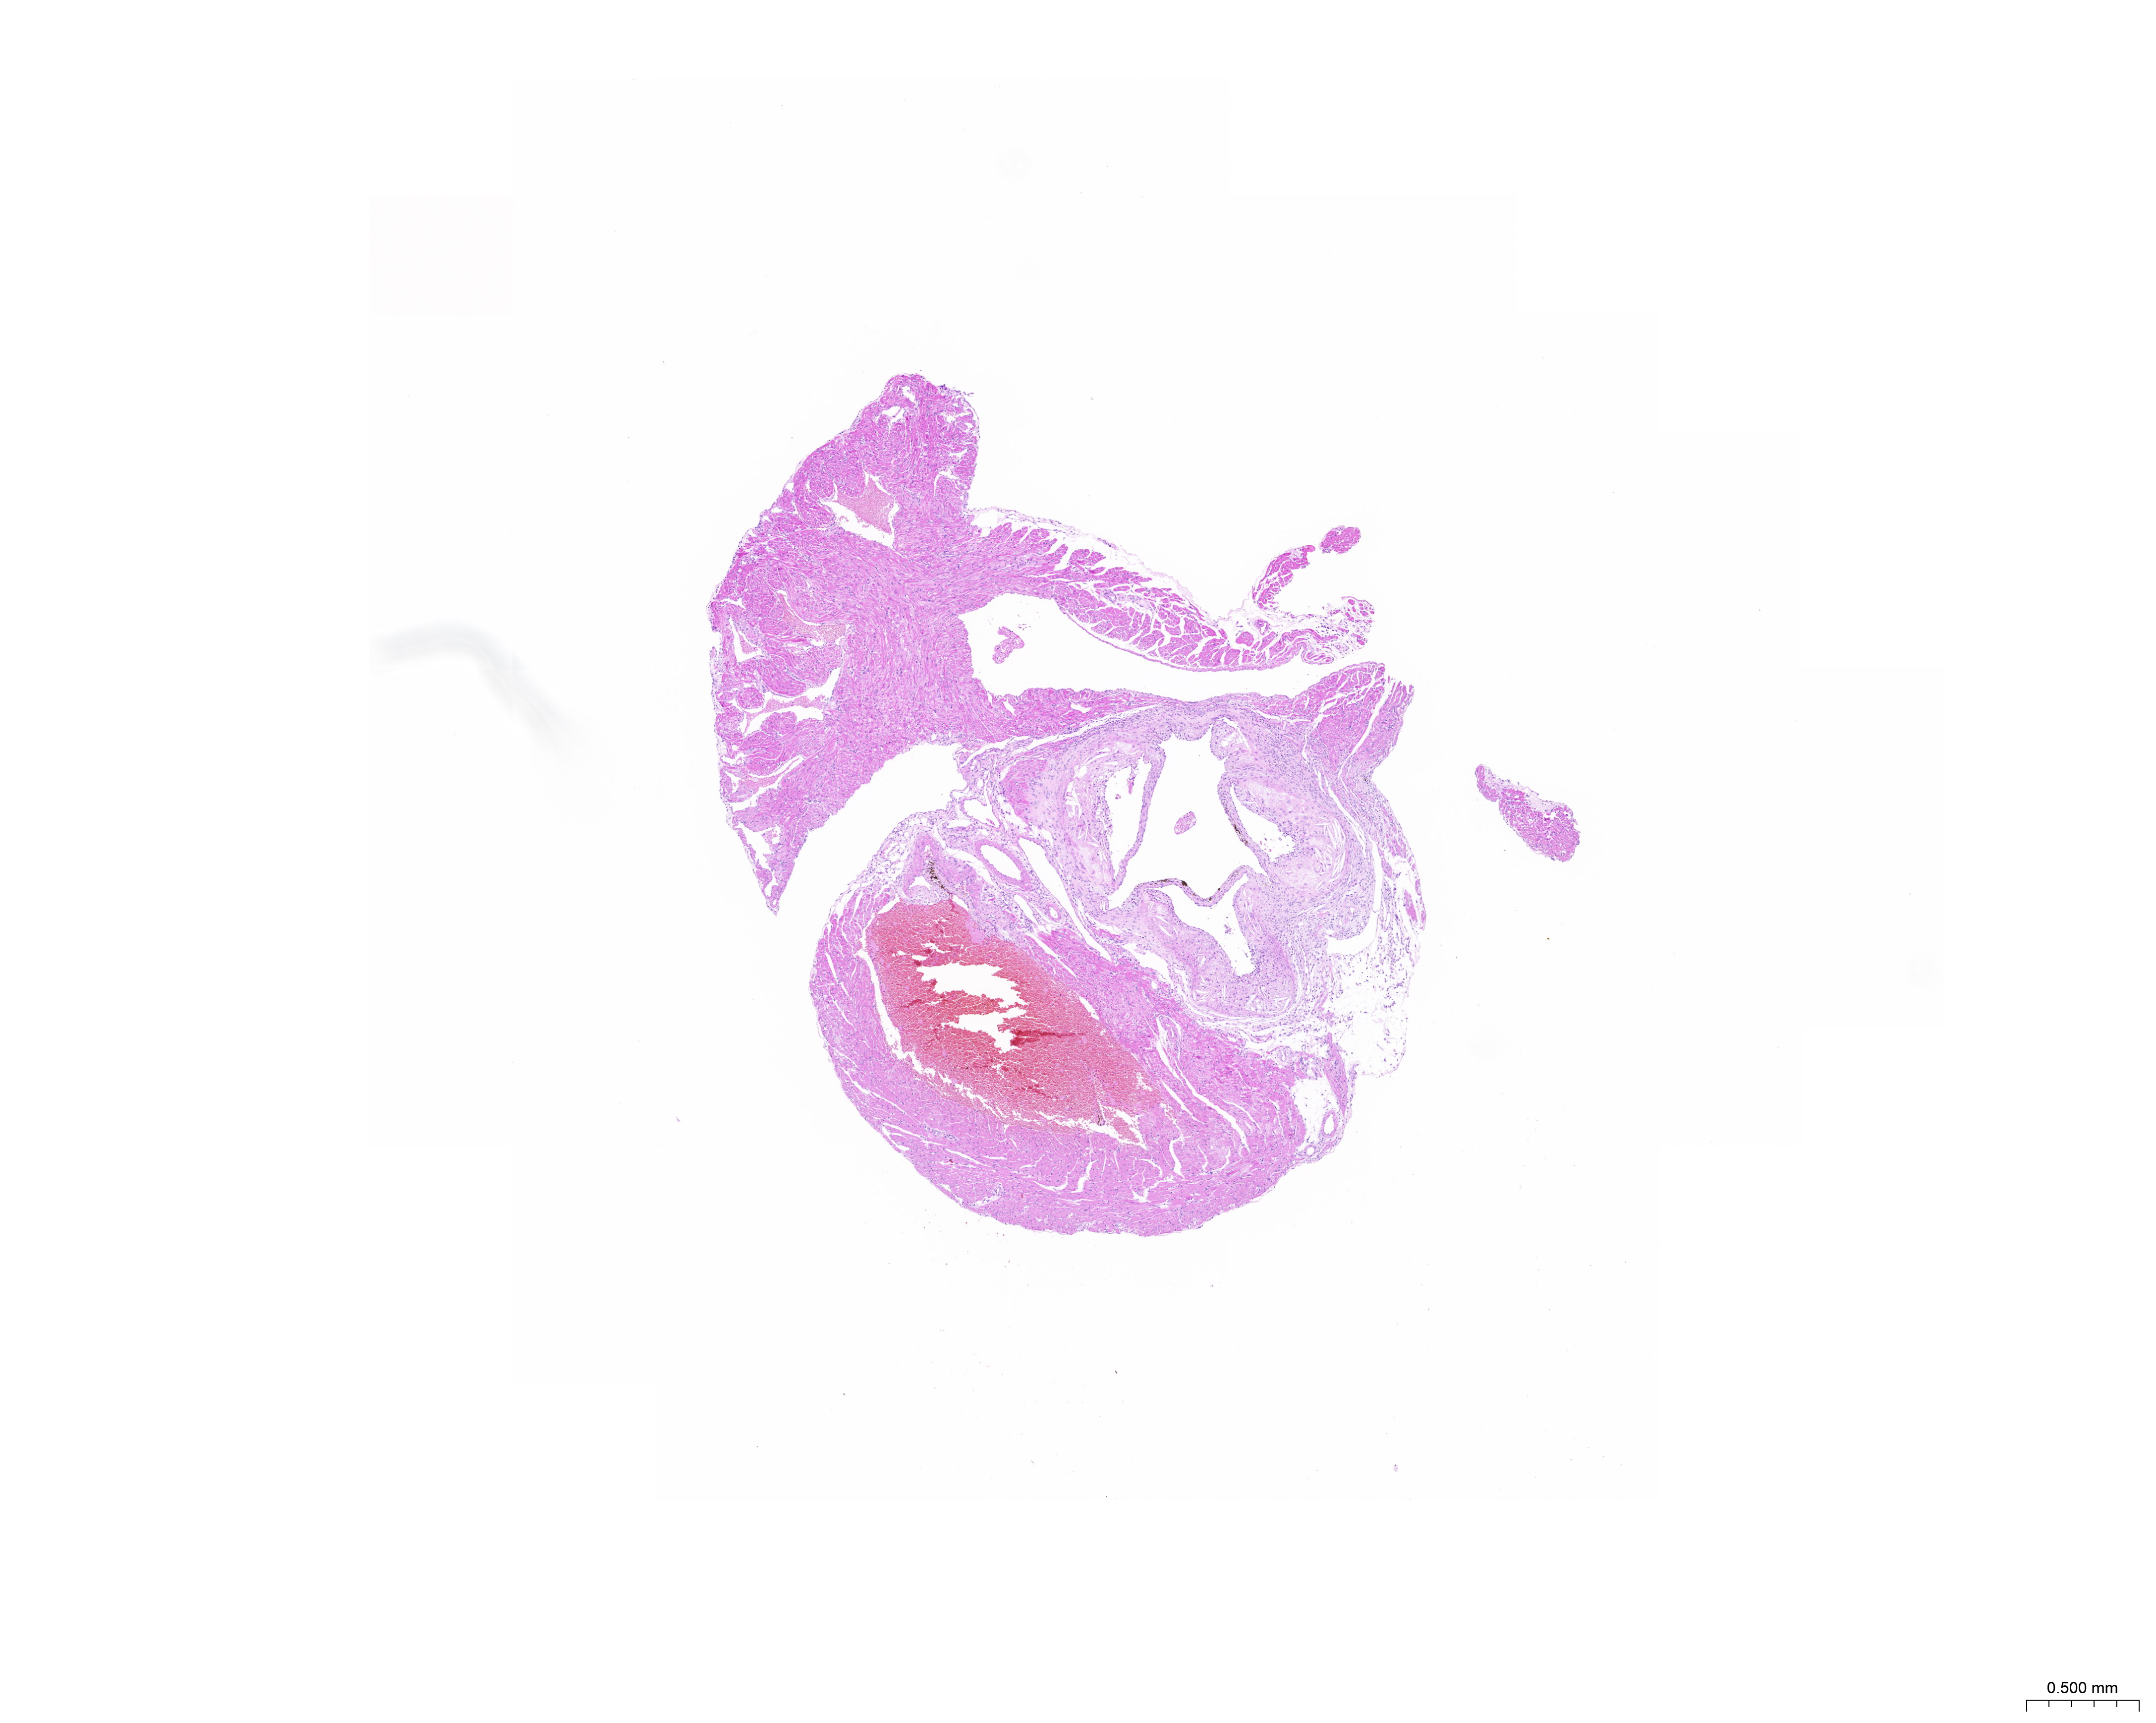
Hematoxylin and eosin (HE) staining
The aortic root tissue was fixed with 4% PFA (G1101; Servicebio, Hubei, China), embedded in paraffin, and sectioned. The sections were baked in the oven, deparaffinized, hematoxylin-stained, eosin-stained, dehydrated in alcohol, placed in xylene, sealed with a cover slip, and observed under the microscope. The aortic root plaque area was quantified by ImageJ software.
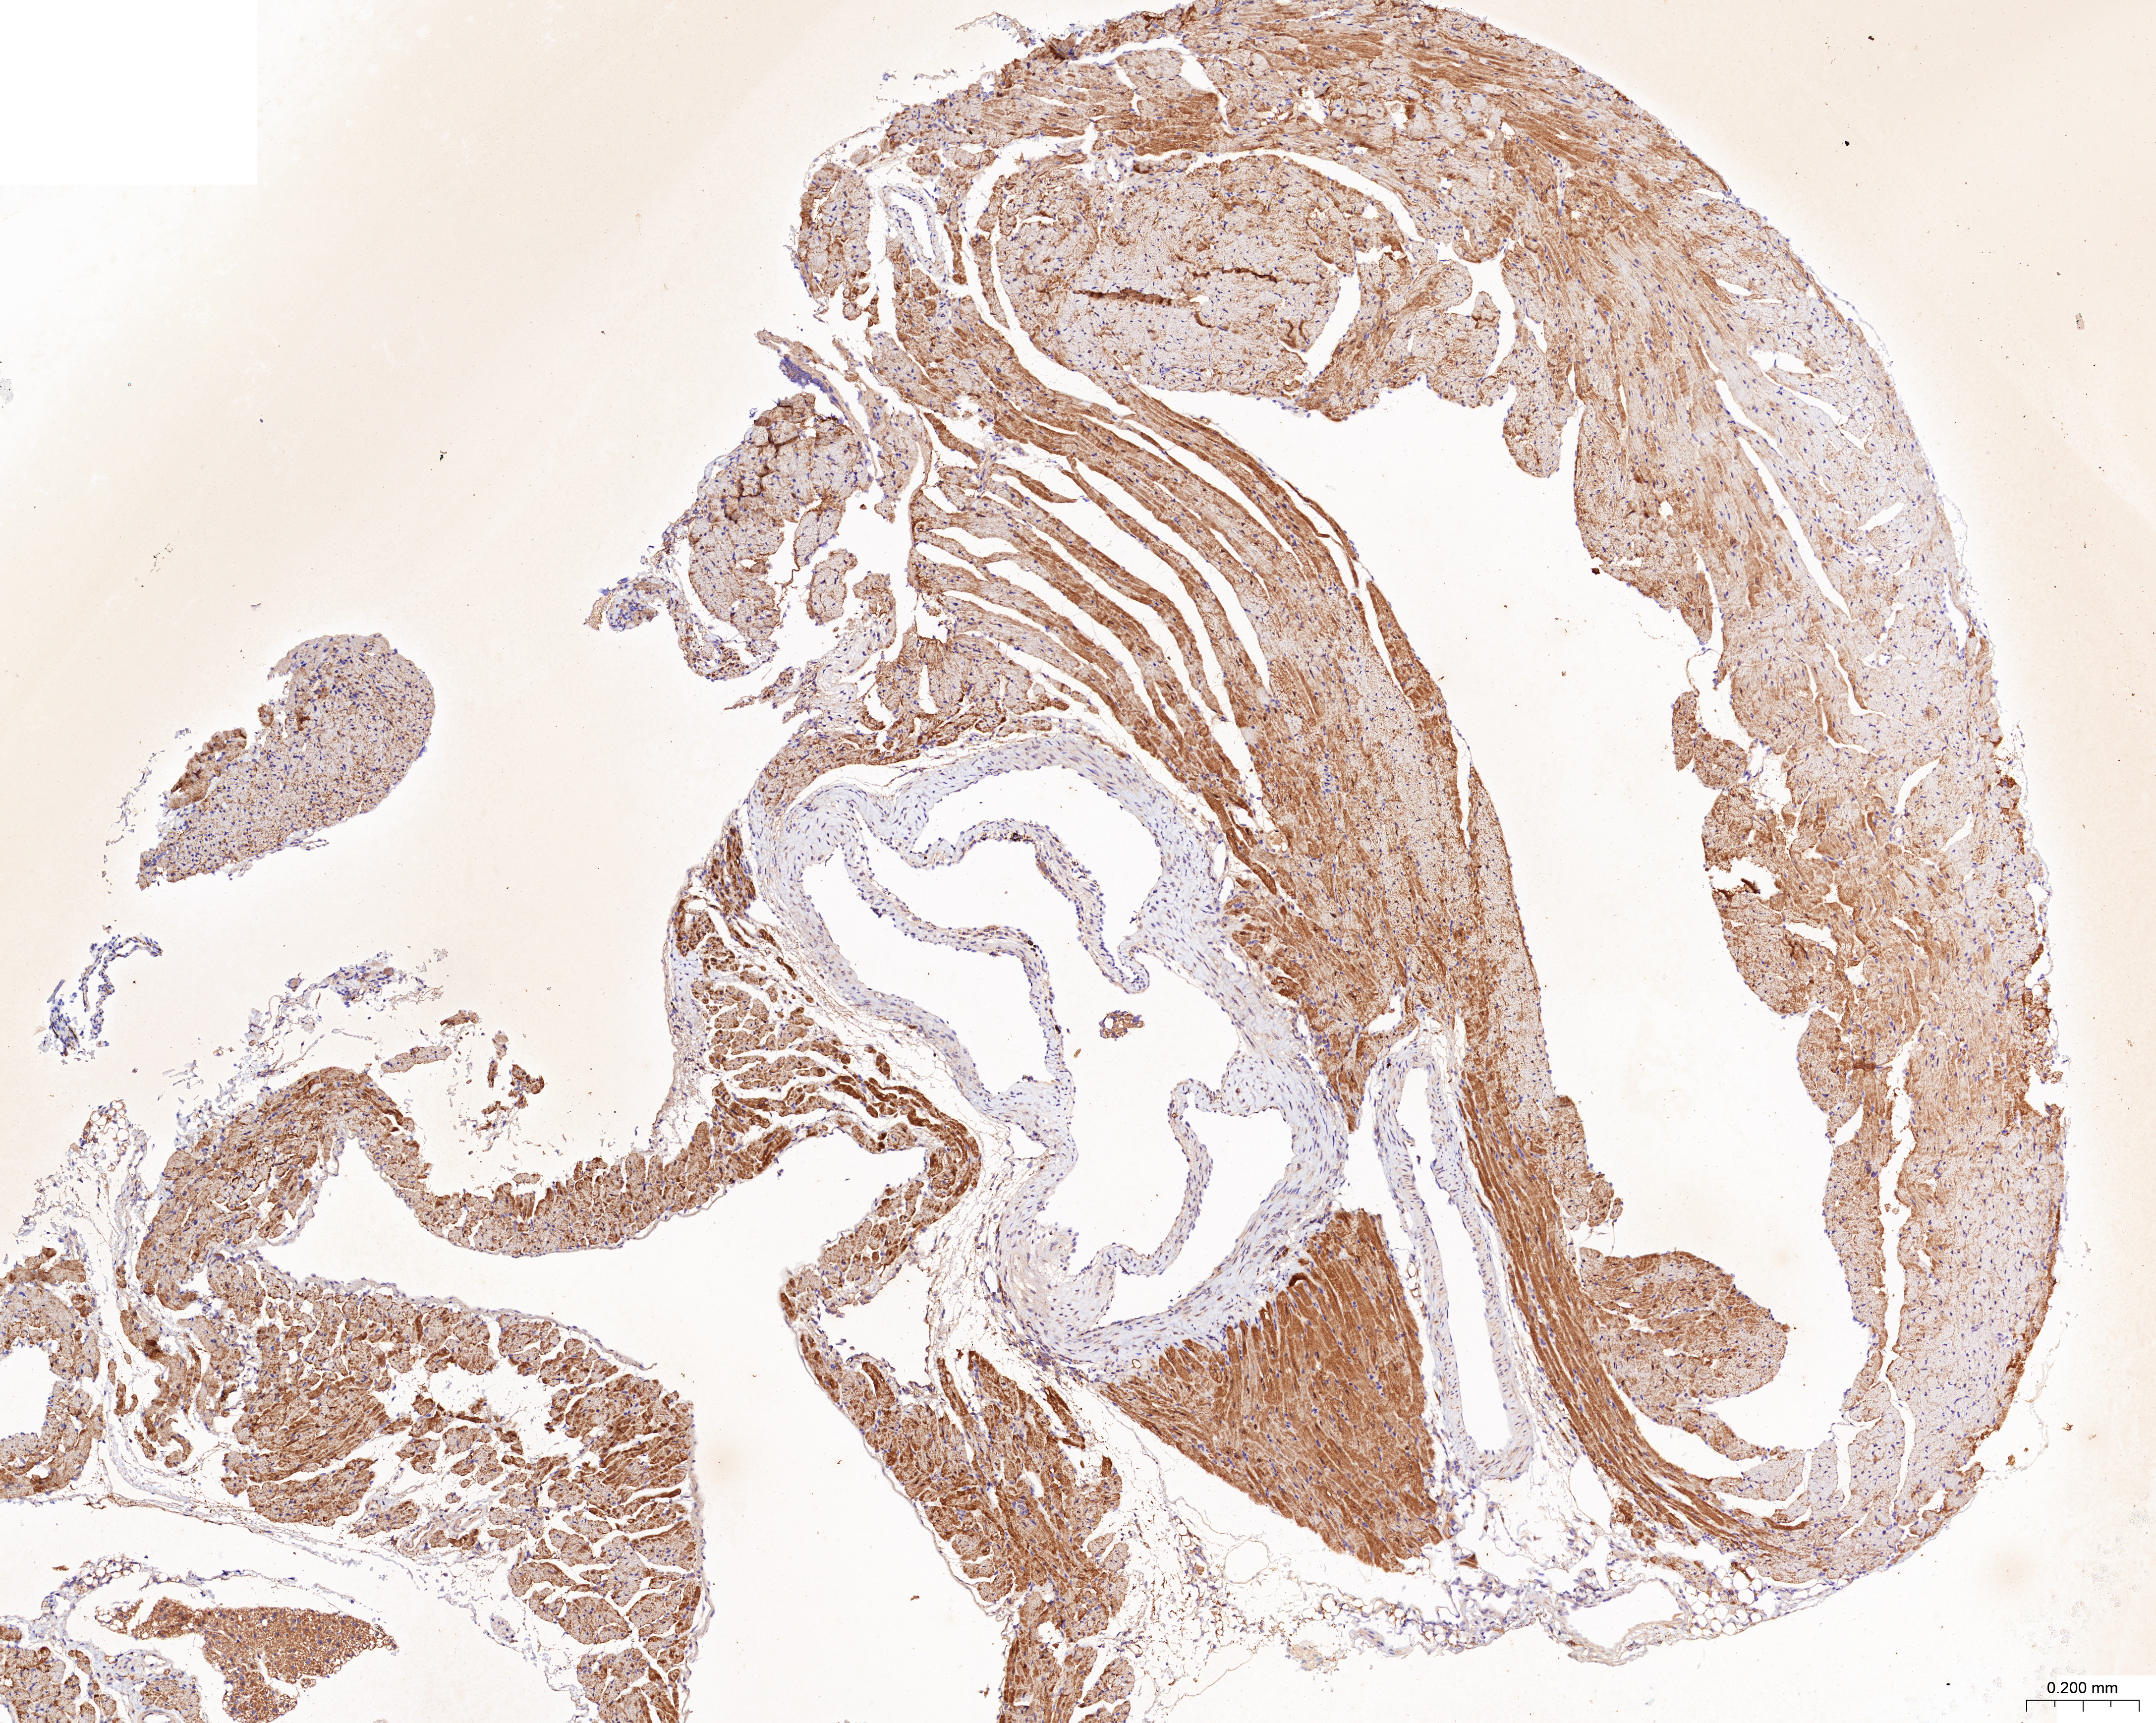
Immunohistochemistry (IHC) staining
The sections of aortic root tissue samples were baked in an oven and deparaffinized. Subsequently, the sections were subjected to antigen retrieval at high temperature and incubated with 3% hydrogen peroxide. The sections were incubated with rabbit polyclonal primary antibodies against CCL2 (A7277; Abclonal, Woburn, MA, USA), LAMP2 (ab199947; Abcam, Cambridge, UK), and CTSB (12216-1-AP; Proteintech, Rosemont, IL, USA). Then, the sections were incubated with the anti-rabbit IgG polymer (PV-9001; ZSGB-Bio, Beijing, China). The sections were then incubated with the DAB working solution (ZLI-9018; ZSGB-Bio, Beijing, China), counterstained with hematoxylin, dehydrated in alcohol, placed in xylene, and finally sealed with a coverslip. The stained sections were observed and photographed under the microscope. ImageJ software was used to quantify the ratio of the yellow-positive area to the aortic root plaque area.
Statistical analysis
Statistical analysis was performed using the GraphPad Prism 9 software and R software (version 4.3.0). Student’s t-test was used to determine statistical significance between groups. P-value < 0.05 was considered statistically significant.
Results
Identification of CAS-related DE-ATGs
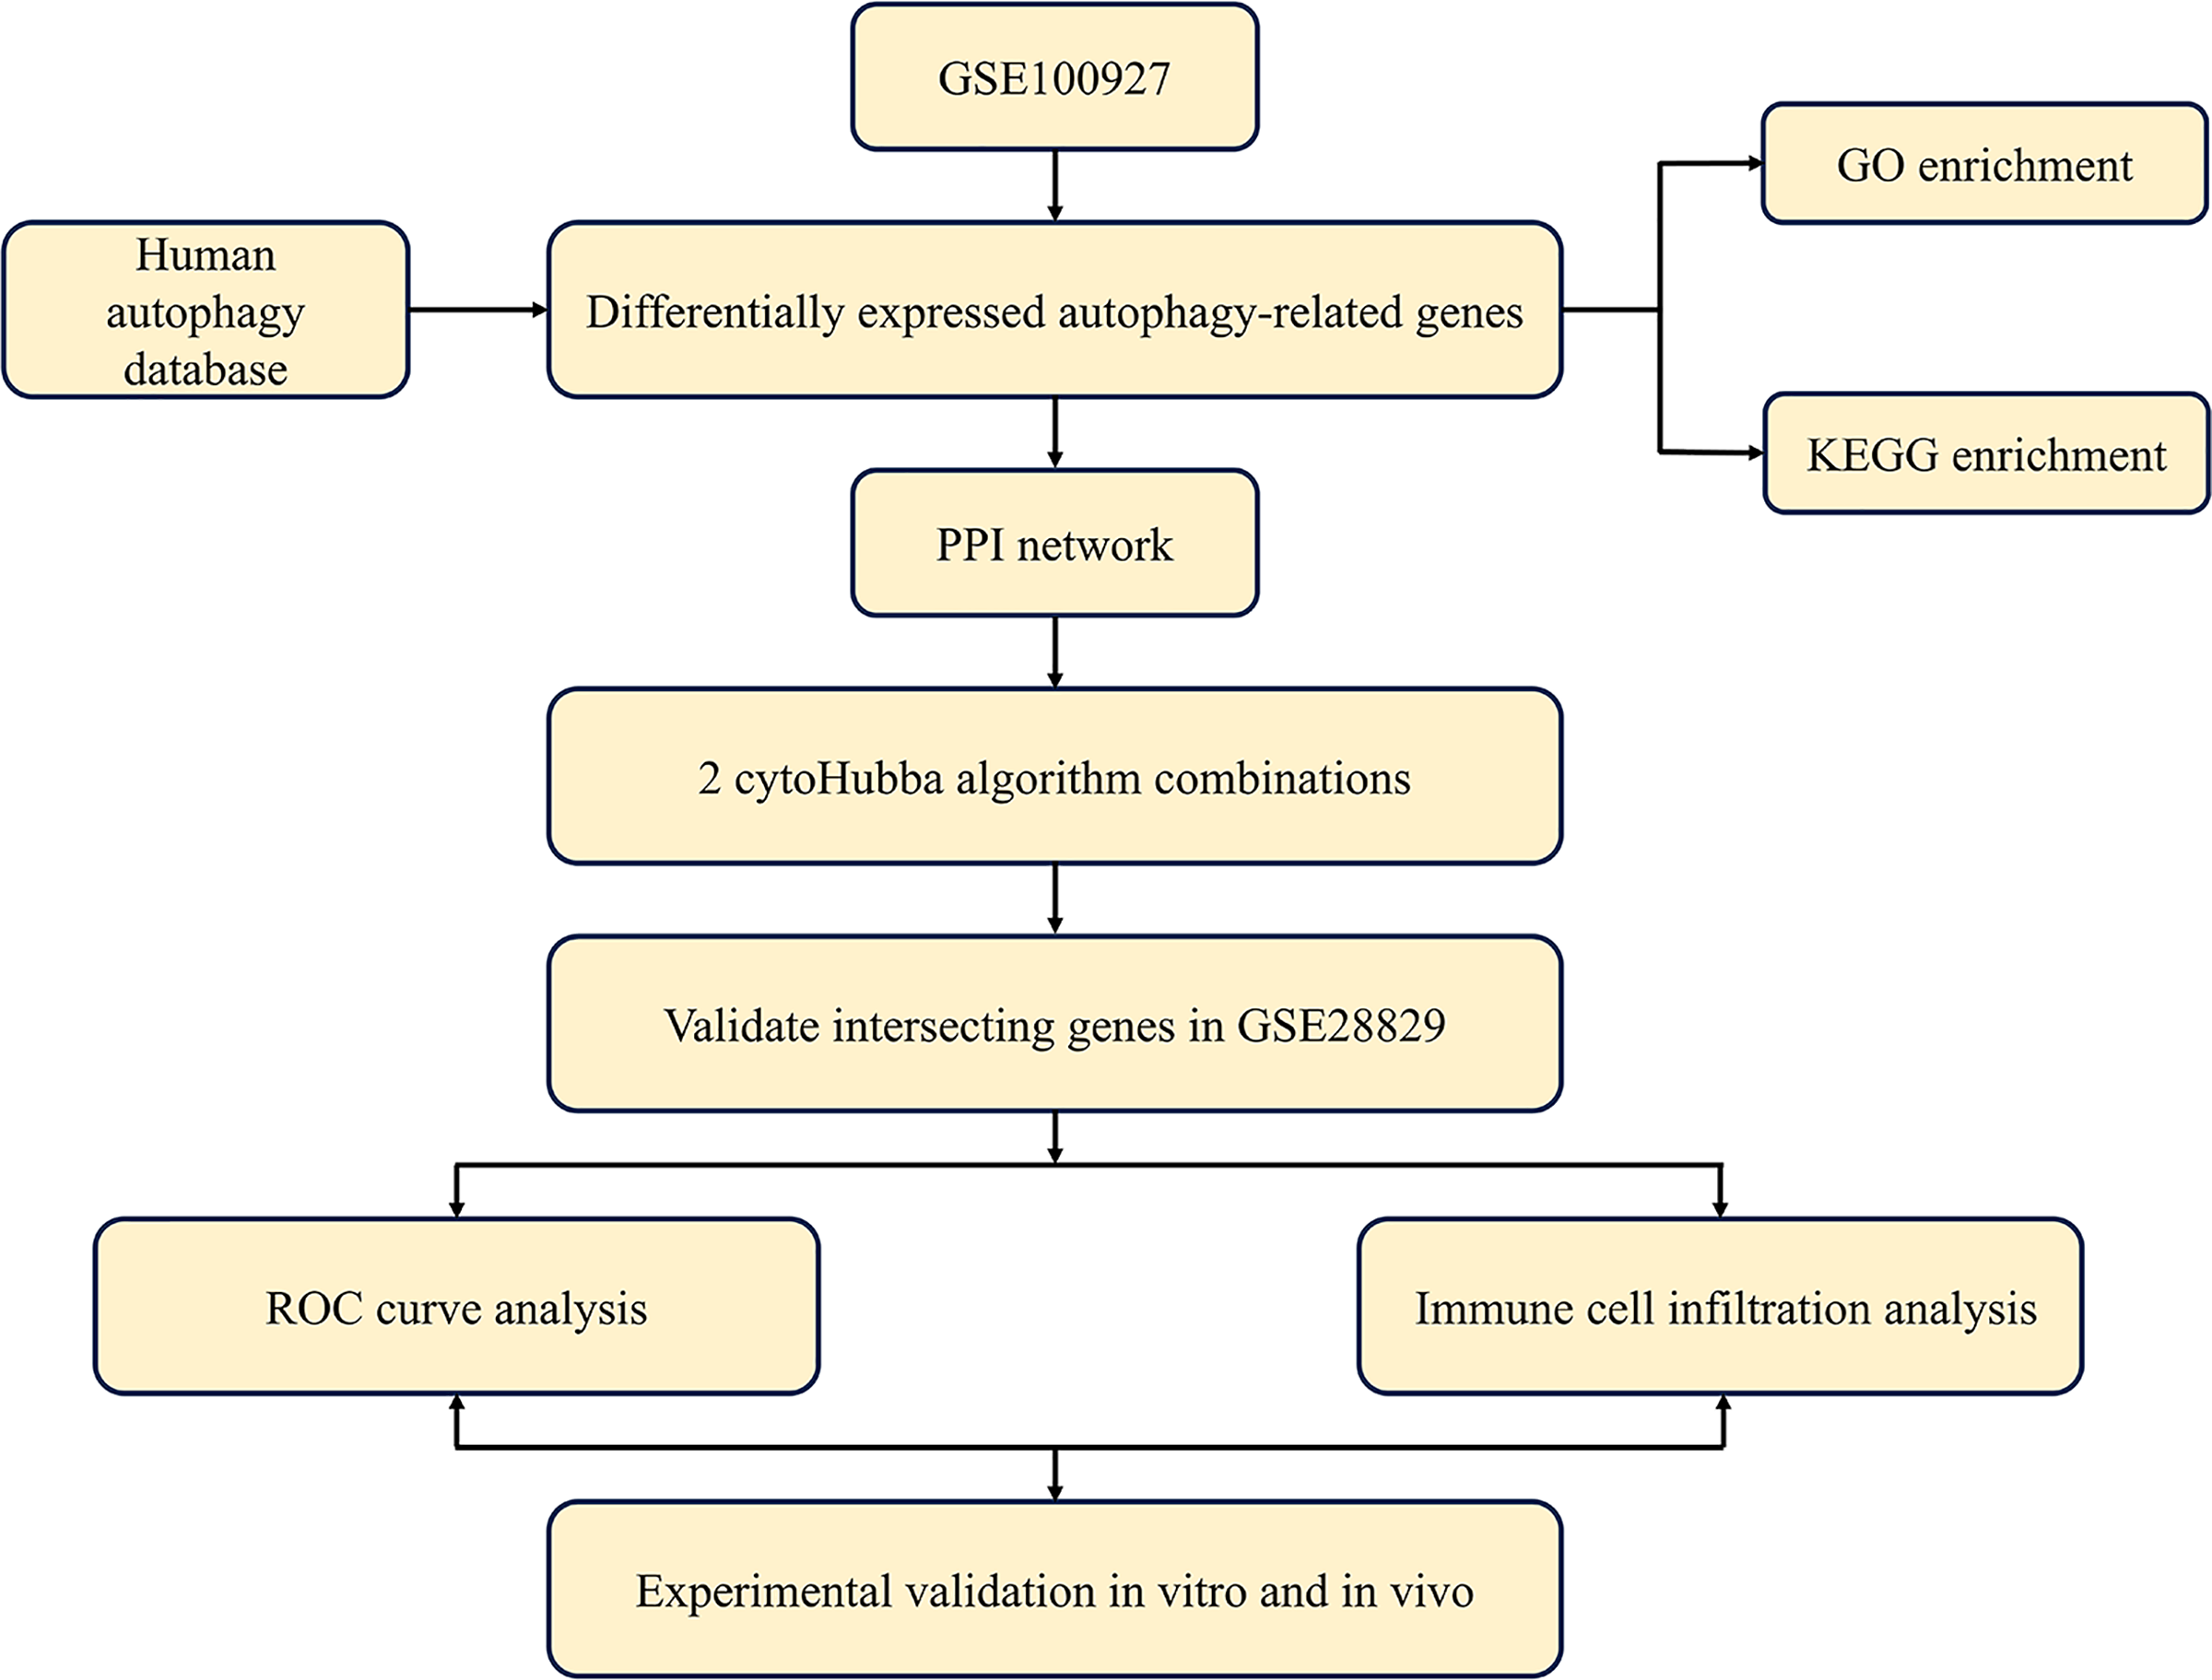
The study’s overall flowchart is presented in Fig. 1. Principal component analysis (PCA) was performed to compare the CAS and control groups in the GSE100927 dataset. We obtained two distinct groups with significant differences (Fig. 2A). Our data showed upregulation of 1,973 genes and downregulation of 1,590 genes in the CAS group compared with the control group (Fig. 2B). Furthermore, overlapping of these DEGs with the 222 ATGs resulted in the identification of 41 DE-ATGs (33 upregulated and eight down-regulated ATGs) (Fig. 2C). The heatmap of DE-ATGs in different samples is shown in Fig. 2D. Boxplots showed the differences in the gene expression levels of 41 DE-ATGs in the CAS and control samples. The top five up-regulated genes were CTSB, CTSD, CXCR4, SERPINA1, and RGS19; and the top five downregulated genes were HSPB8, EGFR, NCKAP1, ERBB2, and CX3CL1 (Figs. 3A and 3B).
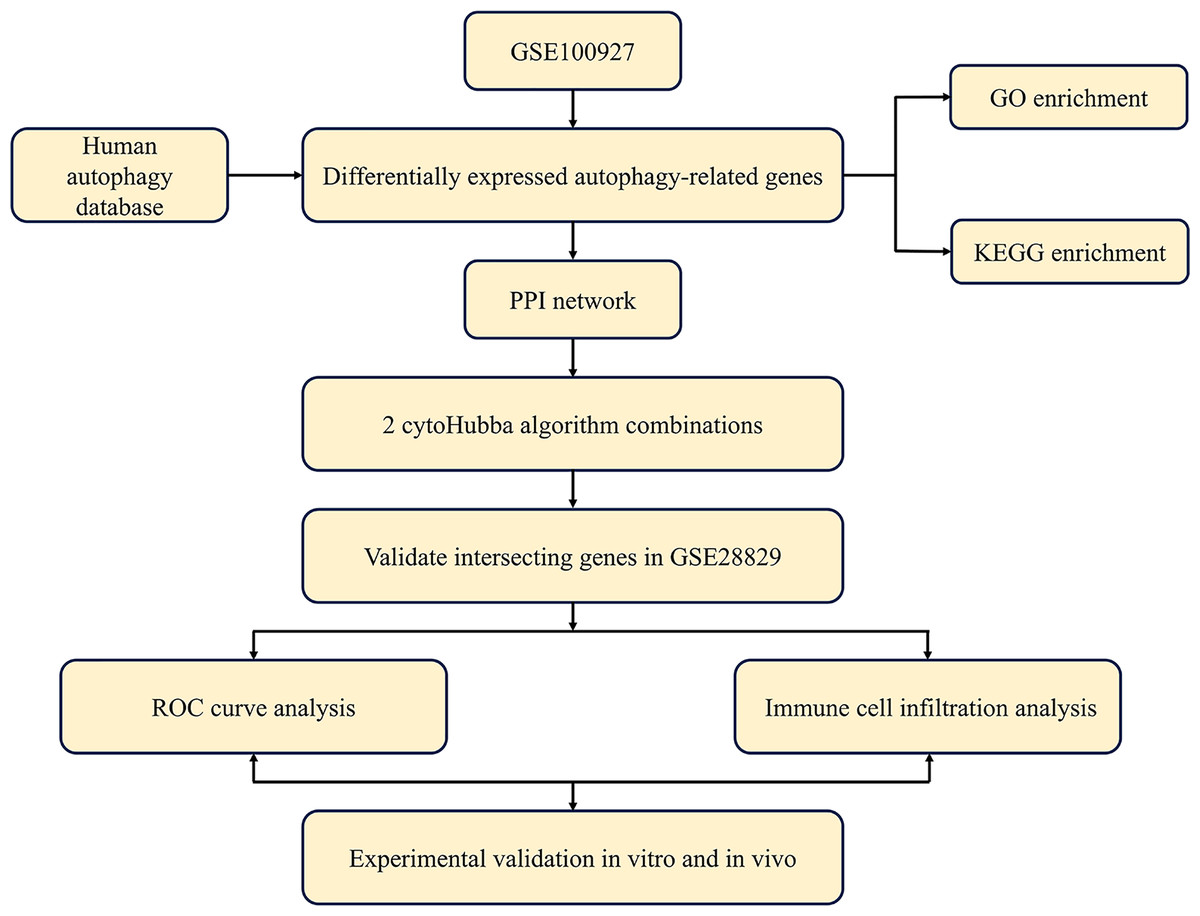
Figure 1: Overall flowchart of this study.
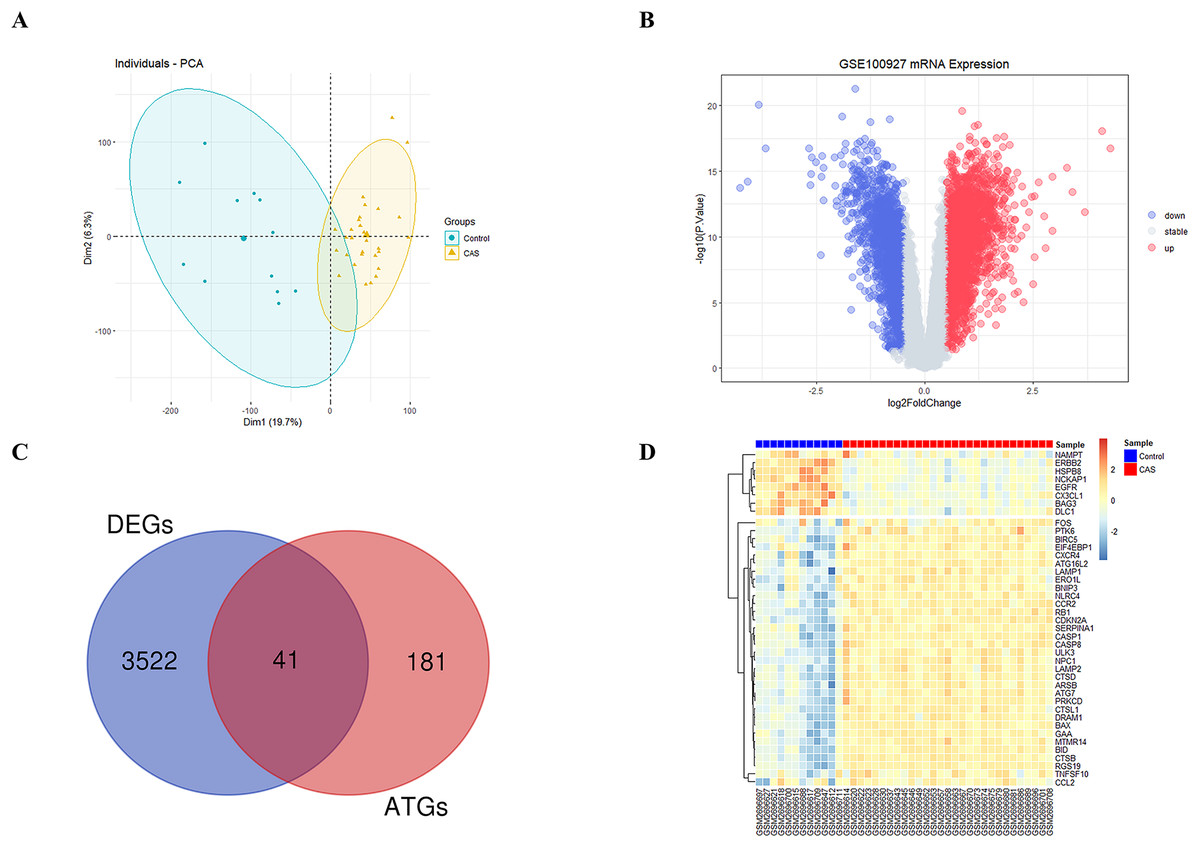
Figure 2: The DE-ATGs in CAS and control samples.
(A) PCA for GSE100927. (B) The volcano plot of GSE100927, (C) the Venn plot and (D) the heatmap of DE-ATGs.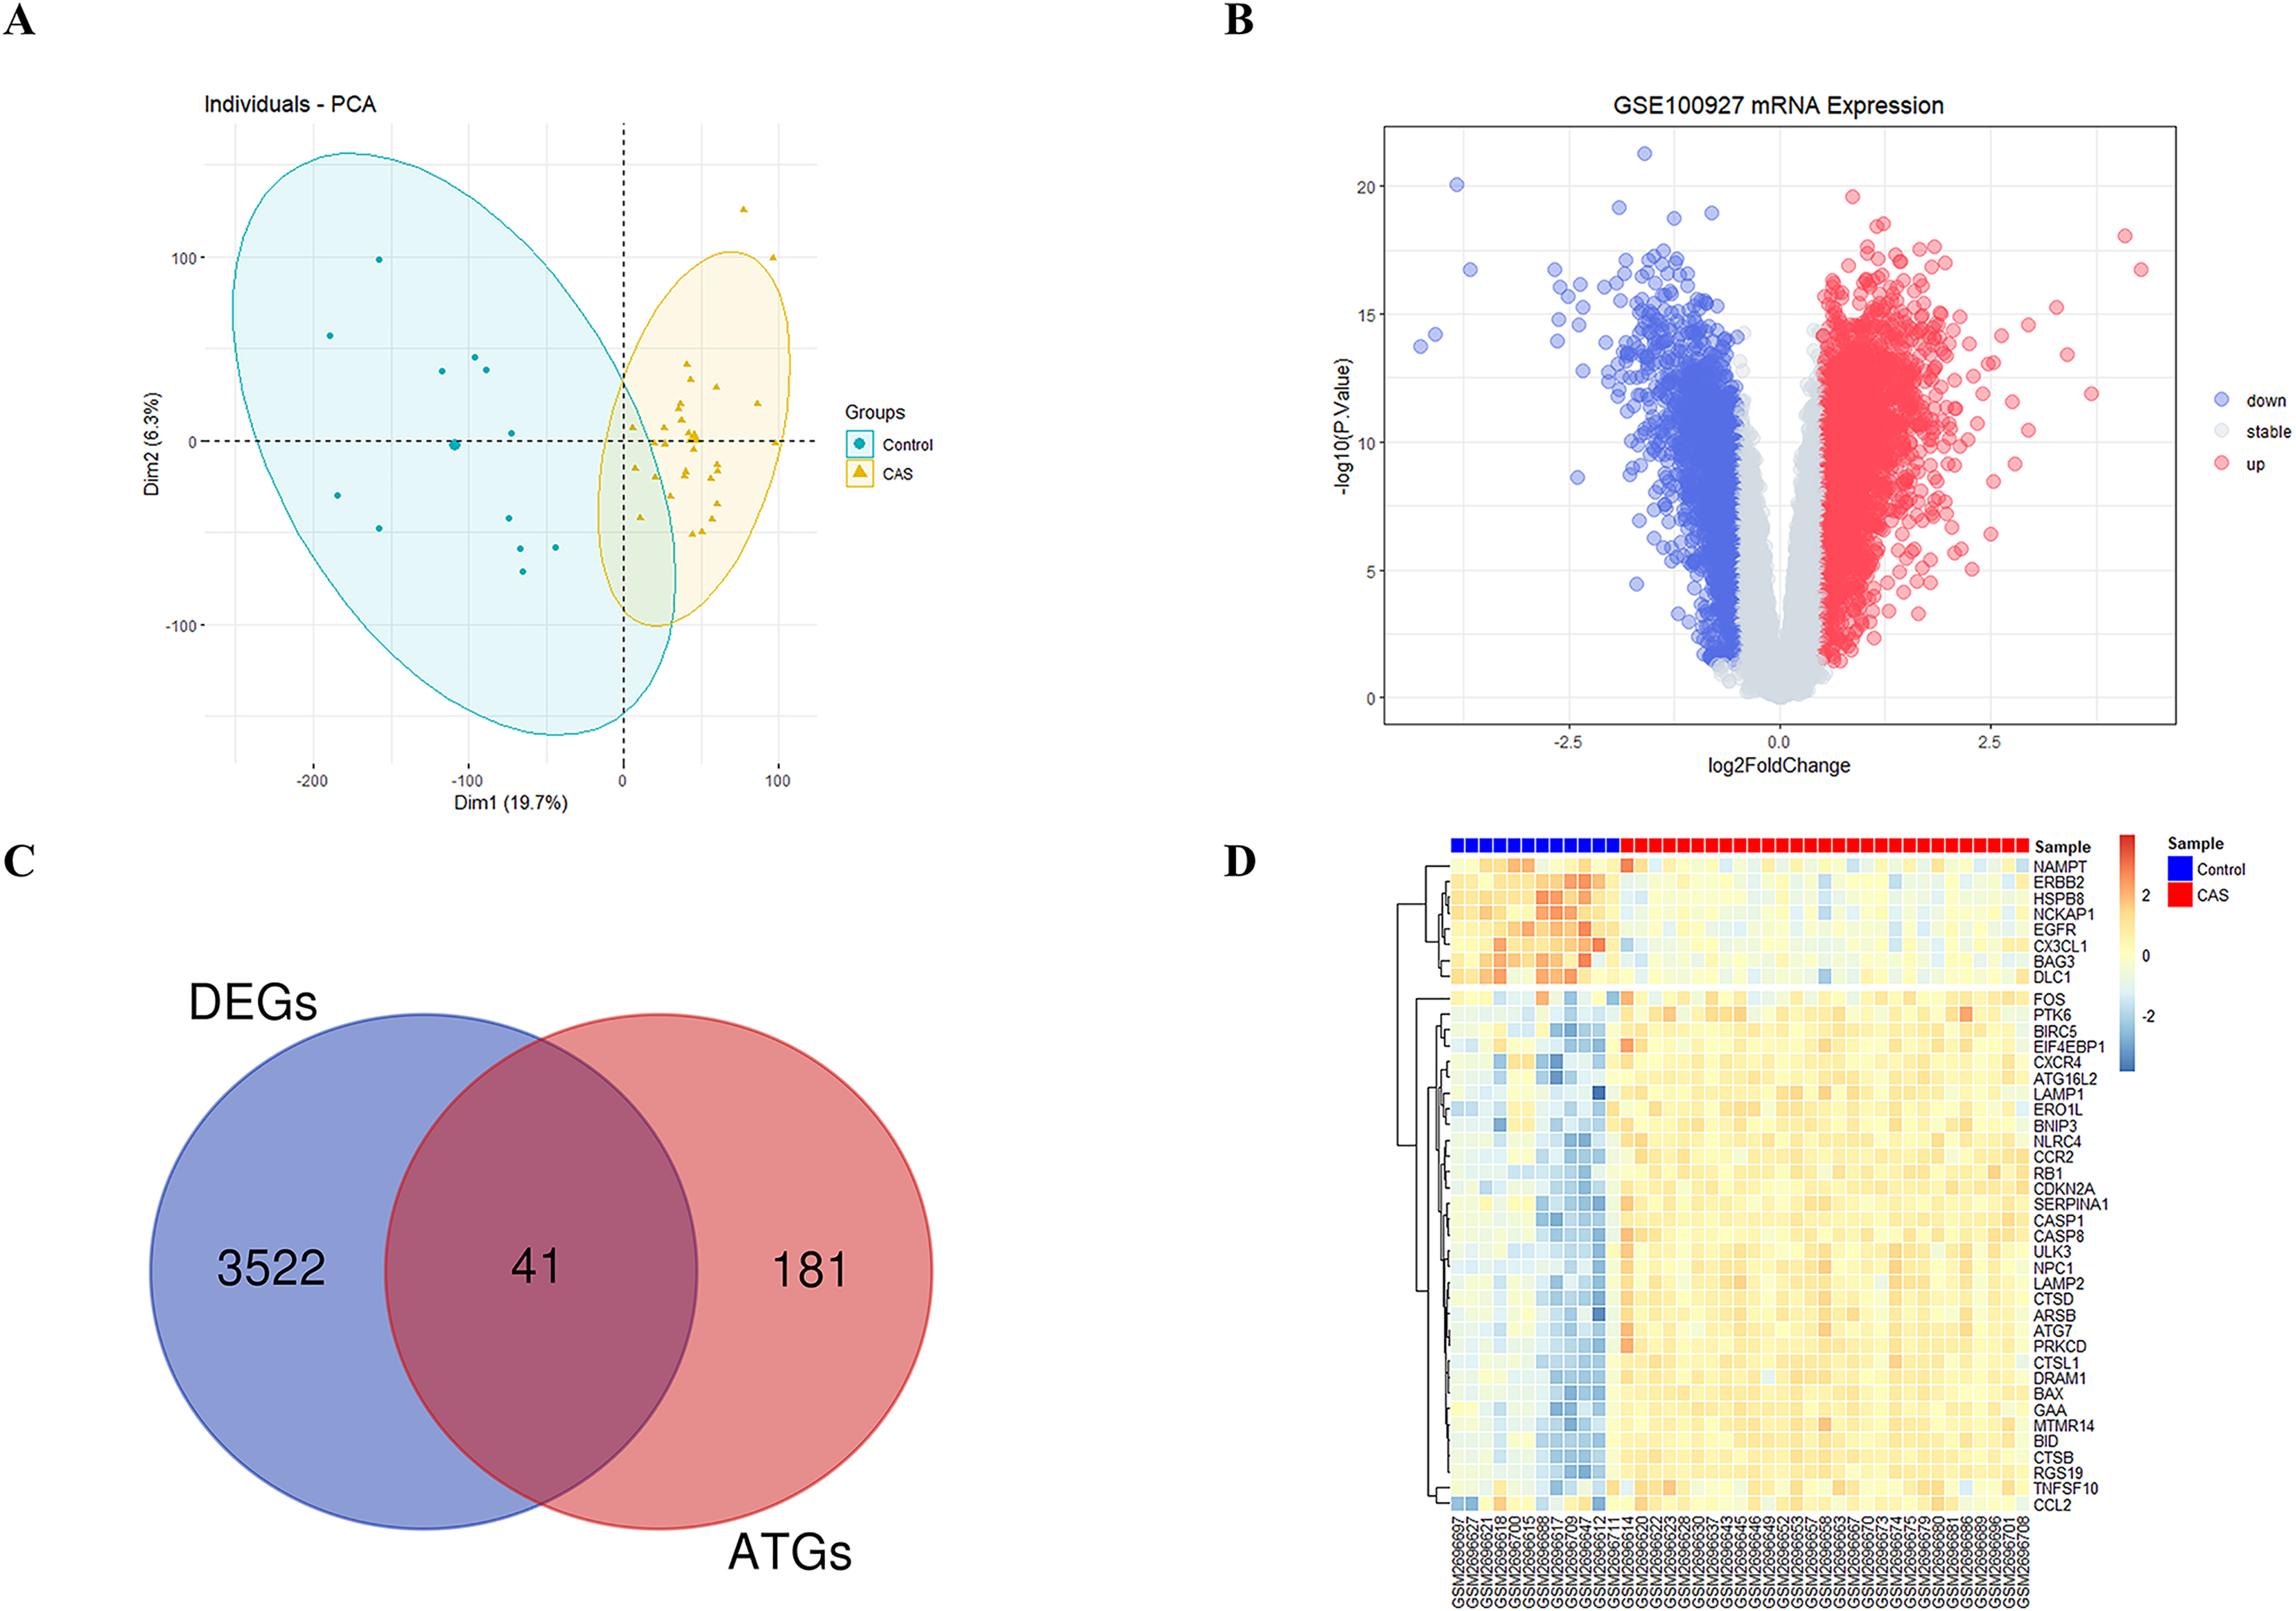
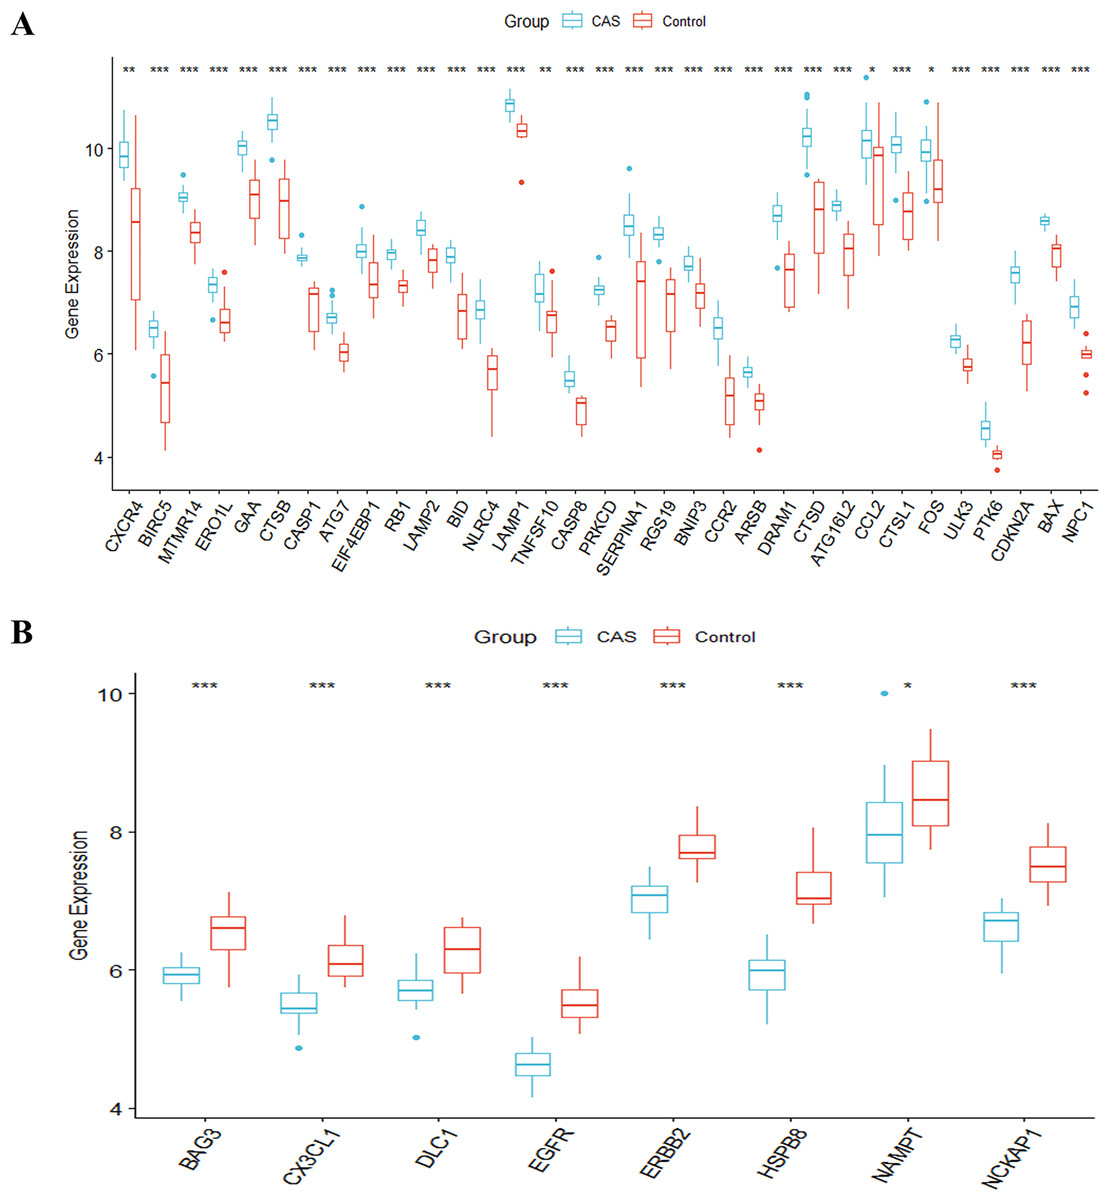
Figure 3: The boxplot of 41 DE-ATGs.
(A) The boxplot of 33 up-regulated DE-ATGs. (B) The boxplot of eight down-regulated DE-ATGs. *P < 0.05; **P < 0.01; ***P < 0.001.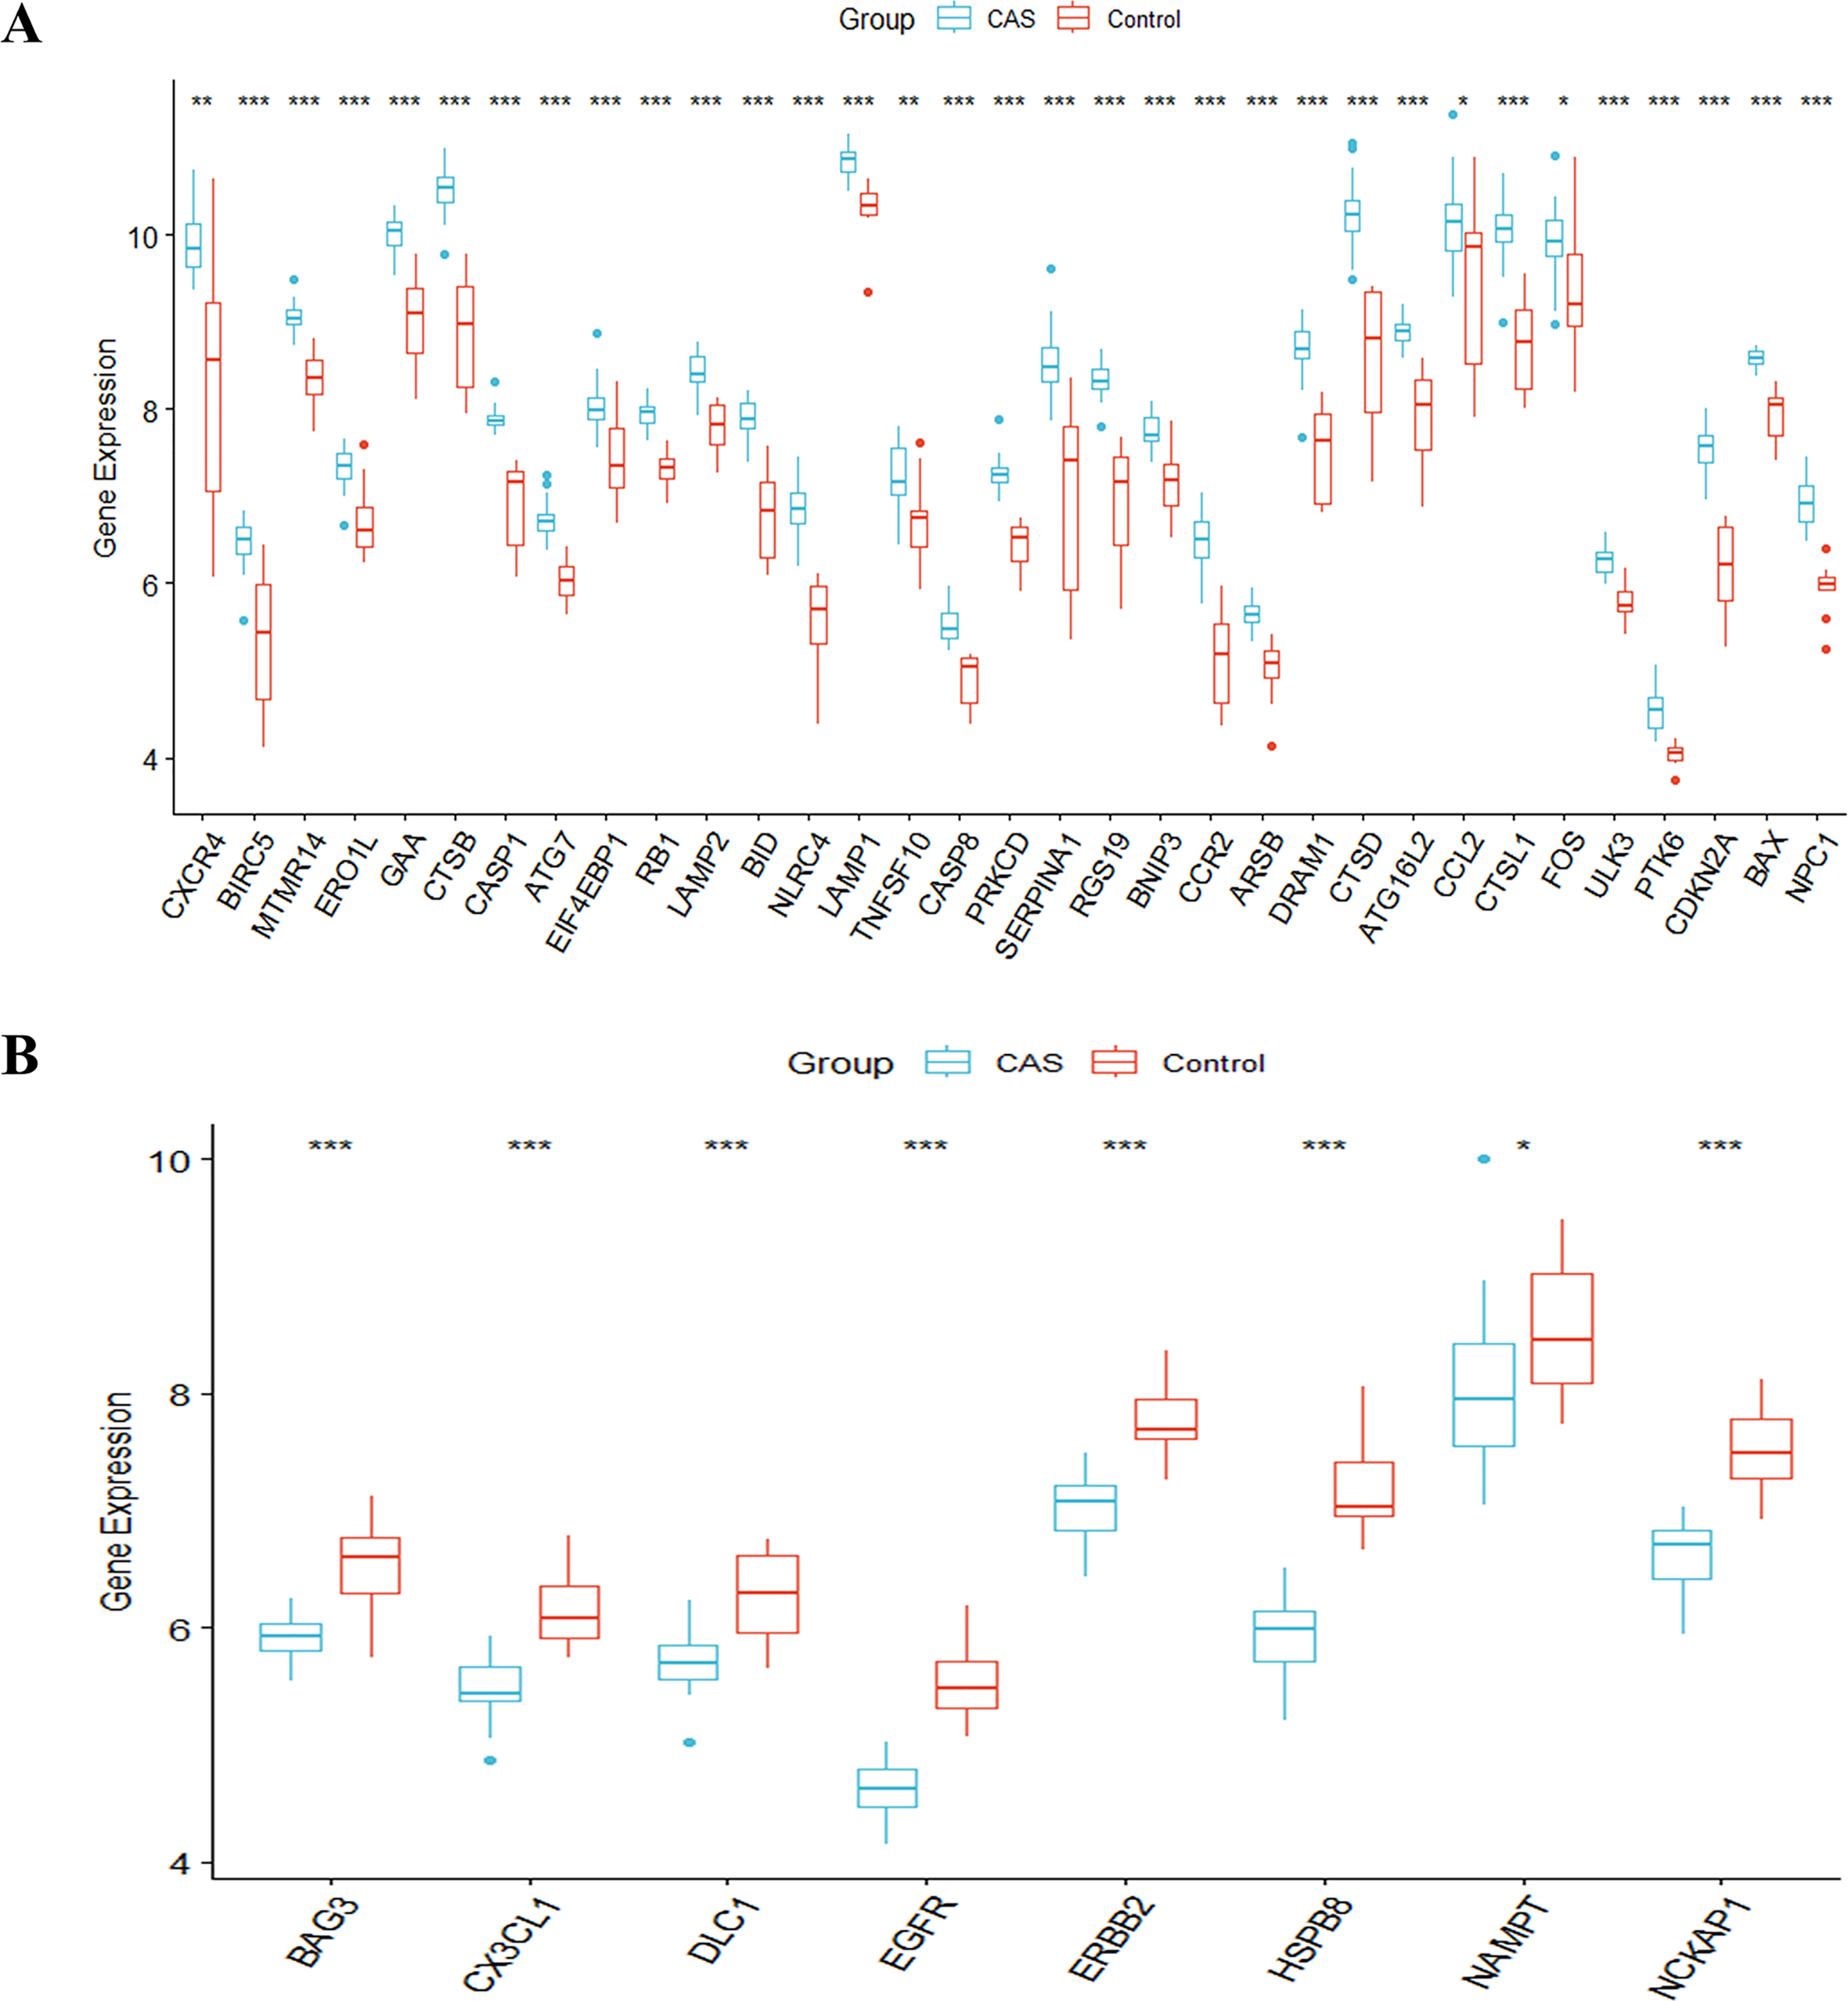
Functional enrichment analysis of DE-ATGs
GO enrichment analyses showed that the top biological process associated with the DE-ATGs were regulation of endopeptidase activity, macroautophagy, and regulation of autophagy; the top cellular component were membrane raft, membrane microdomain, and vacuolar membrane; the top molecular functions were cytokine receptor binding and virus receptor activity (Fig. 4A; Table S2). KEGG pathway enrichment analyses showed that the top KEGG pathways associated with the DE-ATGs were NOD-like receptor signaling pathway, apoptosis, autophagy, and immune activation (Fig. 4B; Table S3). In summary, the CAS-related DE-ATGs were associated with apoptosis, autophagy, and immune activation.
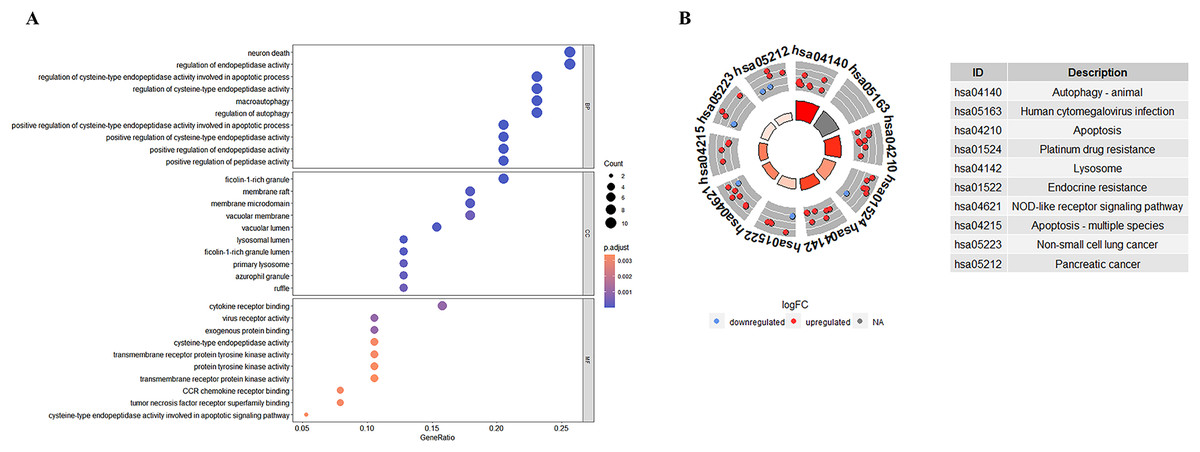
Figure 4: GO and KEGG enrichment analysis of 41 DE-ATGs.
(A) GO enrichment analysis. (B) KEGG enrichment analysis.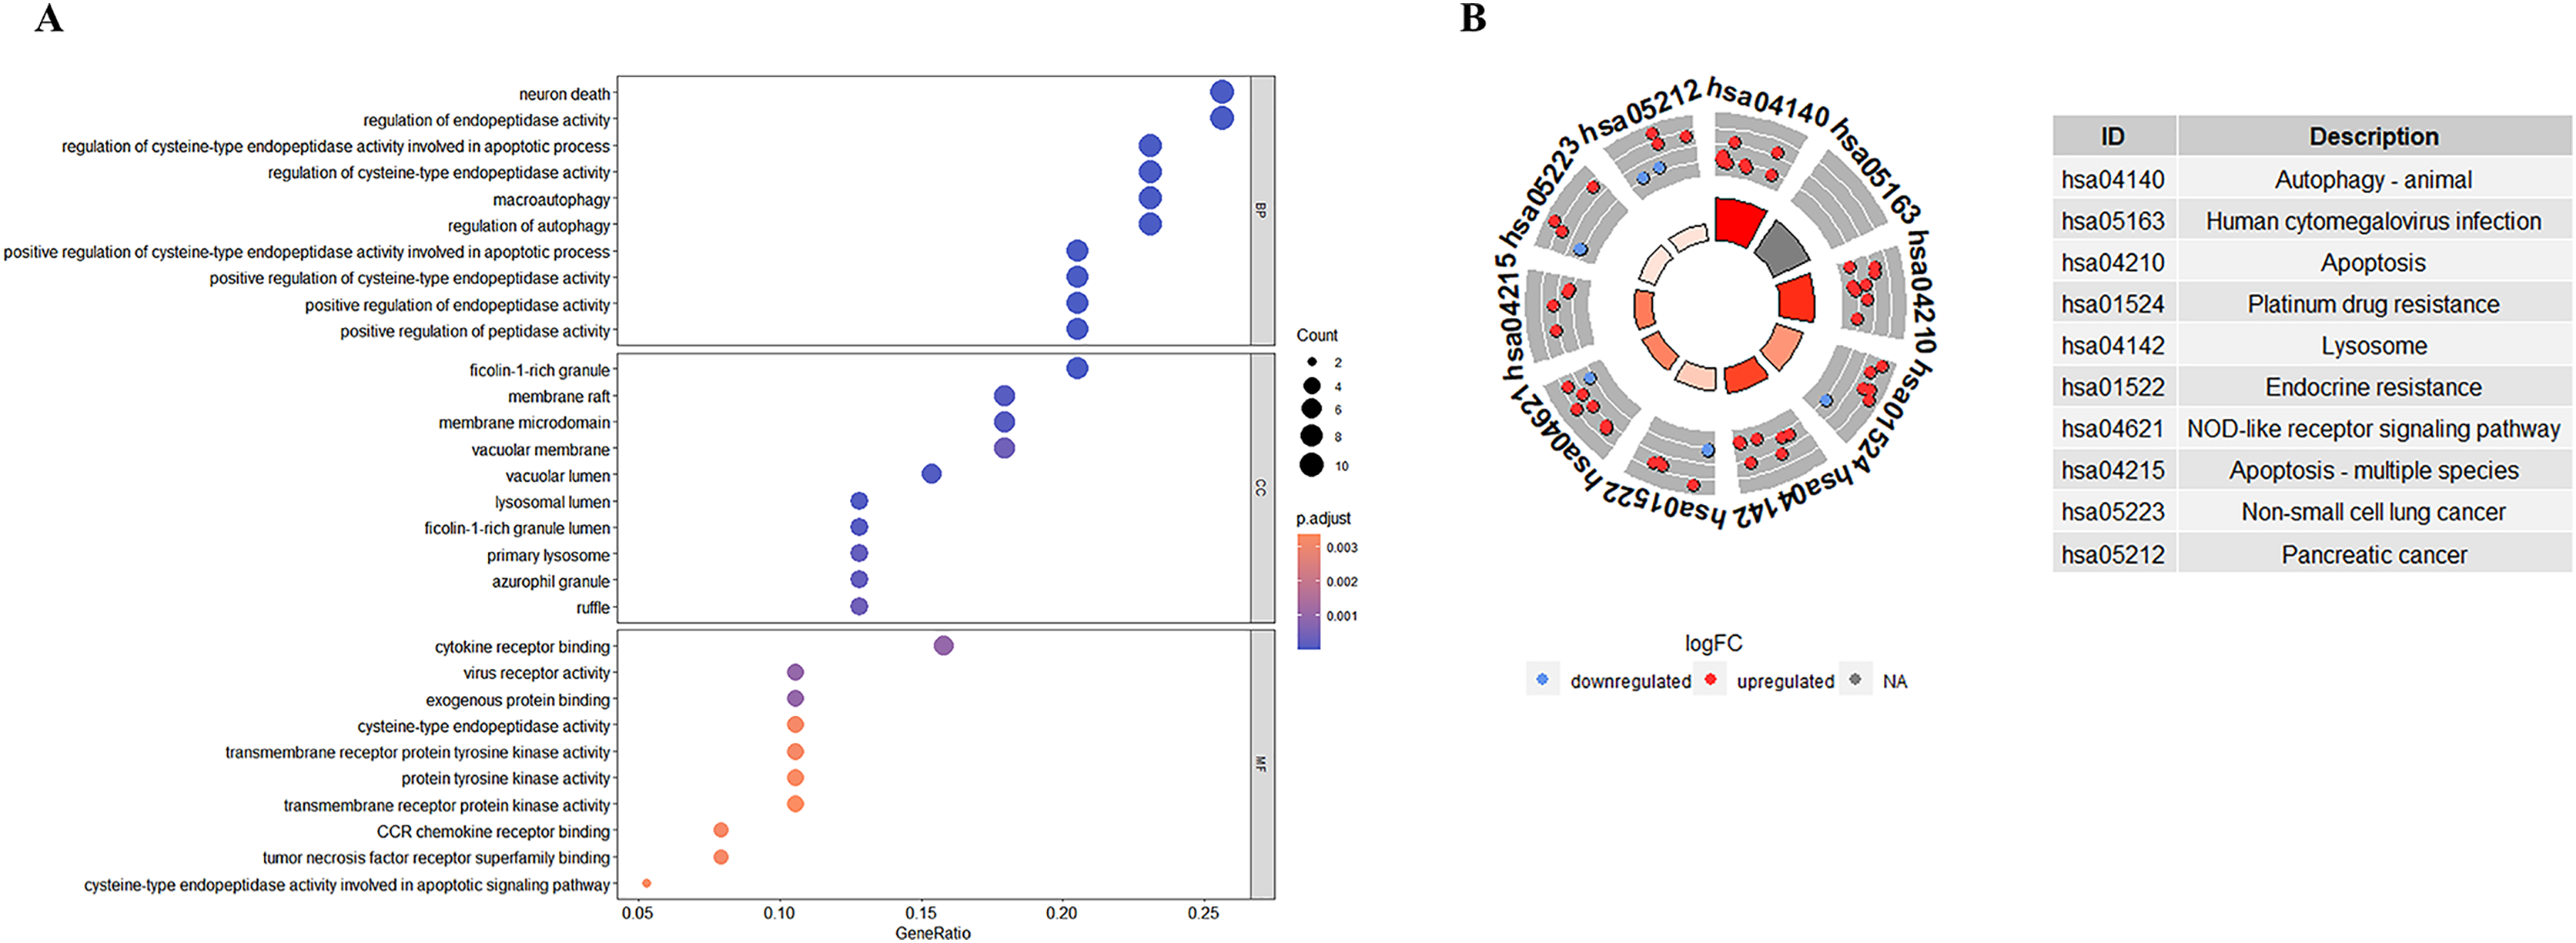
PPI network and screening of key CAS-related DE-ATGs with diagnostic significance
Figure 5A shows the PPI network between the CAS-related DE-ATGs. We identified the top 10 key CAS-related DE-ATGs using the MCC and BottleNeck algorithms of the “cytoHubba” plugin (Figs. 5B and 5C). Subsequently, we identified seven key CAS-related DE-ATGs after taking the intersection (Fig. 5D). We then performed validation analyses using the GSE28829 dataset and identified that the expression levels of LAMP1, CASP8, FOS, and EGFR did not show statistically significant differences (Fig. 5E). Finally, we identified CCL2, LAMP2, and CTSB as three key CAS-related DE-ATGs that were potentially involved in the pathogenesis of CAS.
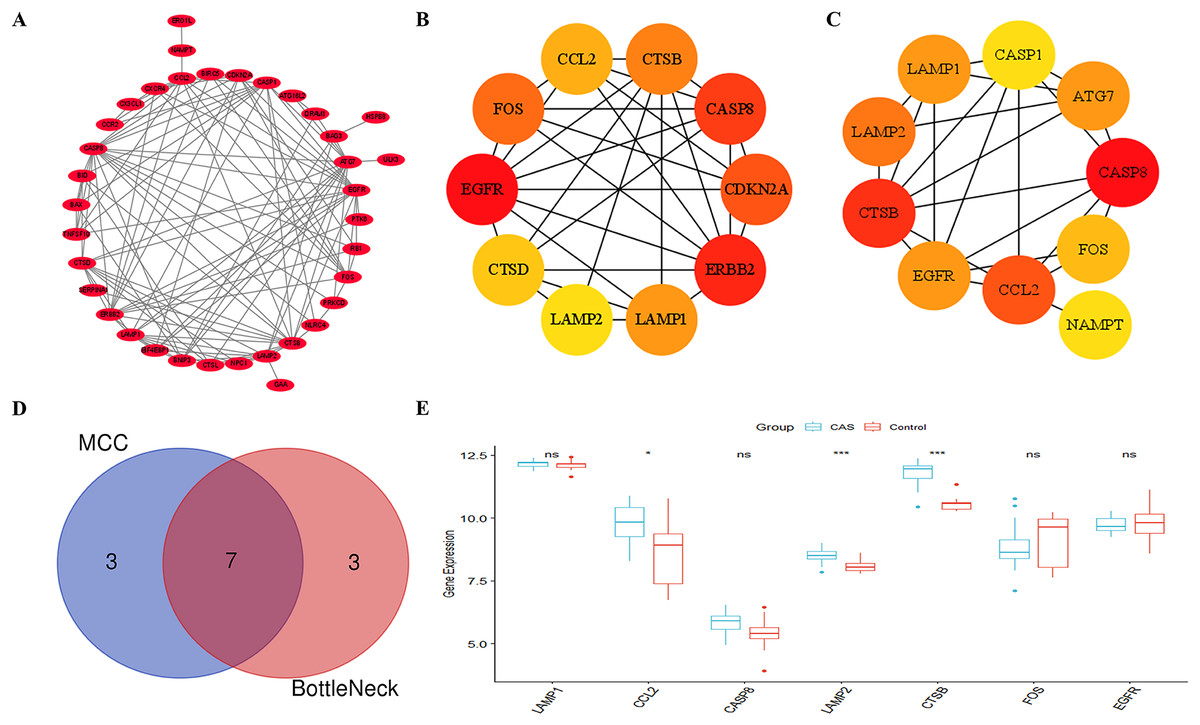
Figure 5: Identification of key CAS-related DE-ATGs.
(A) The PPI network. (B) The MCC algorithm identified 10 key CAS-related DE-ATGs. (C) The BottleNeck algorithm identified 10 key CAS-related DE-ATGs. (D) Seven key CAS-related DE-ATGs were obtained by combining the MCC algorithm and BottleNeck algorithm. (E) Seven key CAS-related DE-ATGs were verified in the GSE28829 dataset. ns > 0.05; *P < 0.05; ***P < 0.001.
Diagnostic value of key CAS-related DE-ATGs
ROC curve analysis confirmed that CCL2, LAMP2, and CTSB showed good diagnostic performances in discriminating between CAS and control samples with AUC values of 0.707, 0.977, and 0.951, respectively (Figs. 6A–6C). The diagnostic values of the three key CAS-related DE-ATGs were validated in the GSE28829 dataset and showed AUC values of 0.760, 0.827, and 0.947 for CCL2, LAMP2, and CTSB respectively (Fig. 6D). This demonstrated high diagnostic performance of CCL2, LAMP2, and CTSB for discriminating late CAS from early CAS. Based on the logistic regression model, AUC values for the GSE100927 and GSE28829 datasets were 0.994 and 0.981, respectively (Figs. 6E and 6F).
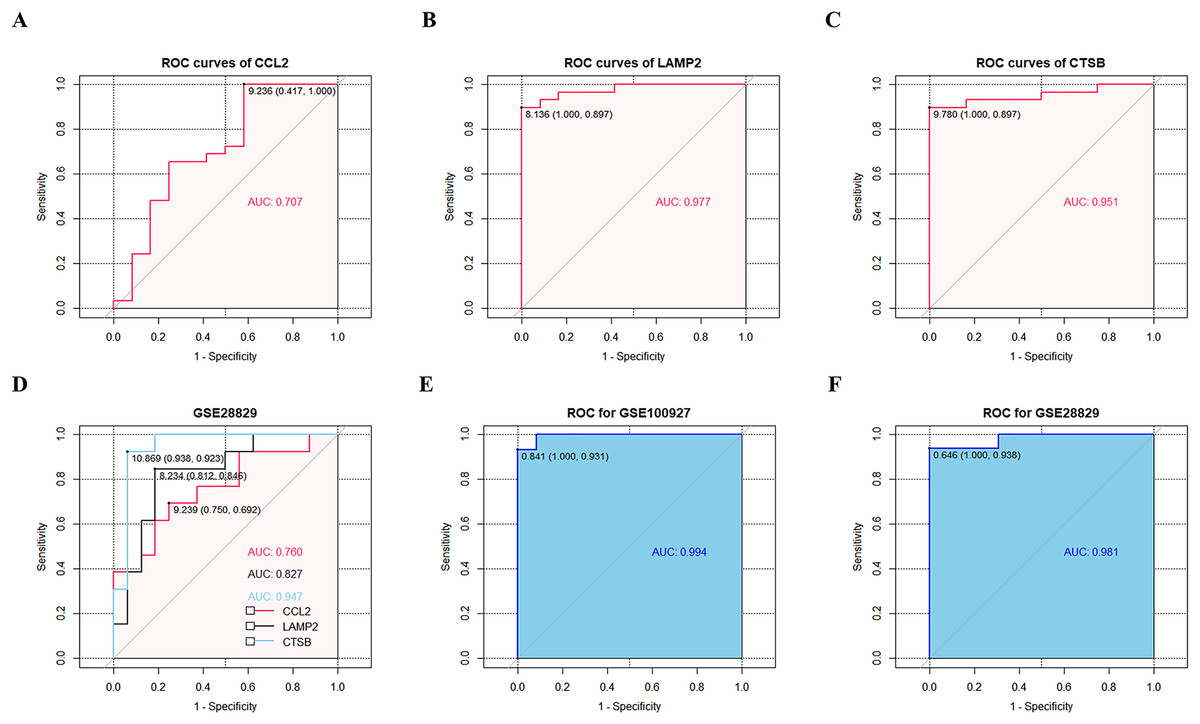
Figure 6: ROC curves of the three key CAS-related DE-ATGs in the diagnostic value and logistic regression model.
ROC curves of (A) CCL2, (B) LAMP2, and (C) CTSB. (D) The GSE28829 dataset was employed as an external validation sample. (E) Logistic regression model combining three key CAS-related DE-ATGs in GSE100927. (F) Logistic regression model combining three key CAS-related DE-ATGs in GSE28829.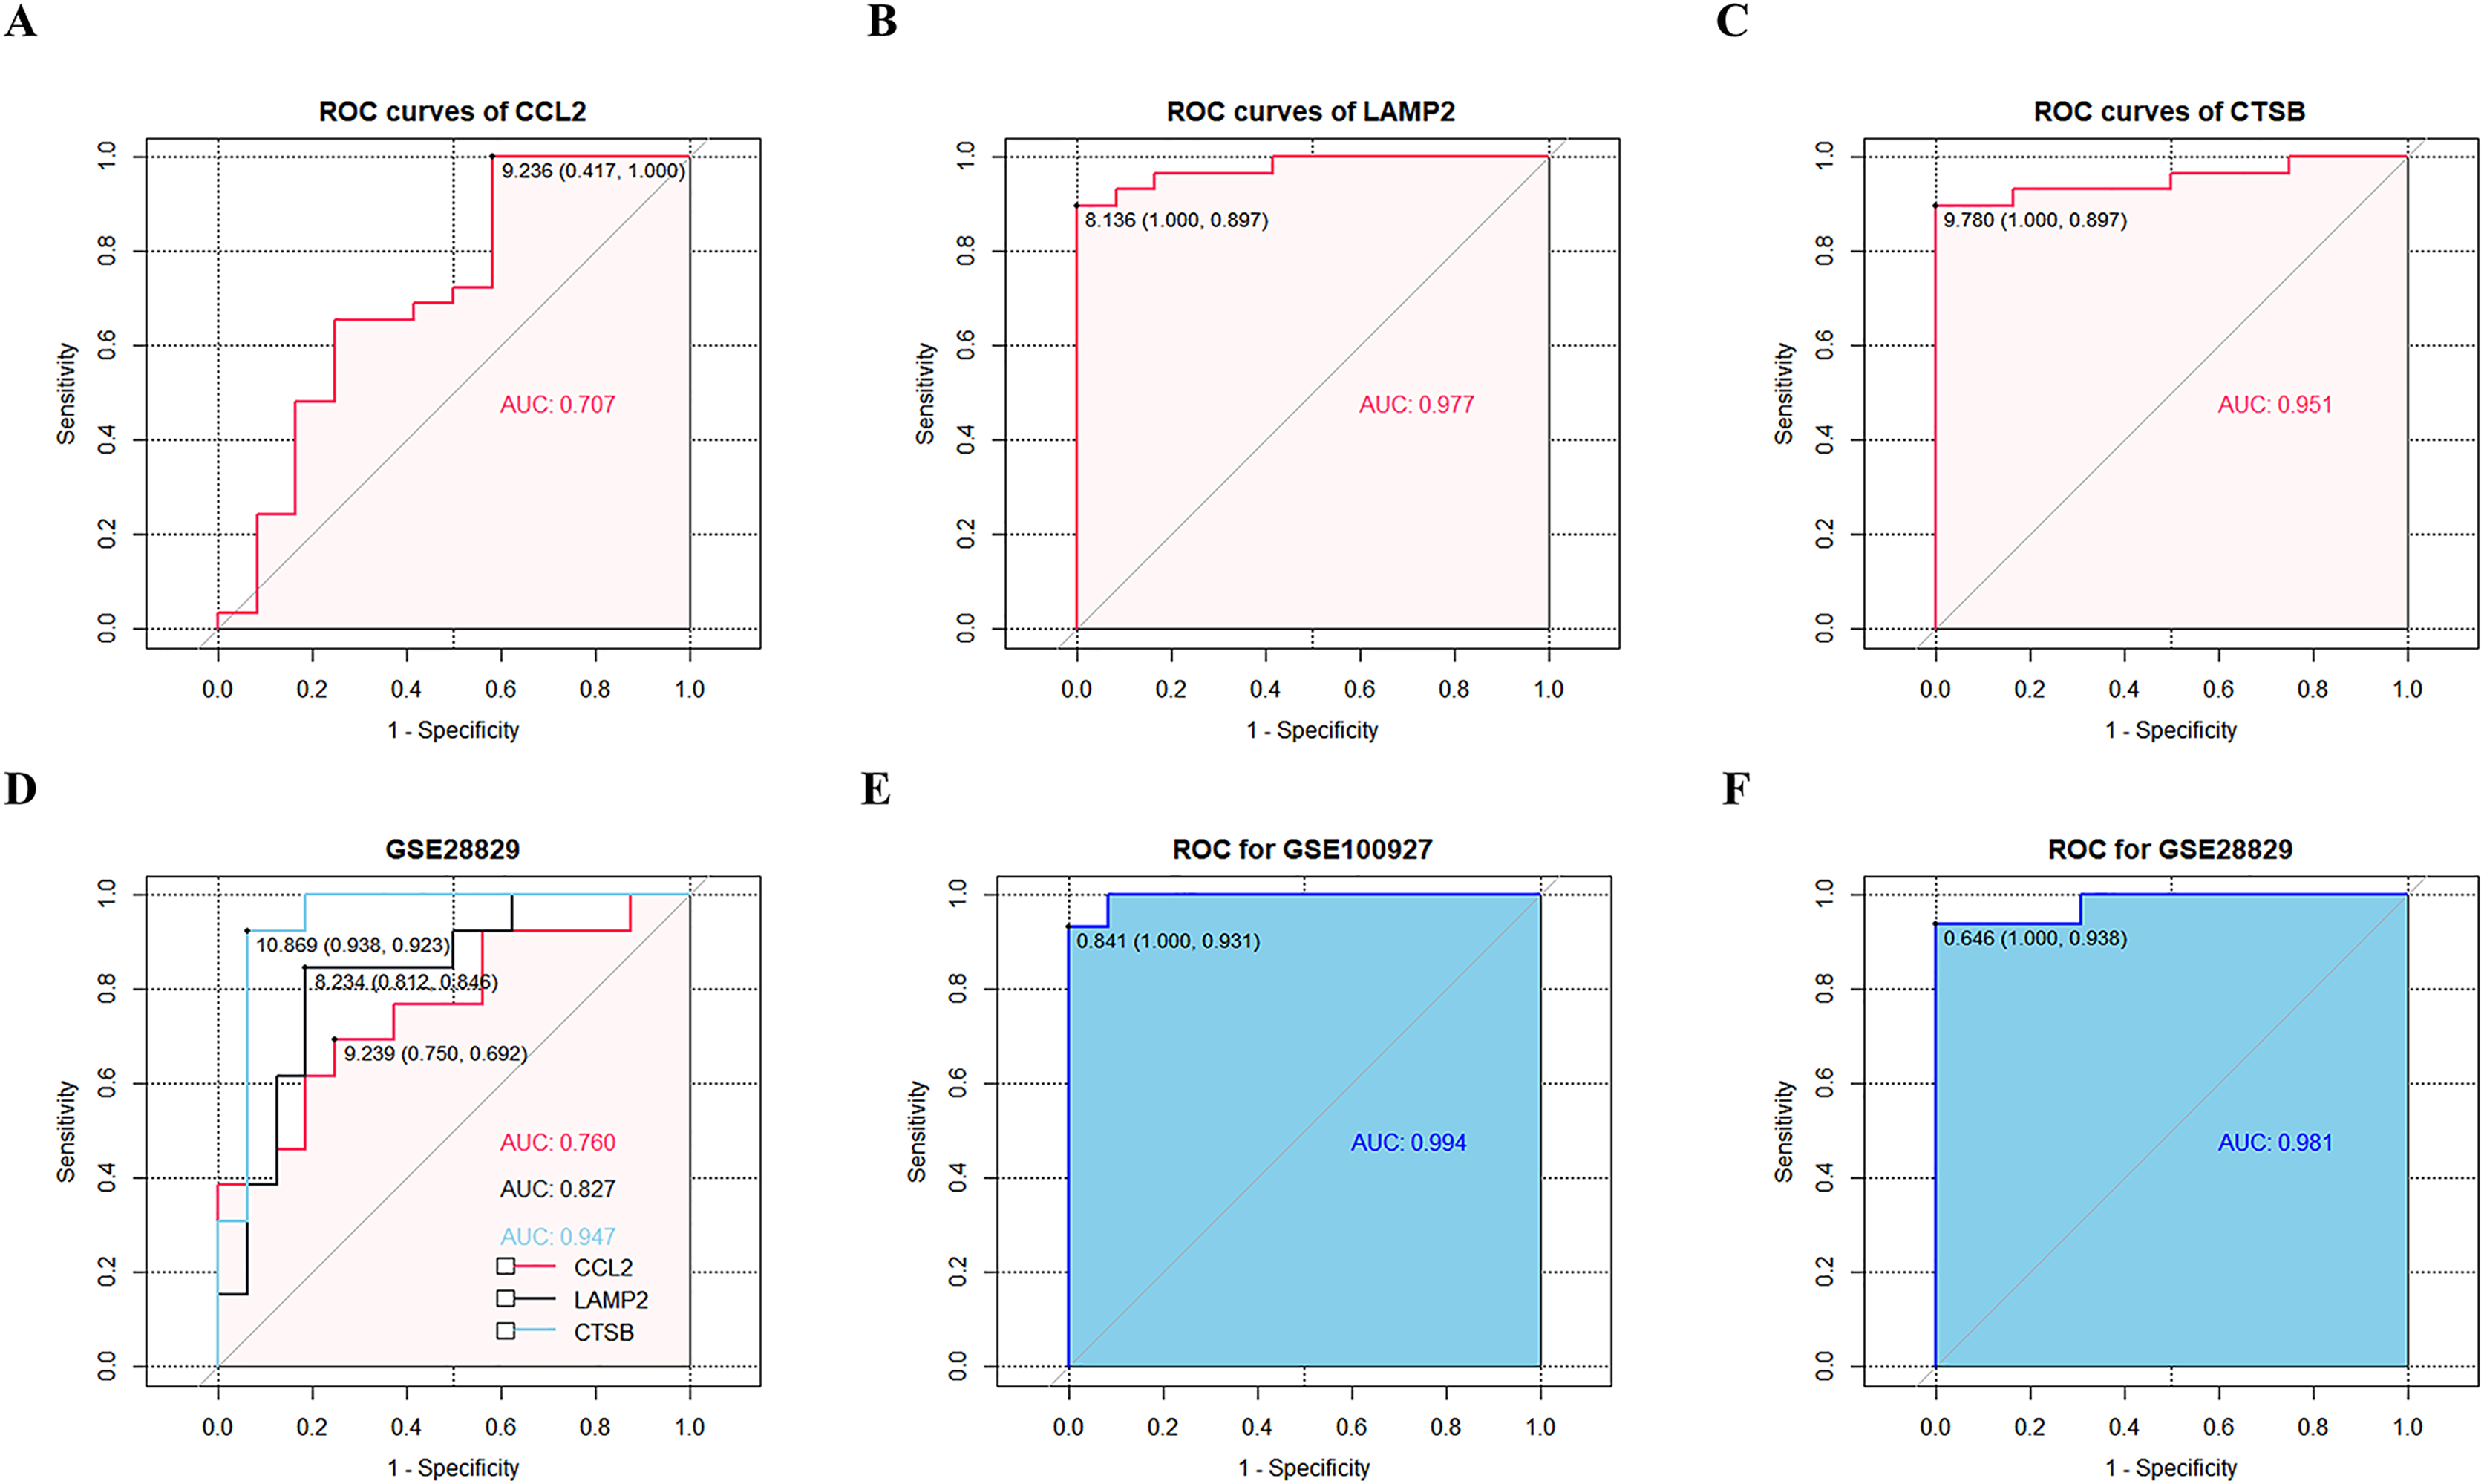
Immune infiltration
CIBERSORT analyses showed that the proportion of immune cells was significantly different between the early CAS plaques and the advanced CAS plaques (Fig. 7A). The proportion of memory B cells, gamma delta T cells, M0 macrophages, and activated mast cells was significantly higher in the advanced CAS plaques (Fig. 7B). Subsequently, we analyzed the correlation between the 22 types of immune cells in the plaques and observed that most of the immune cell types were significantly associated with each other. Naive B cells and resting NK cells showed the most synergistic effect, whereas gamma delta T cells and resting memory CD4 T cells showed the most competitive effect (Fig. 8A). Furthermore, the expression levels of CCL2, LAMP2, and CTSB showed close association with the infiltration levels of the immune cells (Fig. 8B). These data demonstrated that activation of autophagy was associated with increased inflammatory responses during the progression of CAS.
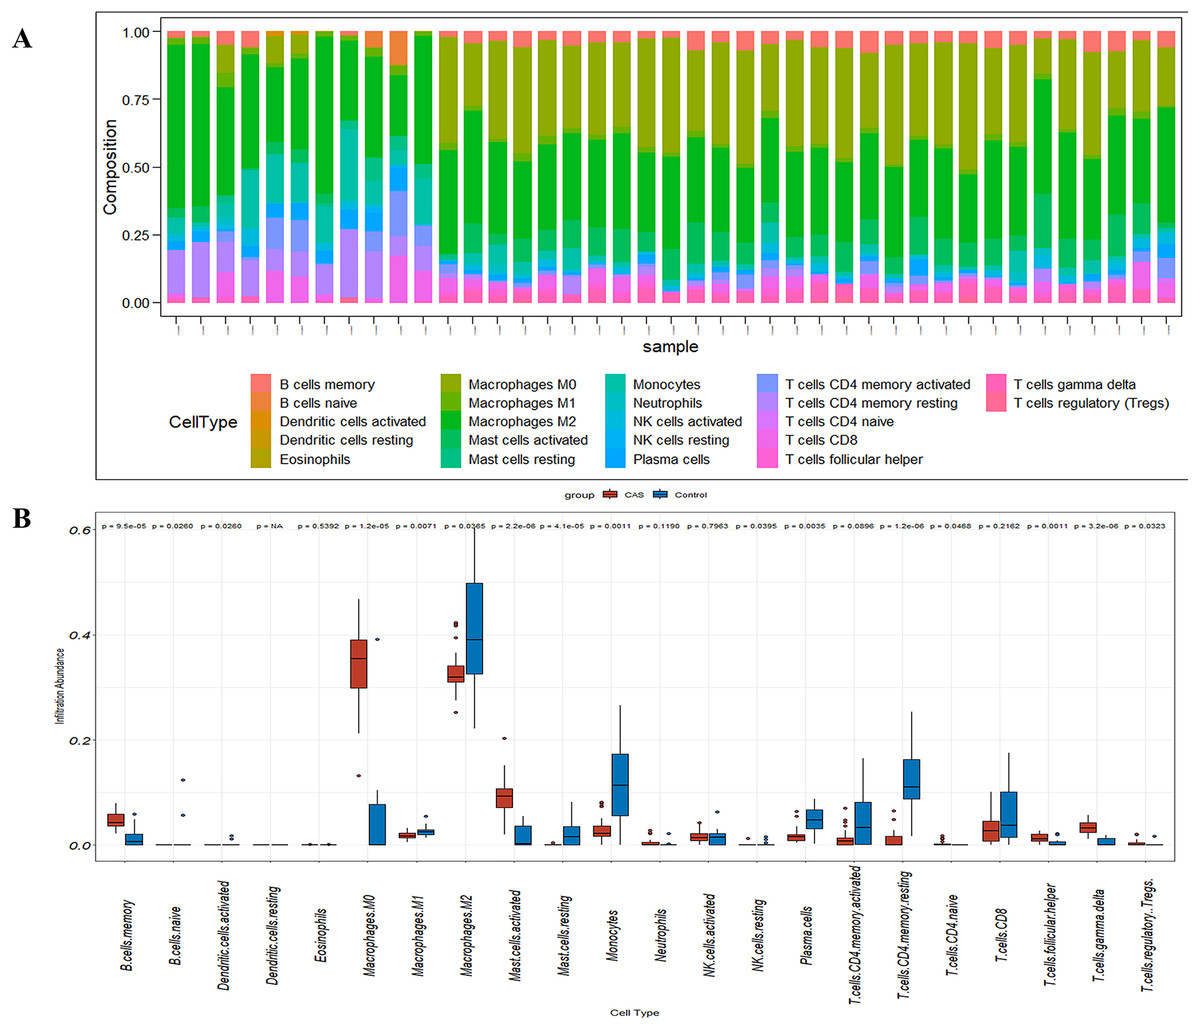
Figure 7: The fraction of 22 immune cells in CAS and control samples.
(A) A barplot of 22 immune cell fractions. X-axis: GSM; Y-axis: percentage of immune cells. (B) A boxplot of 22 immune cell proportions.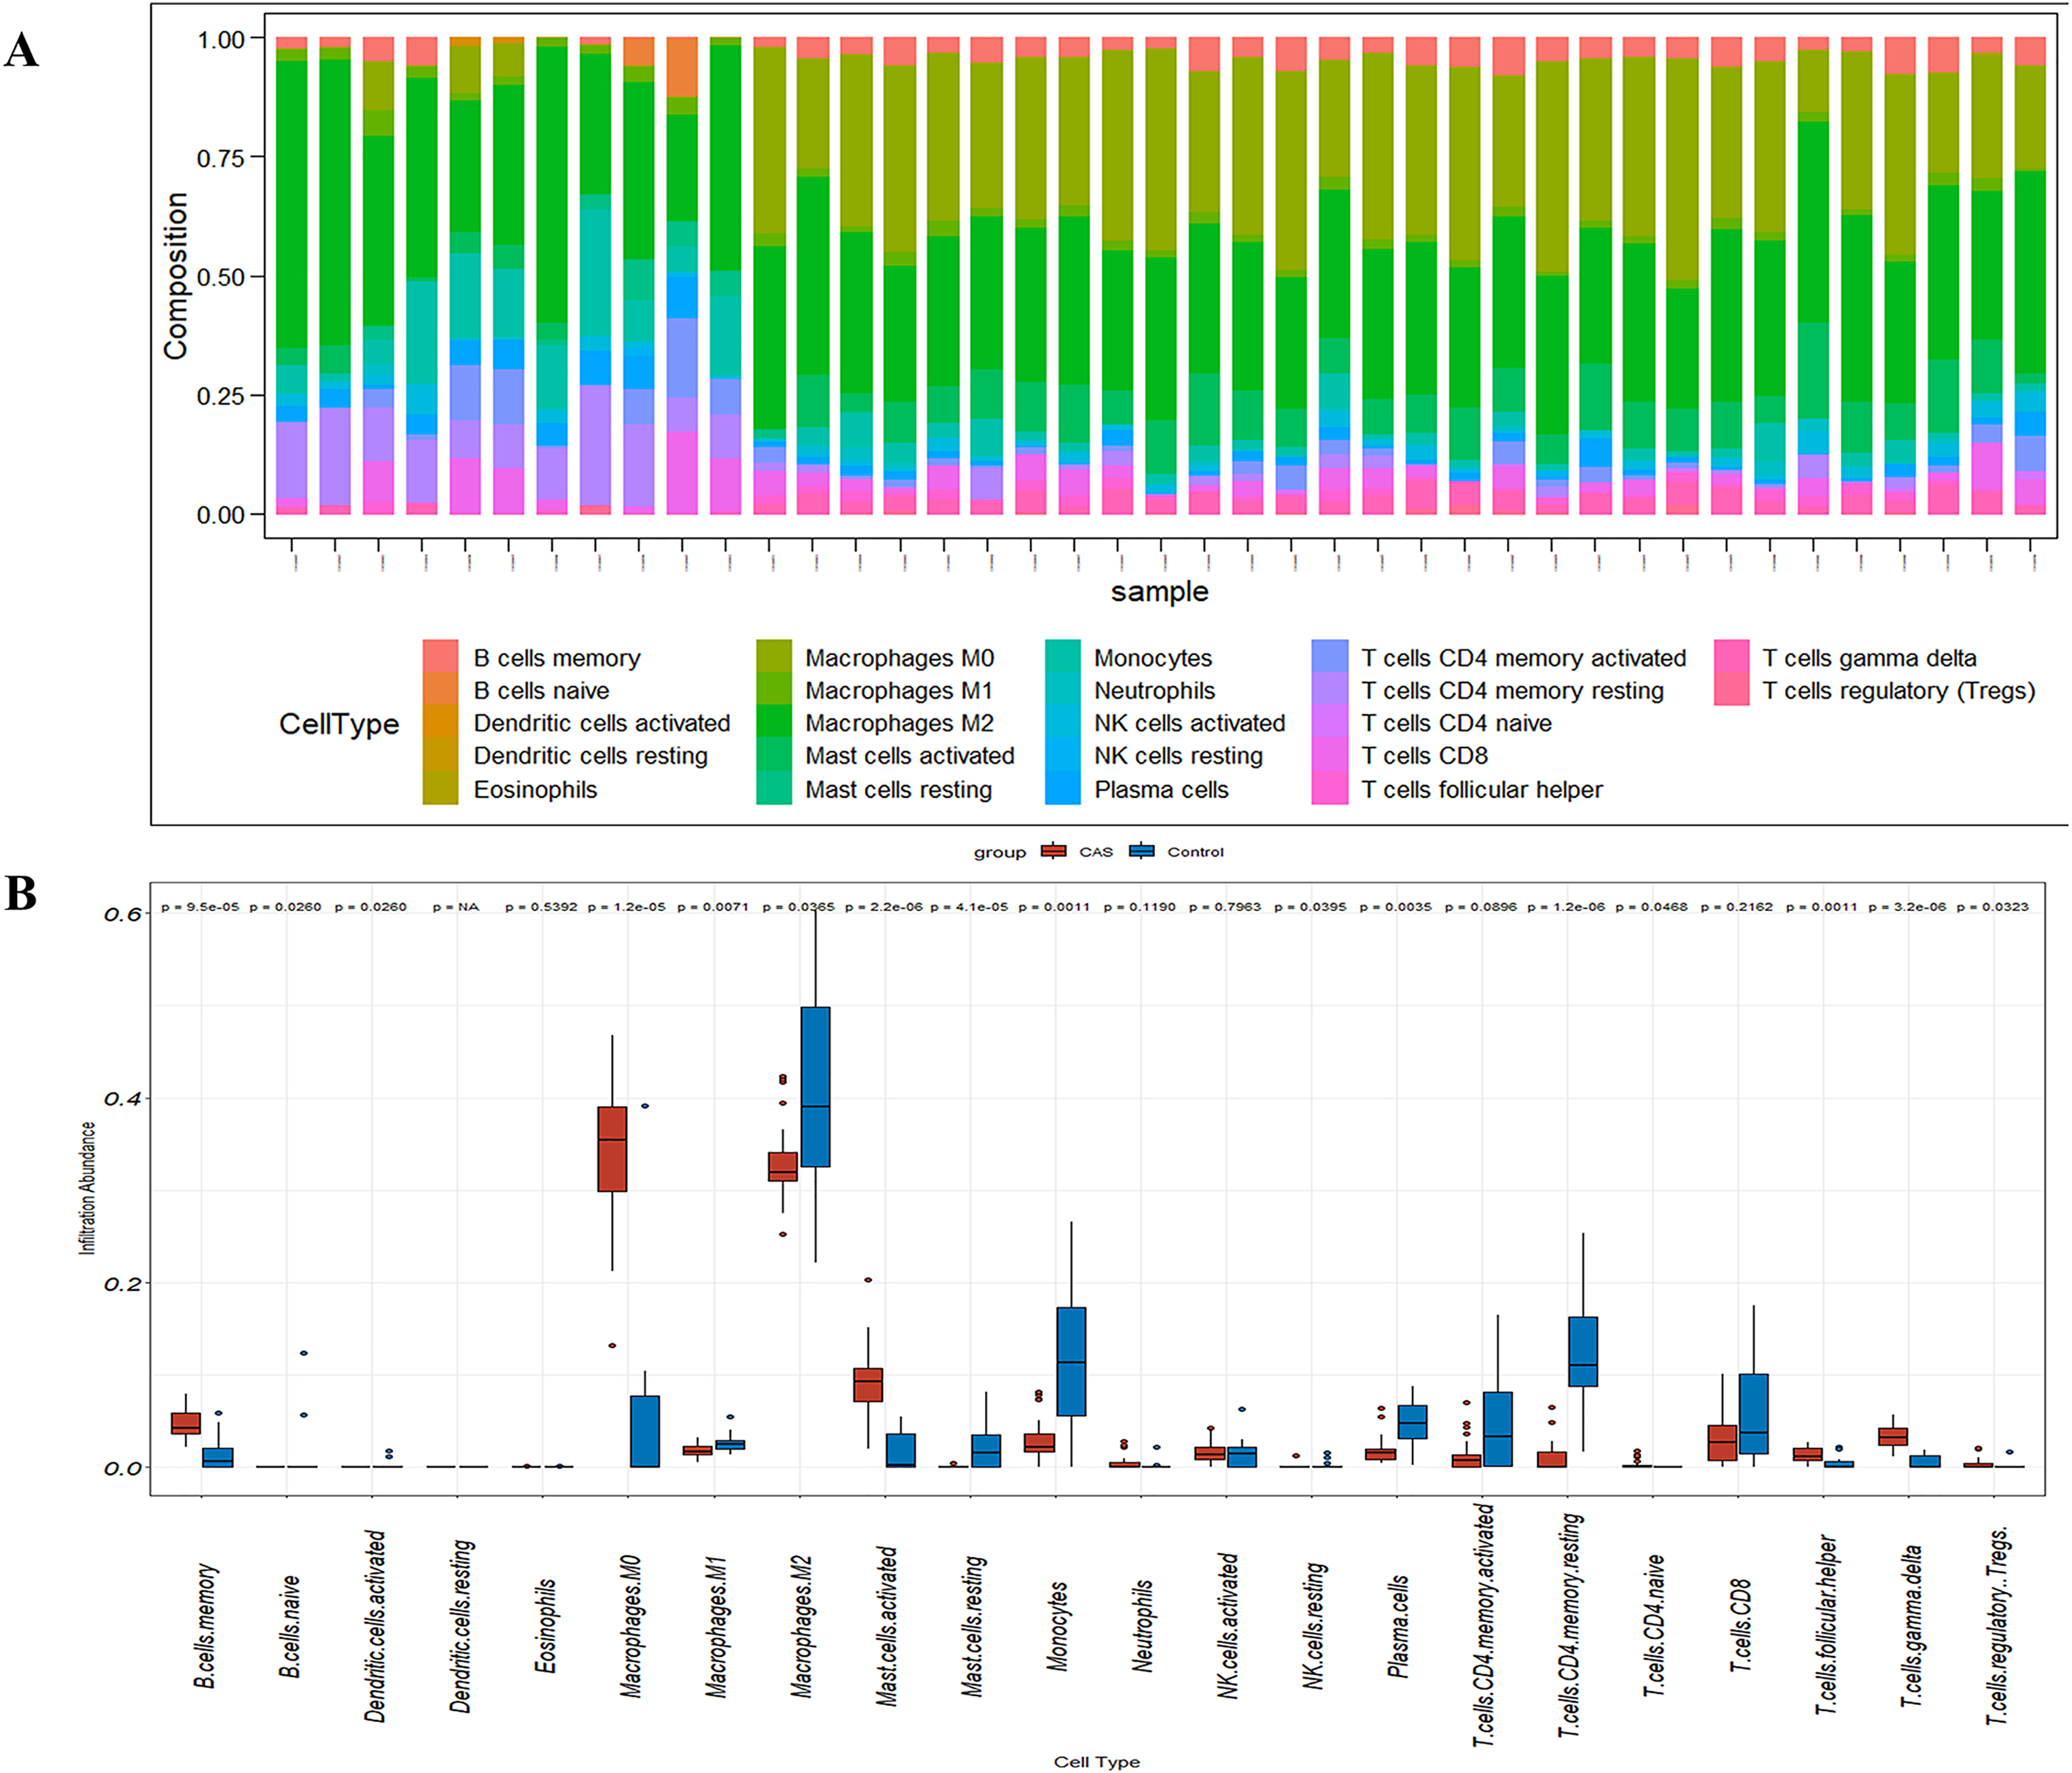
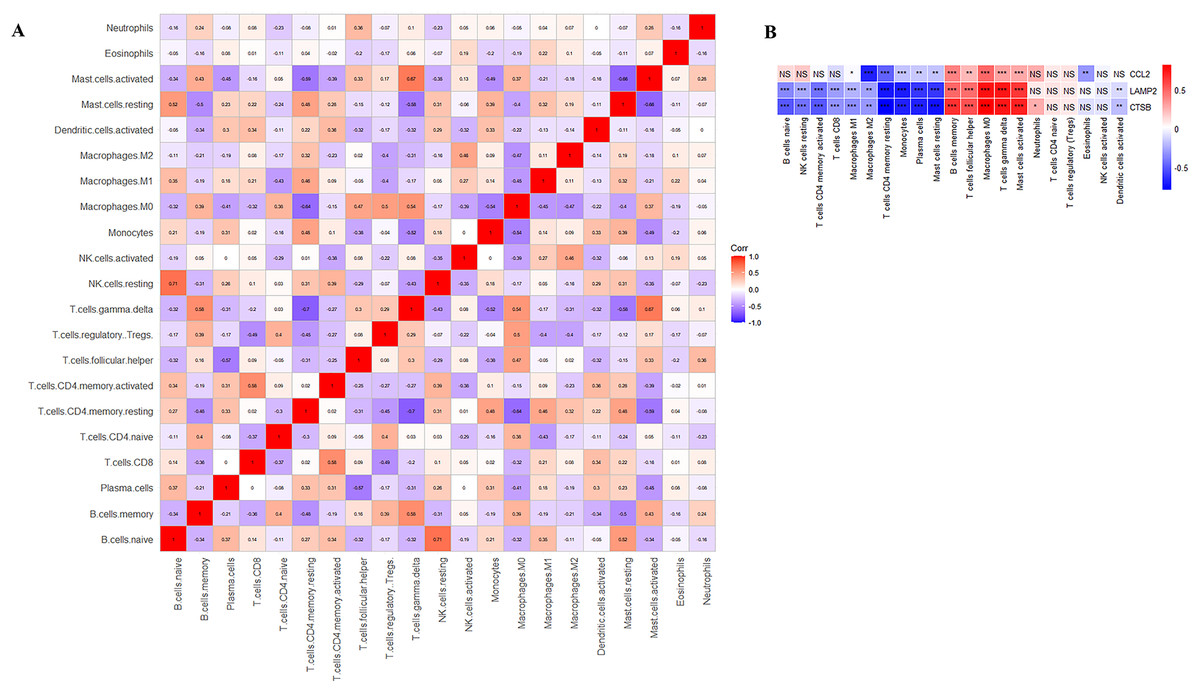
Figure 8: Correlation analysis.
(A) Correlation analysis of immune cell proportions; (B) correlation analysis of immune cells and three key CAS-related DE-ATGs. ns > 0.05; *P < 0.05; **P < 0.01; ***P < 0.001.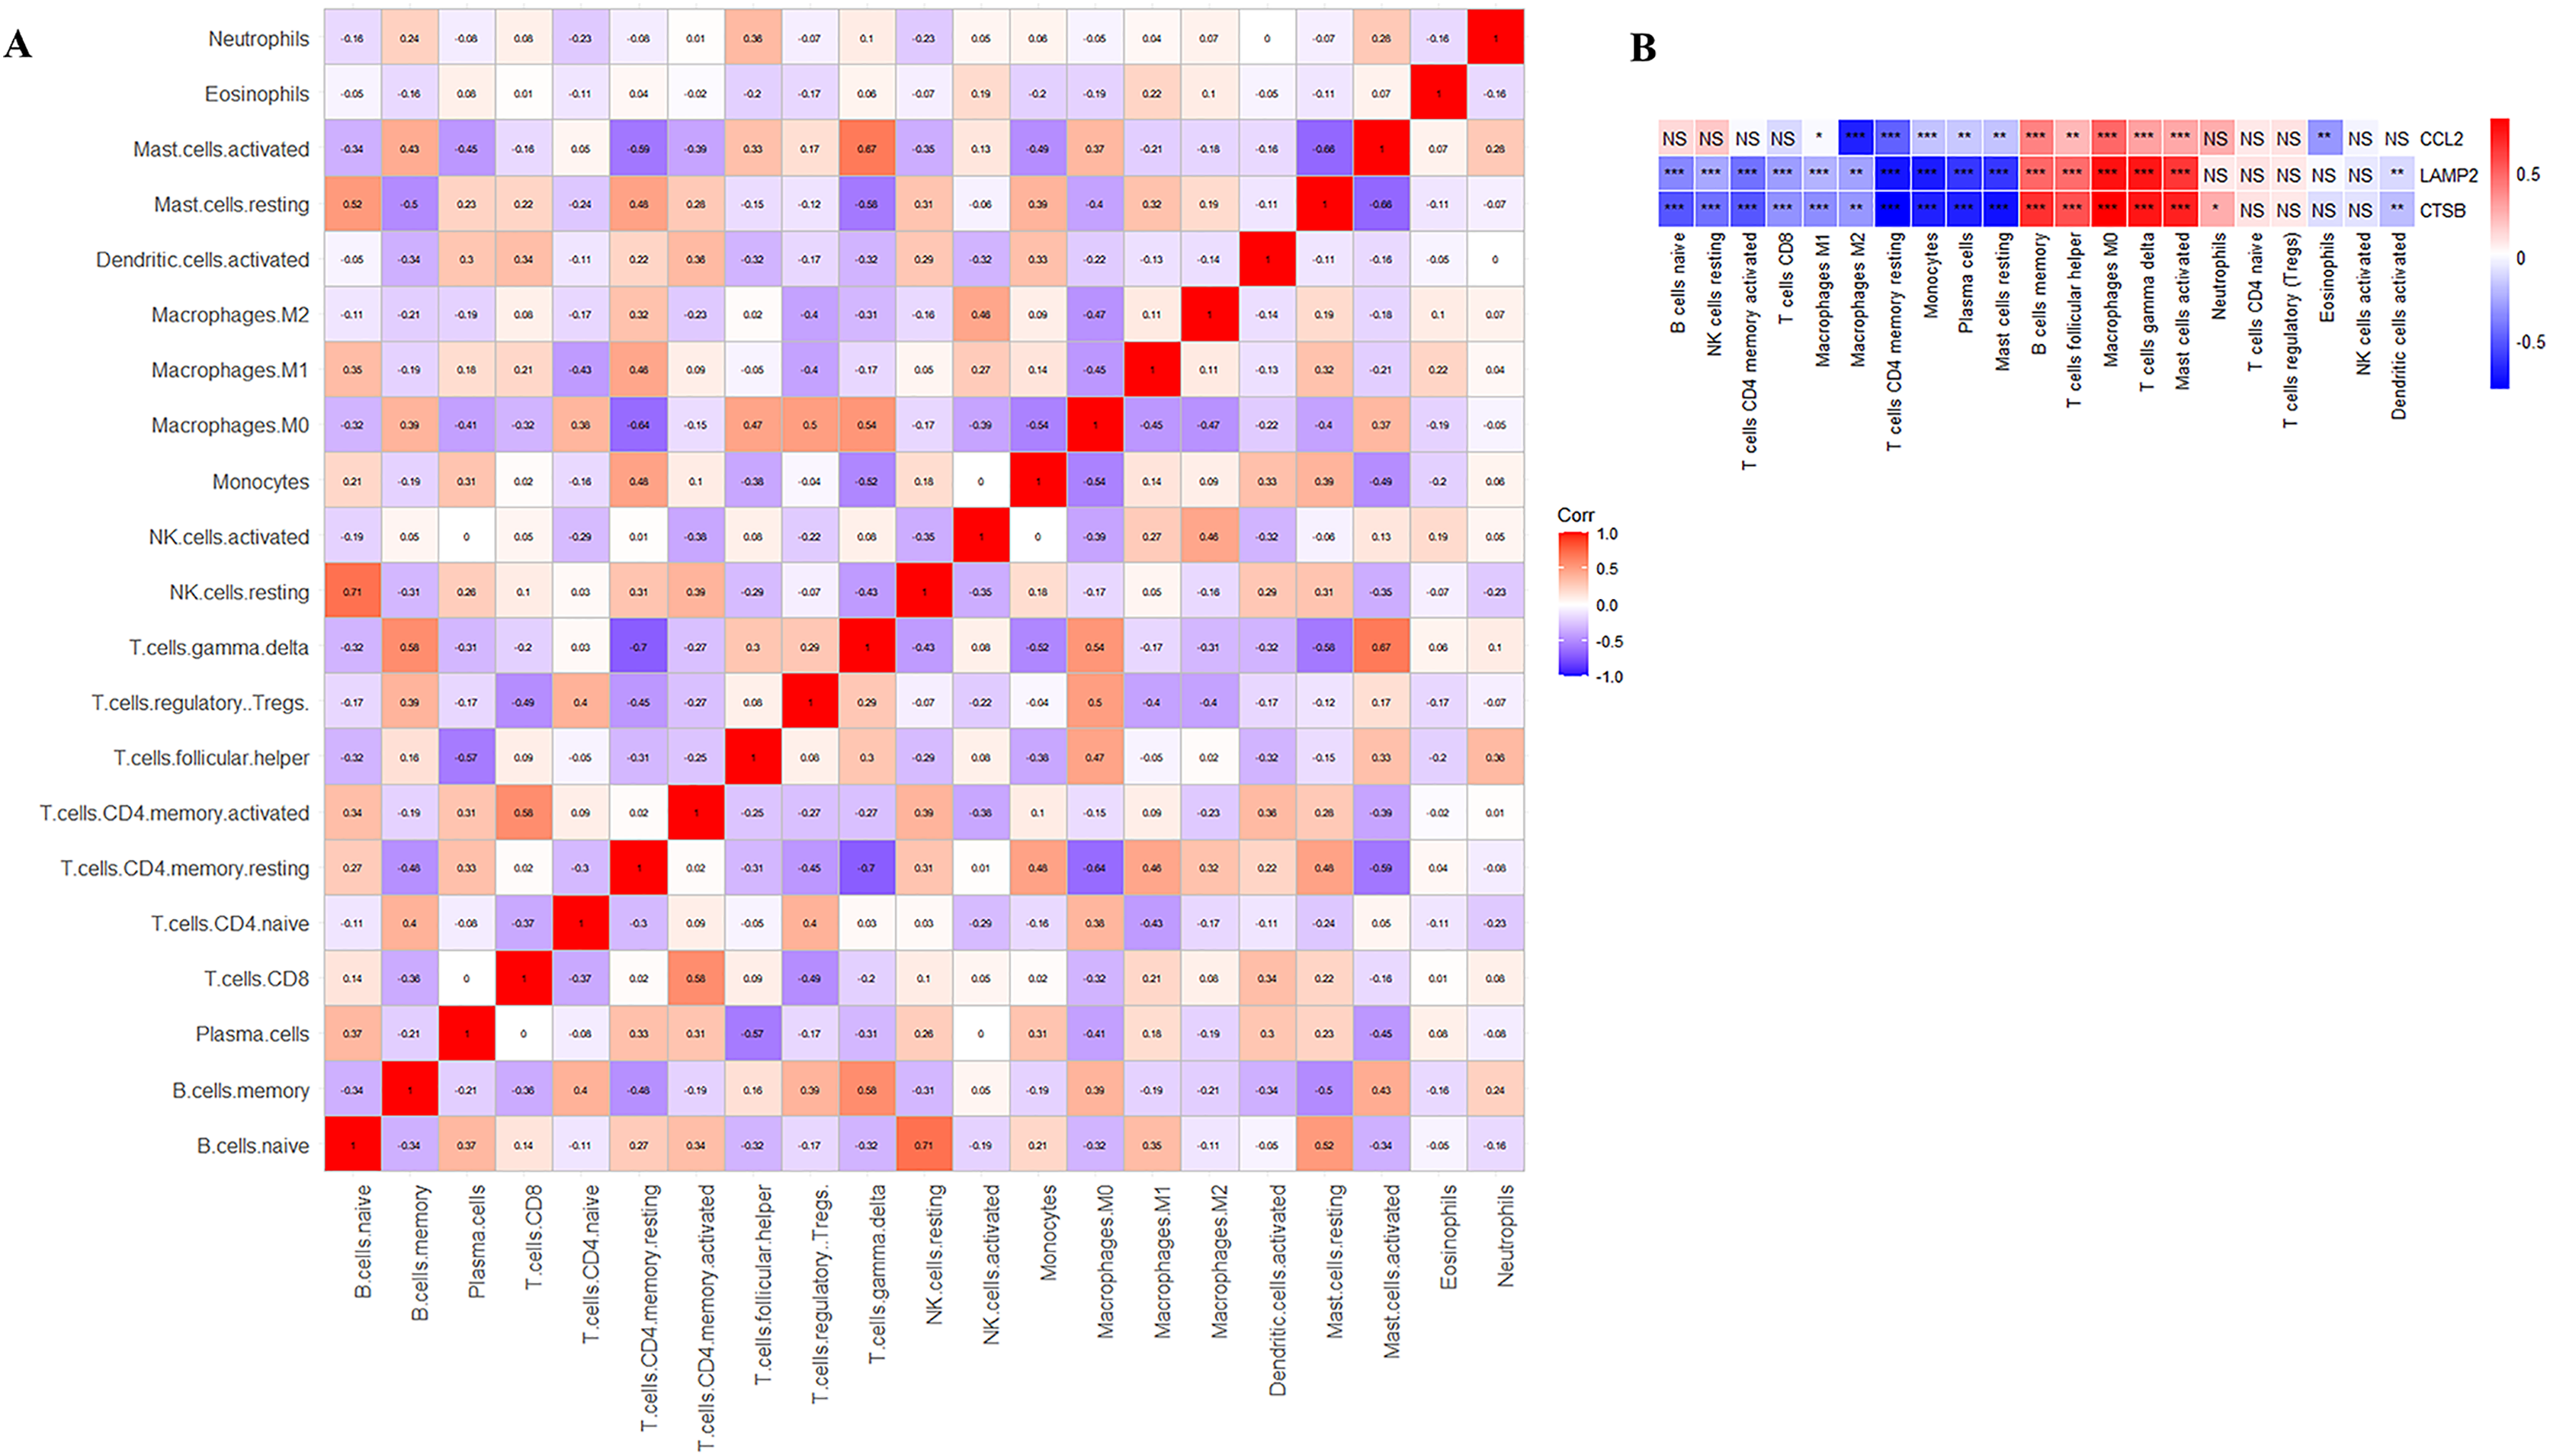
Validation of key CAS-related DE-ATGs using in vitro and in vivo models
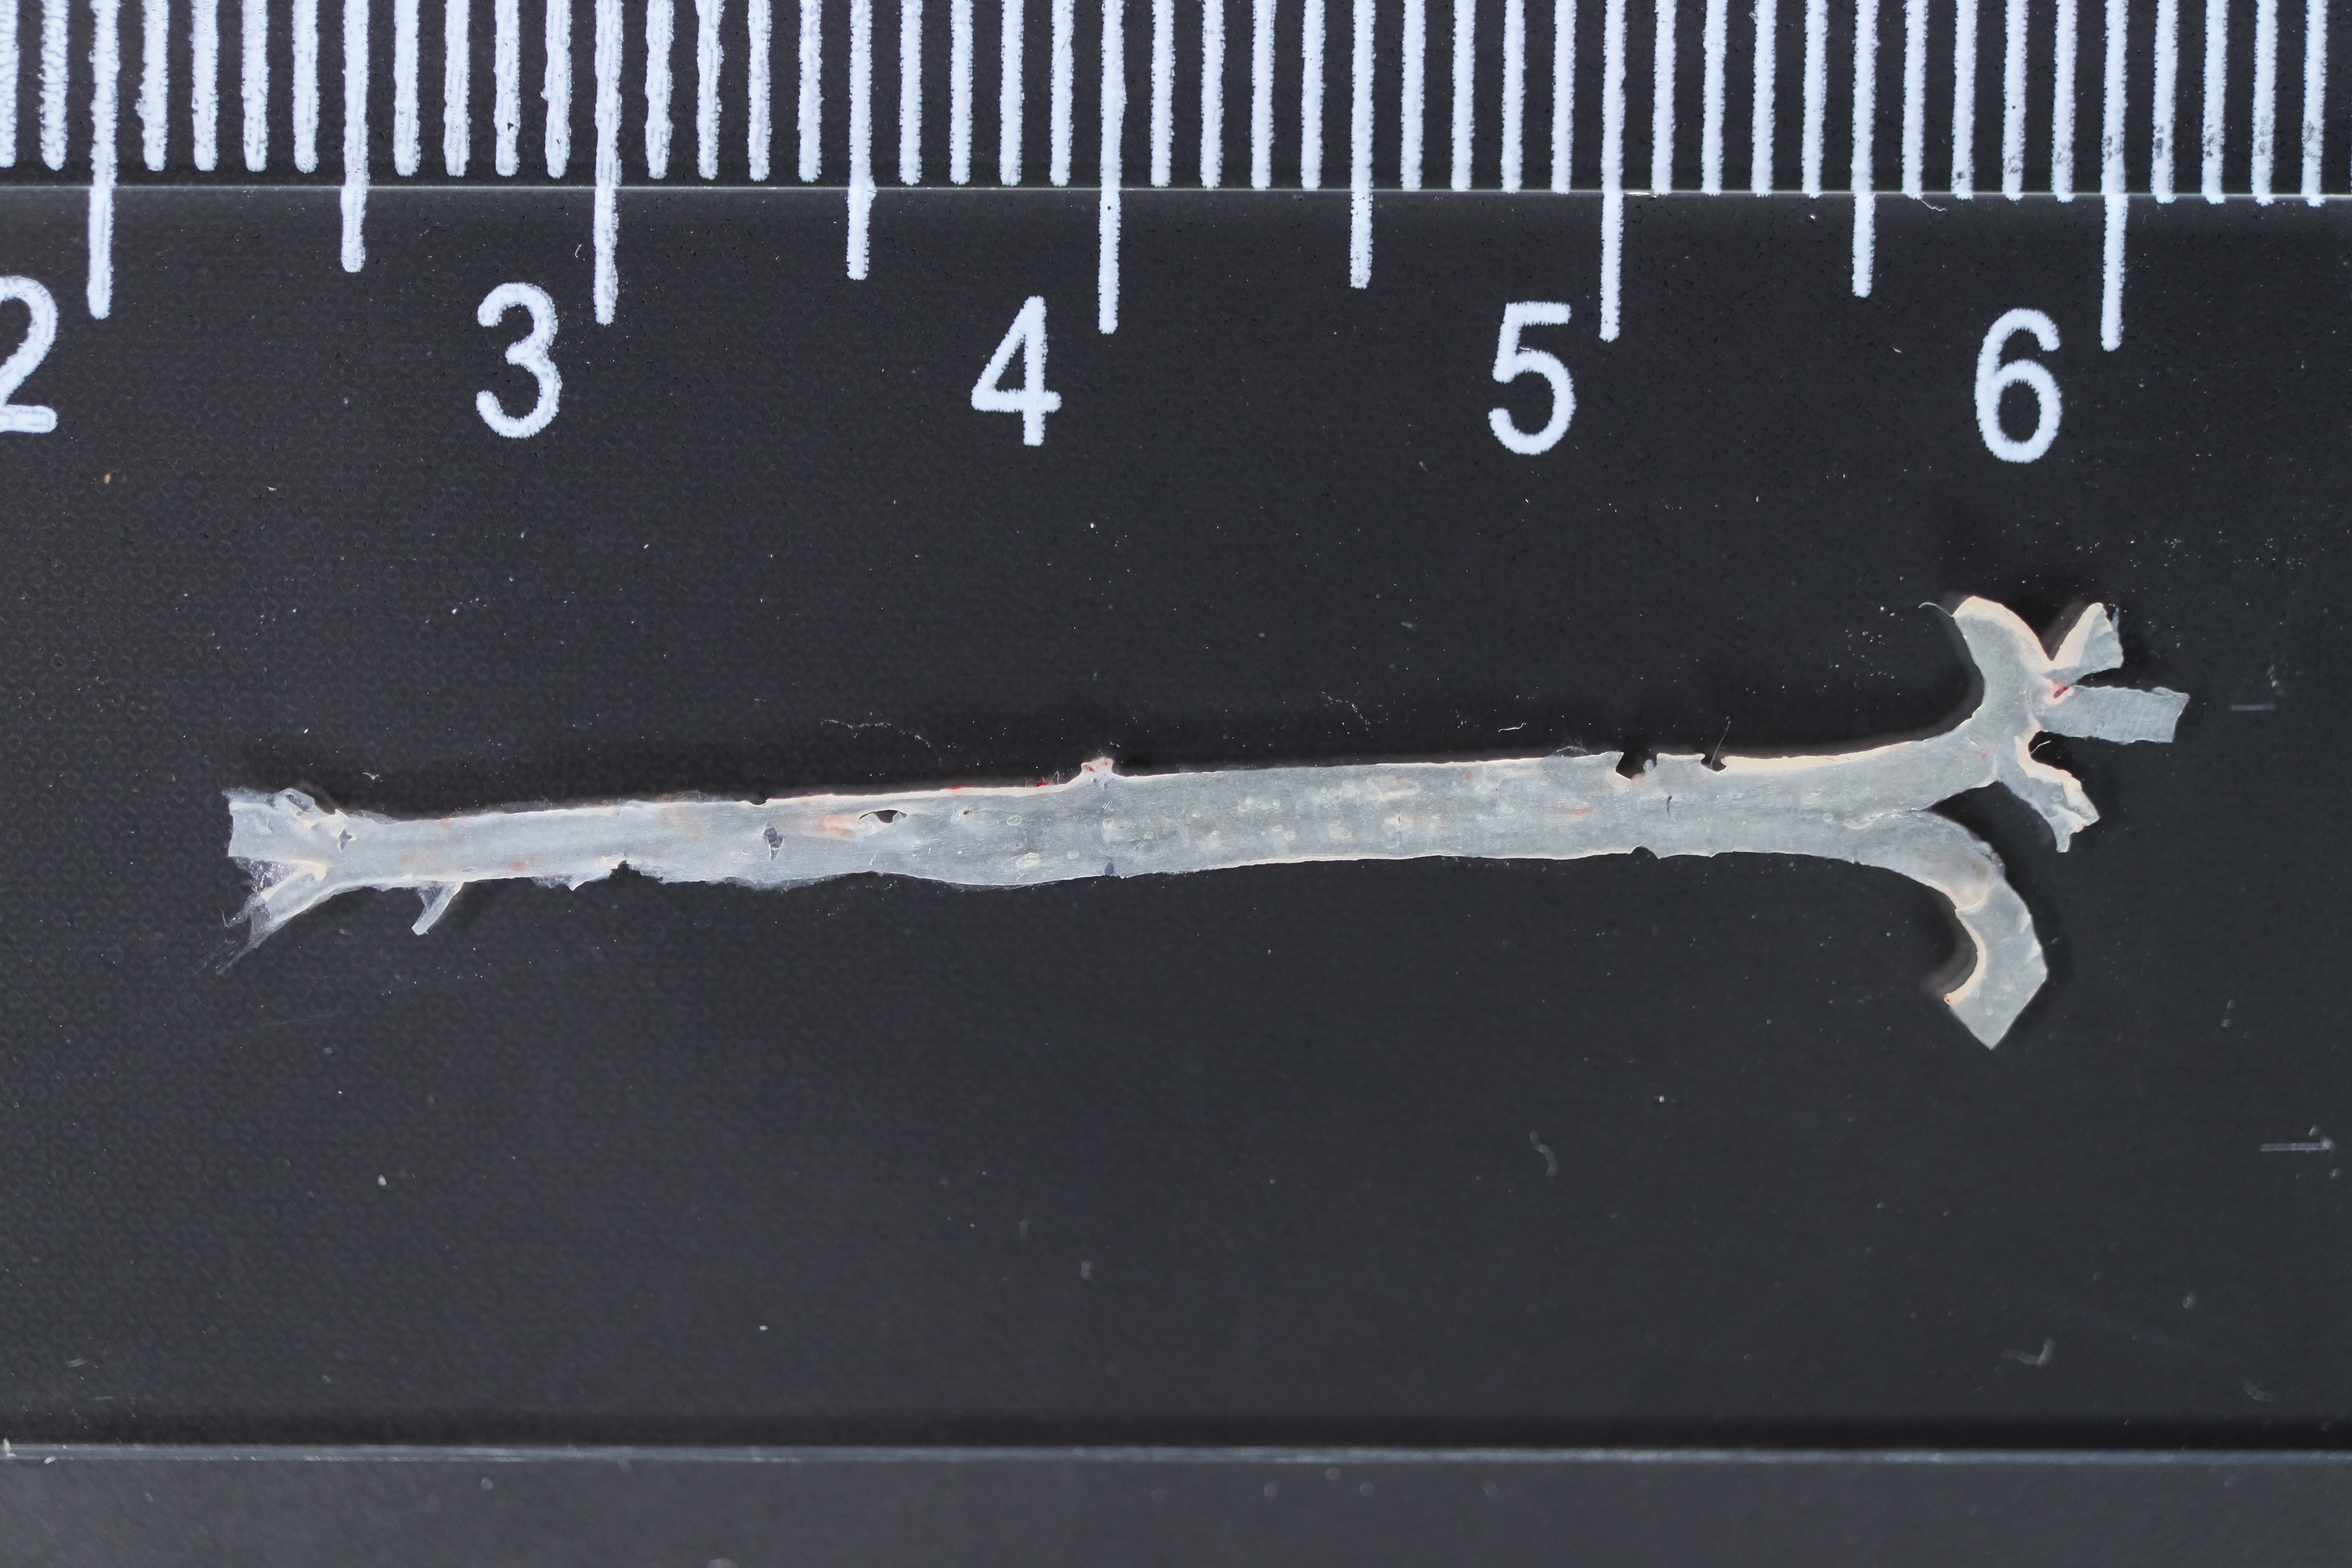
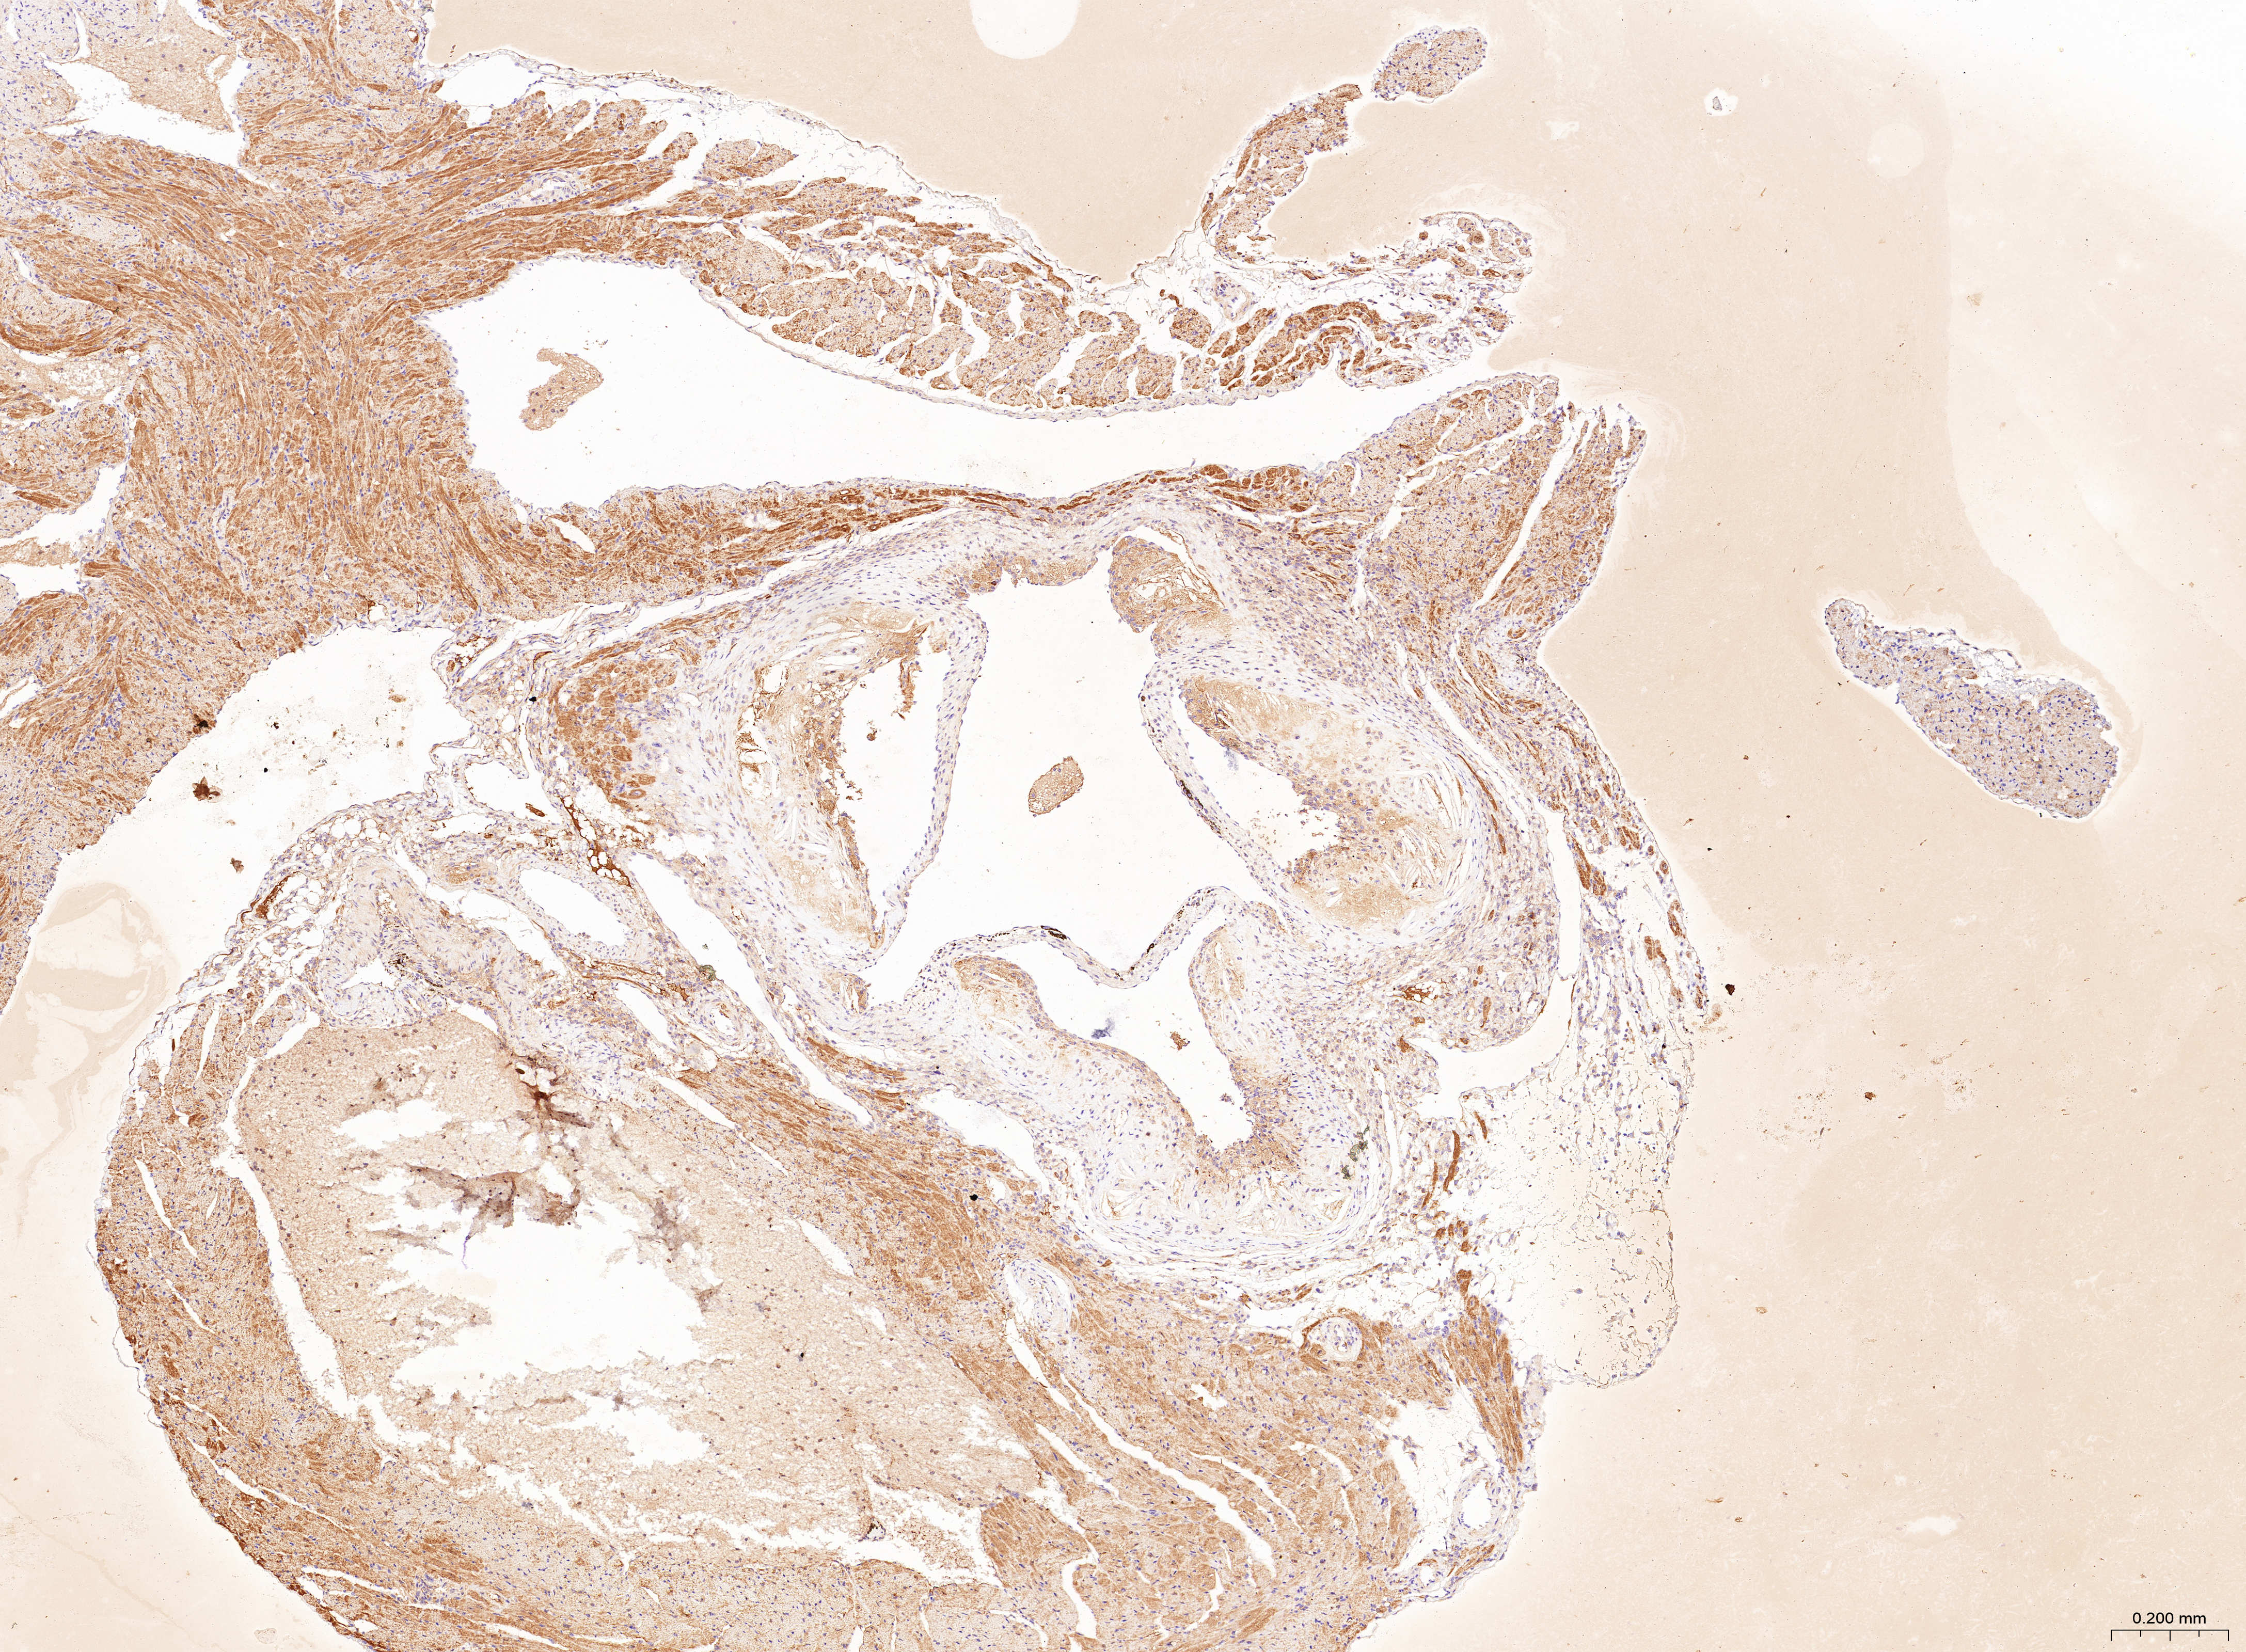
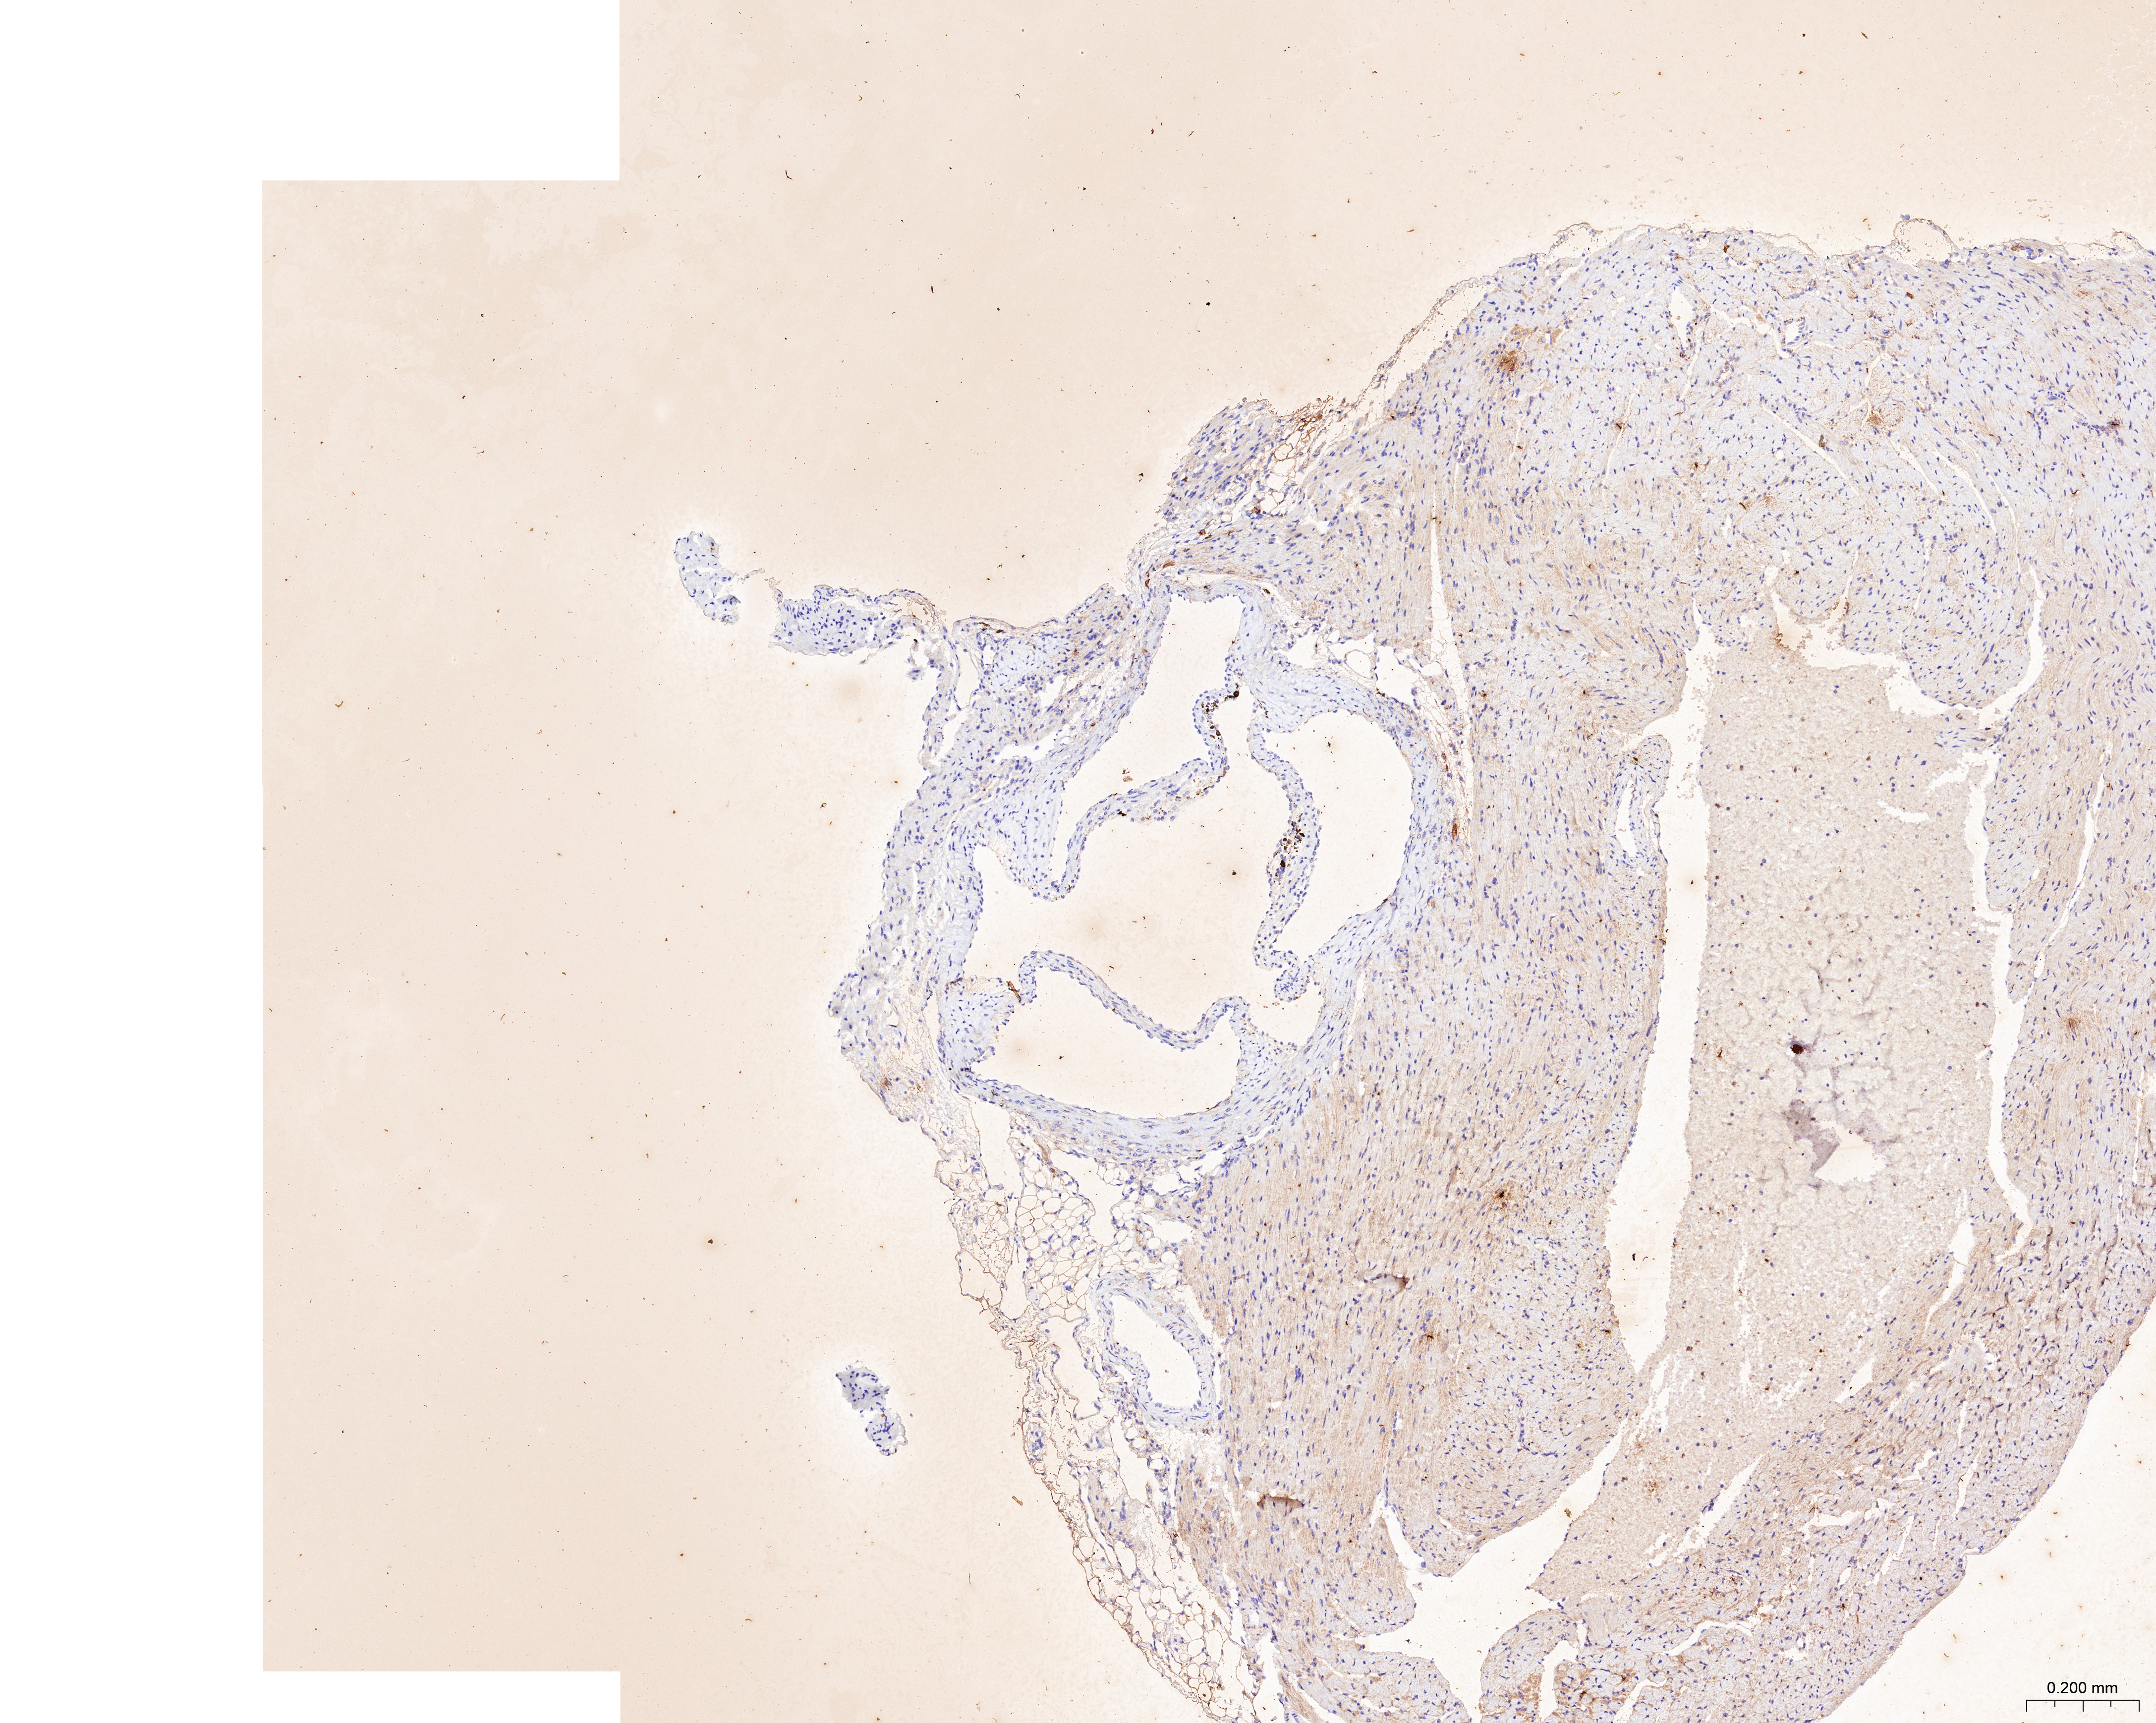
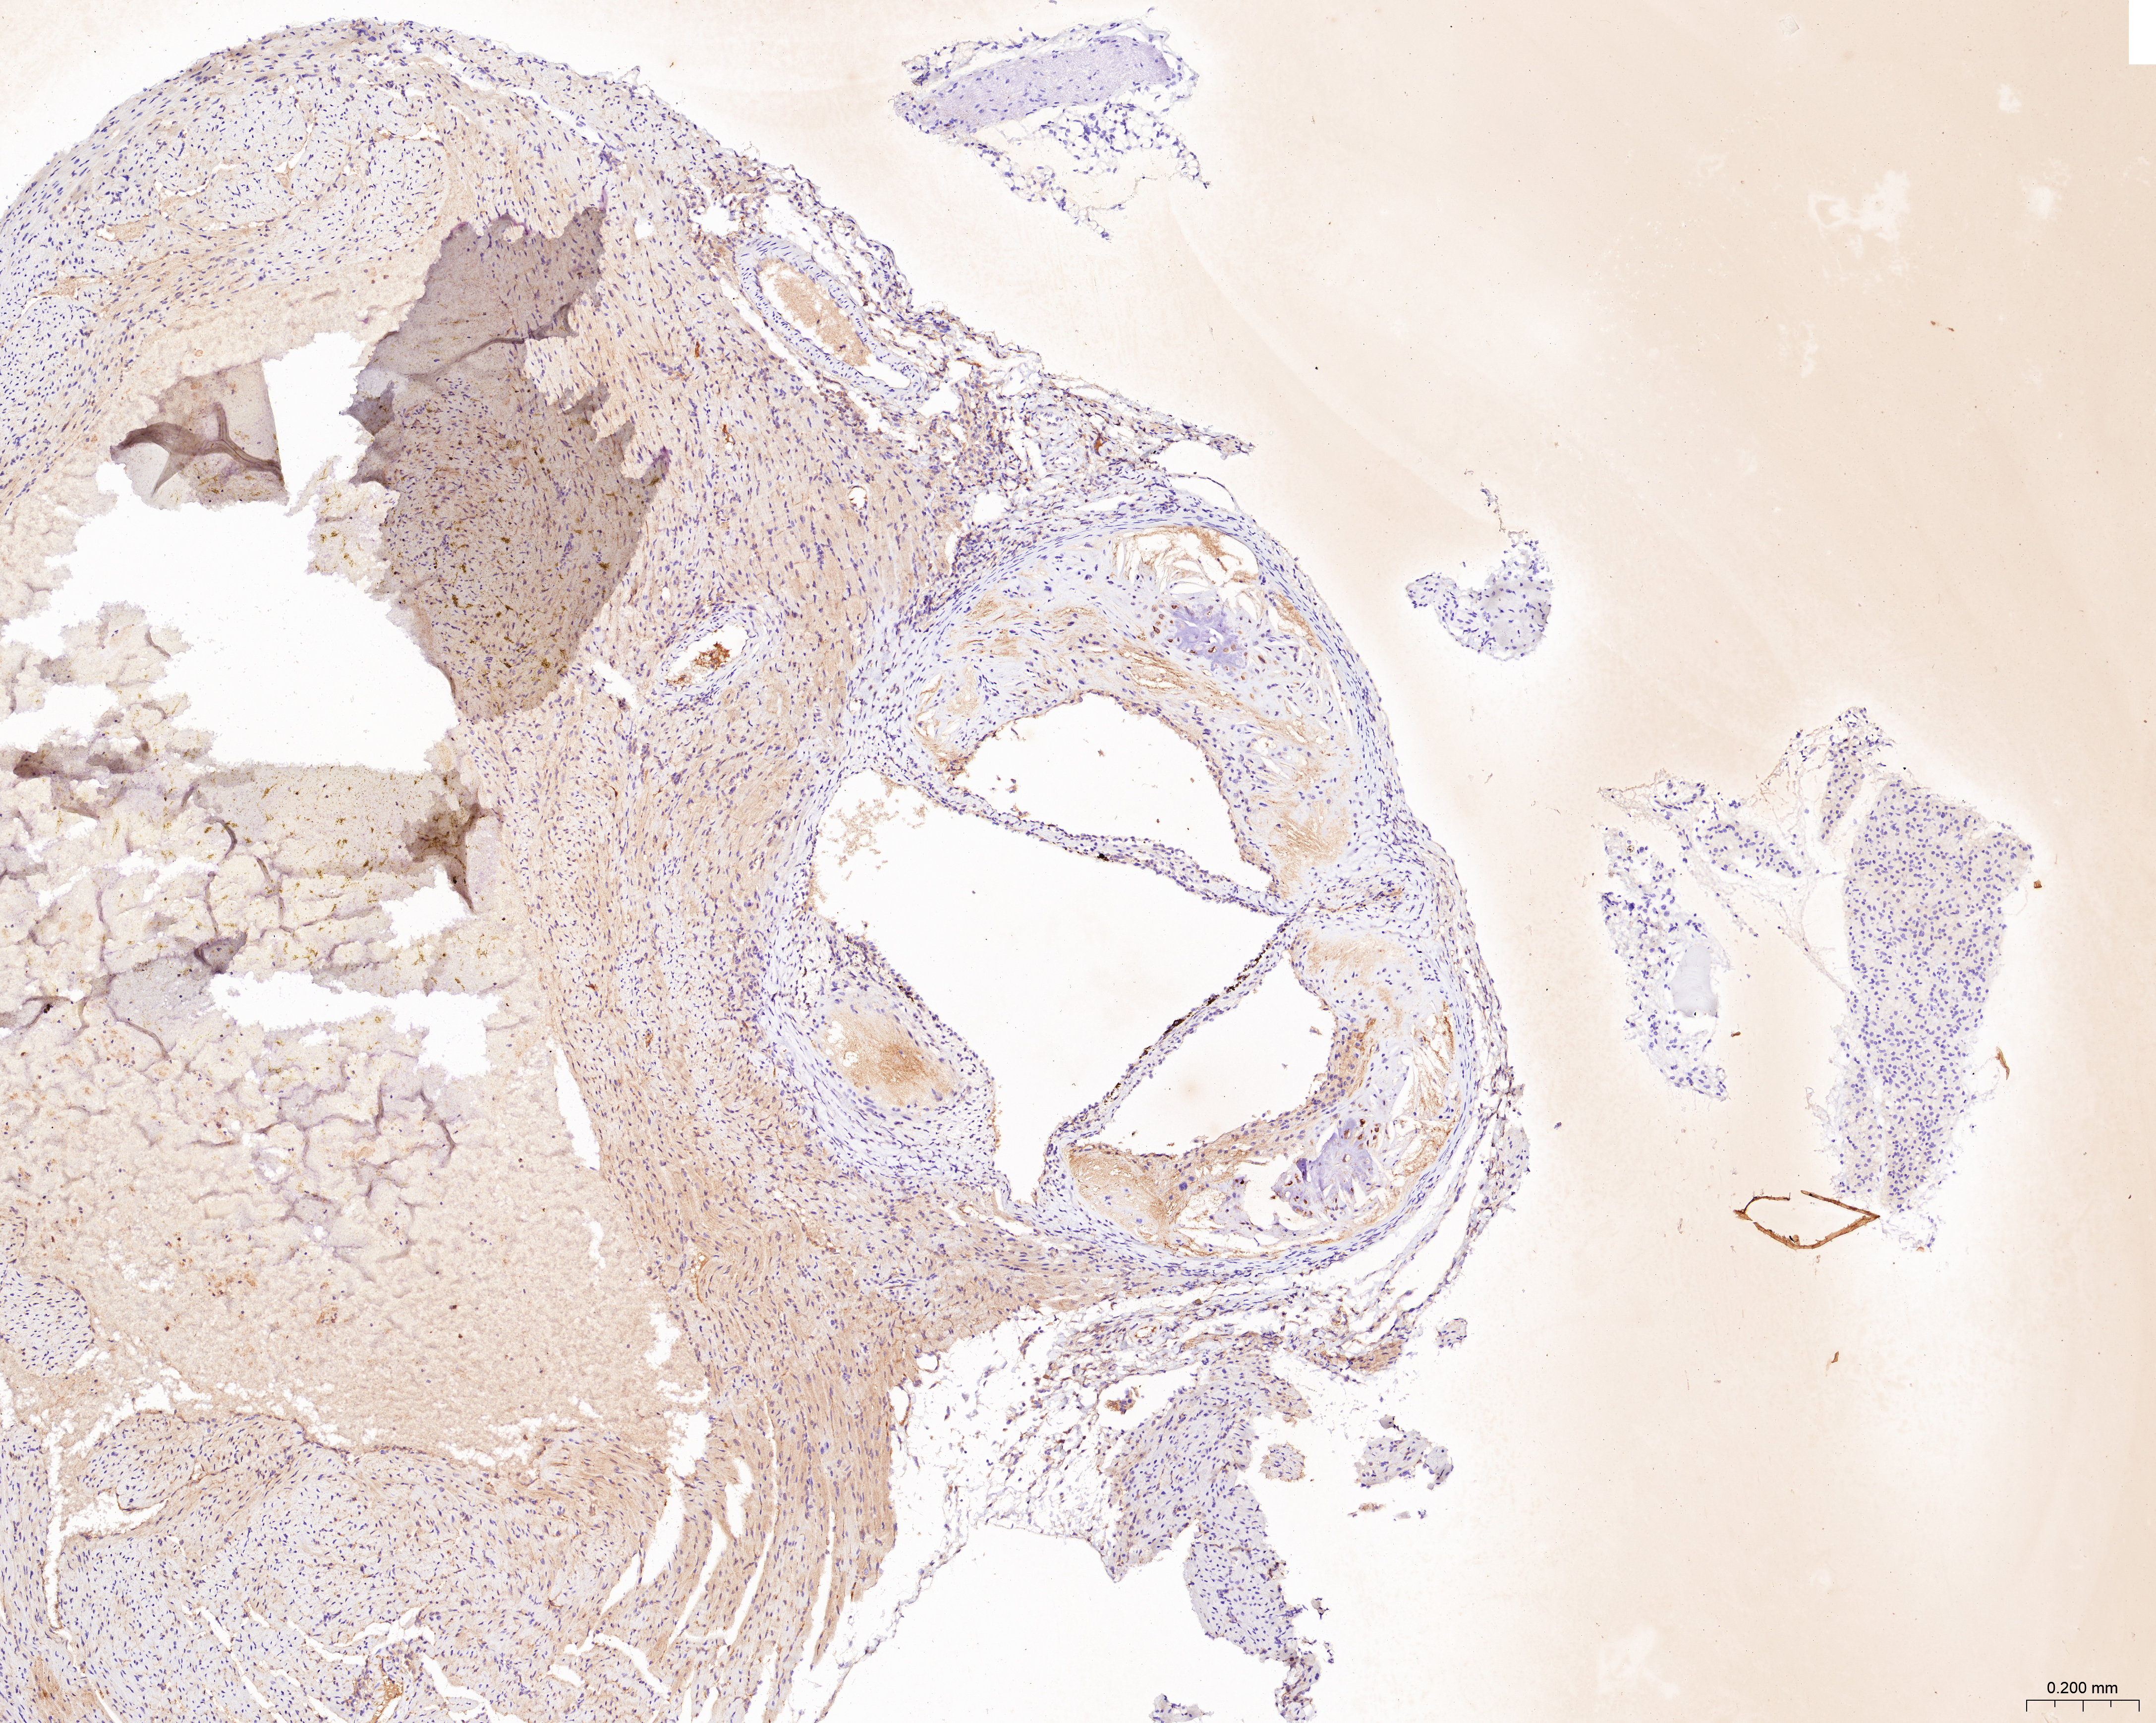
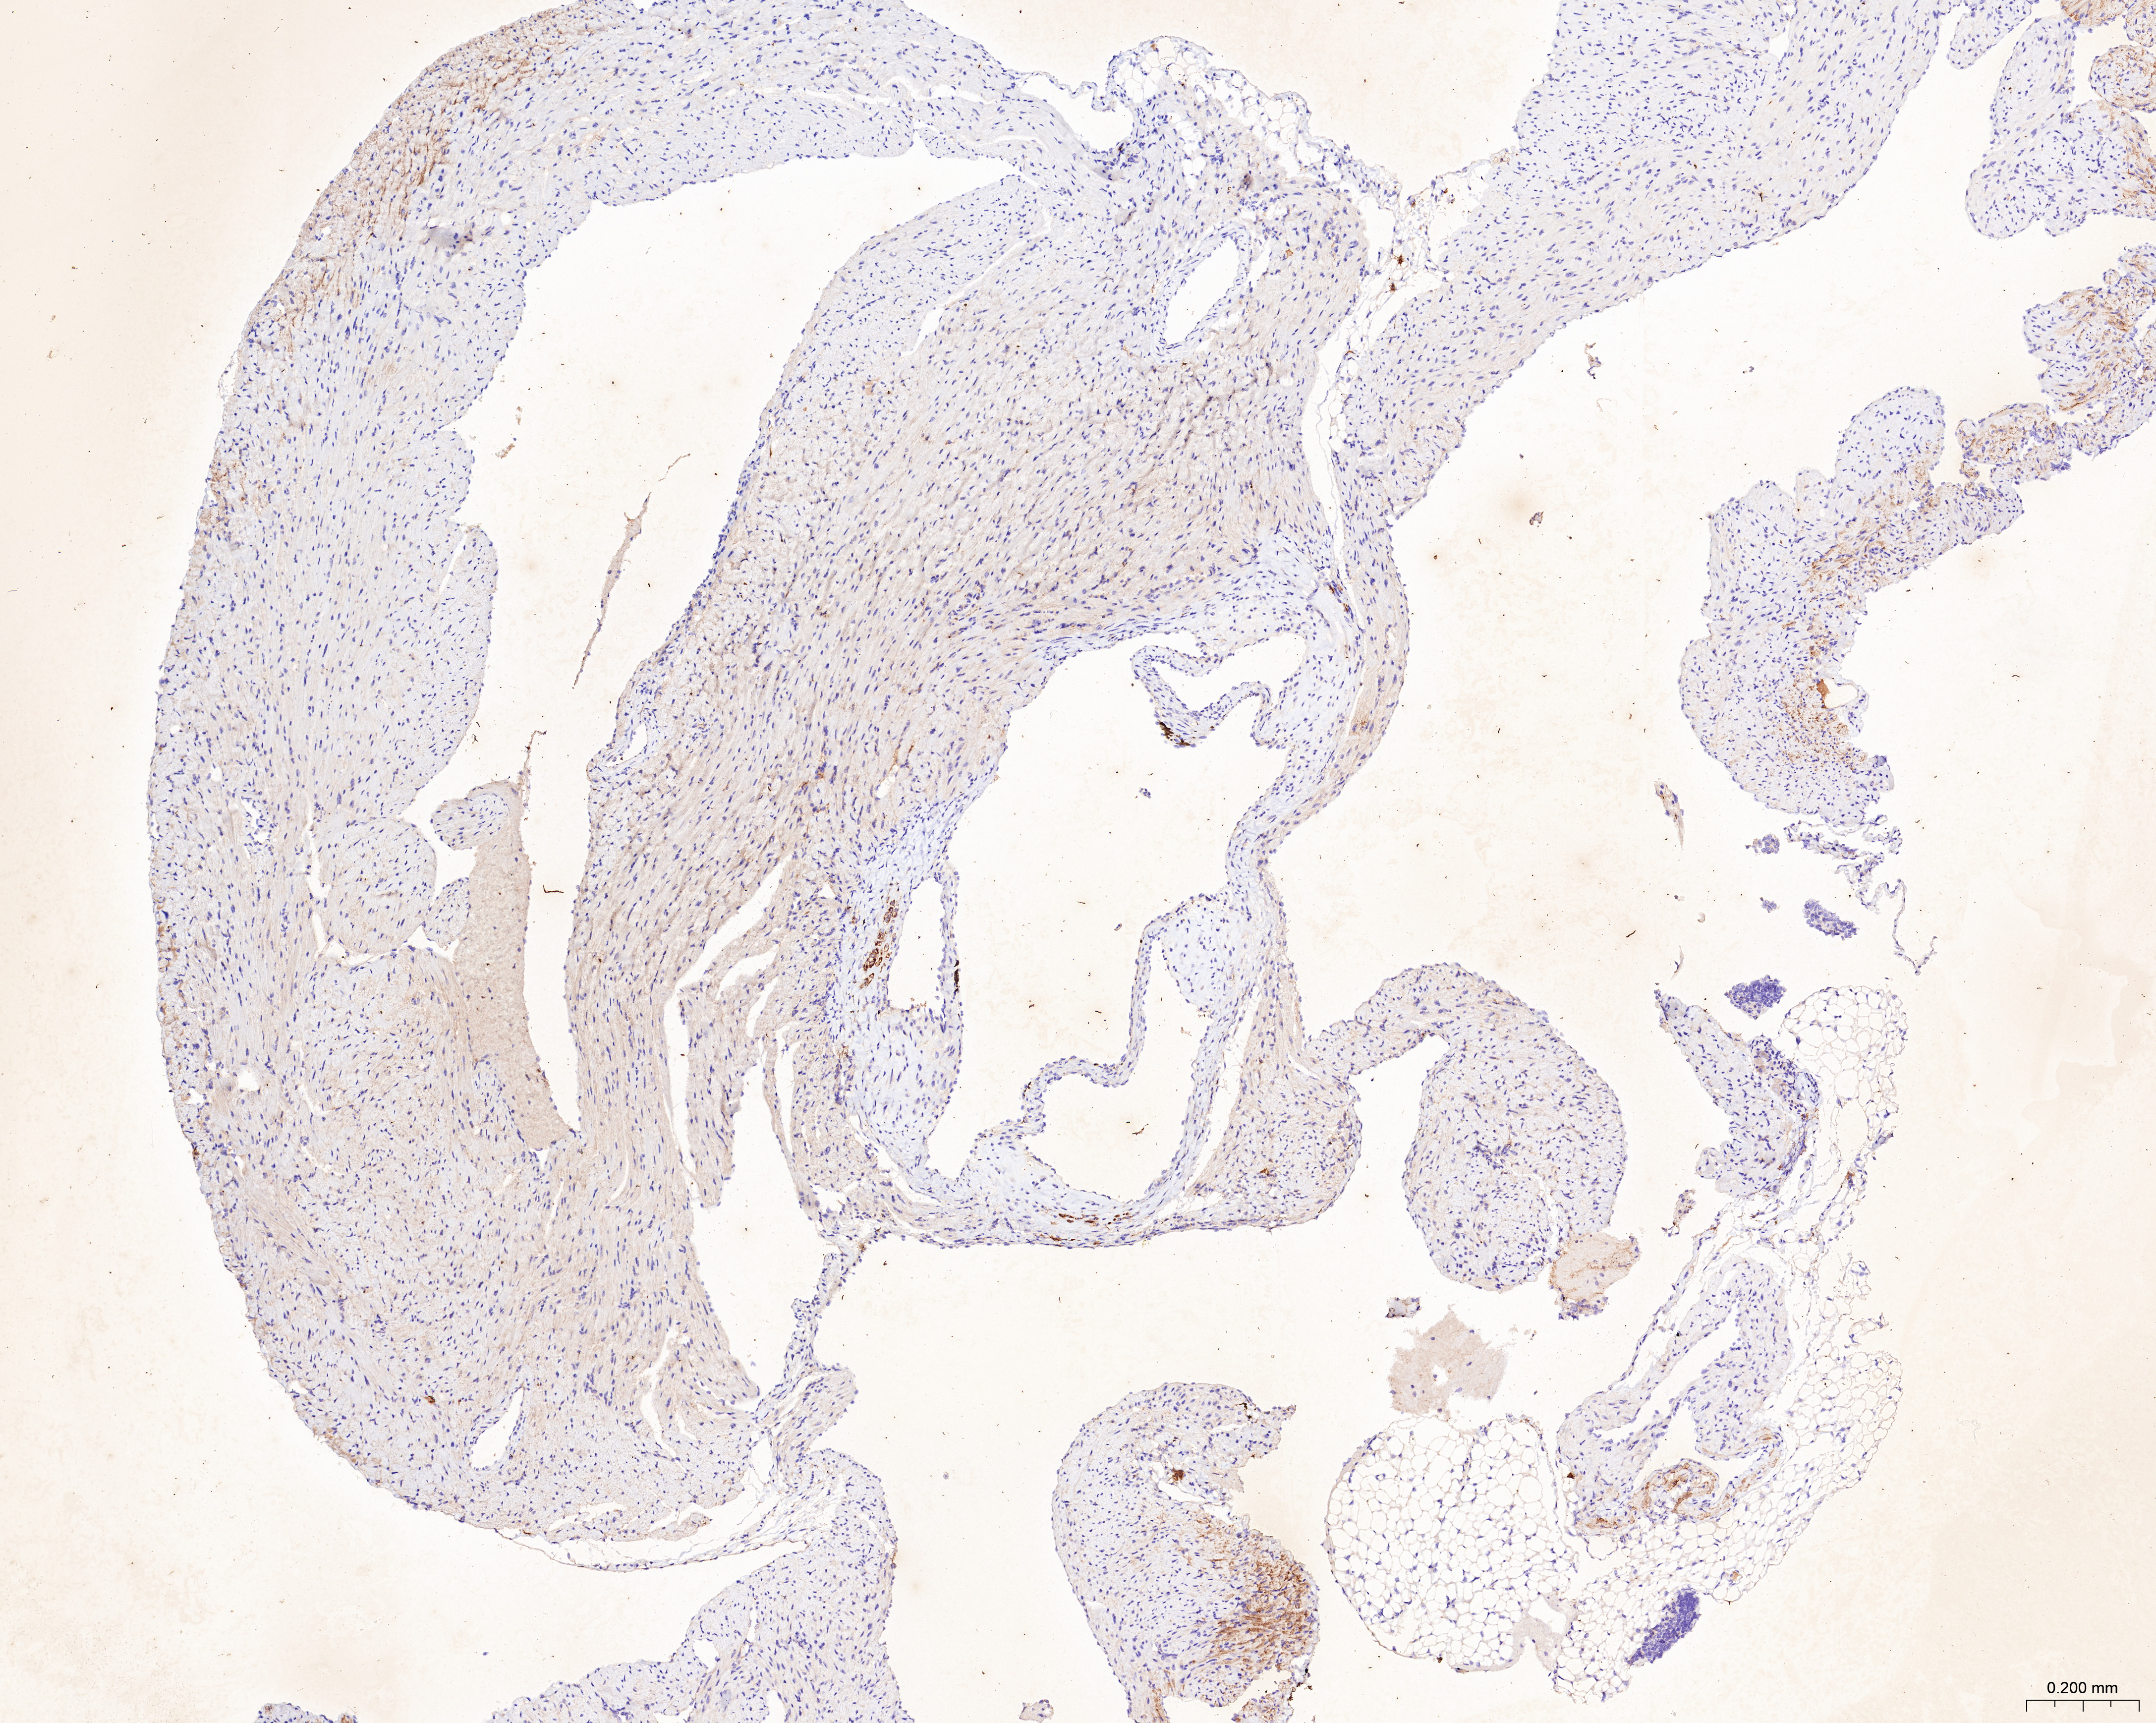
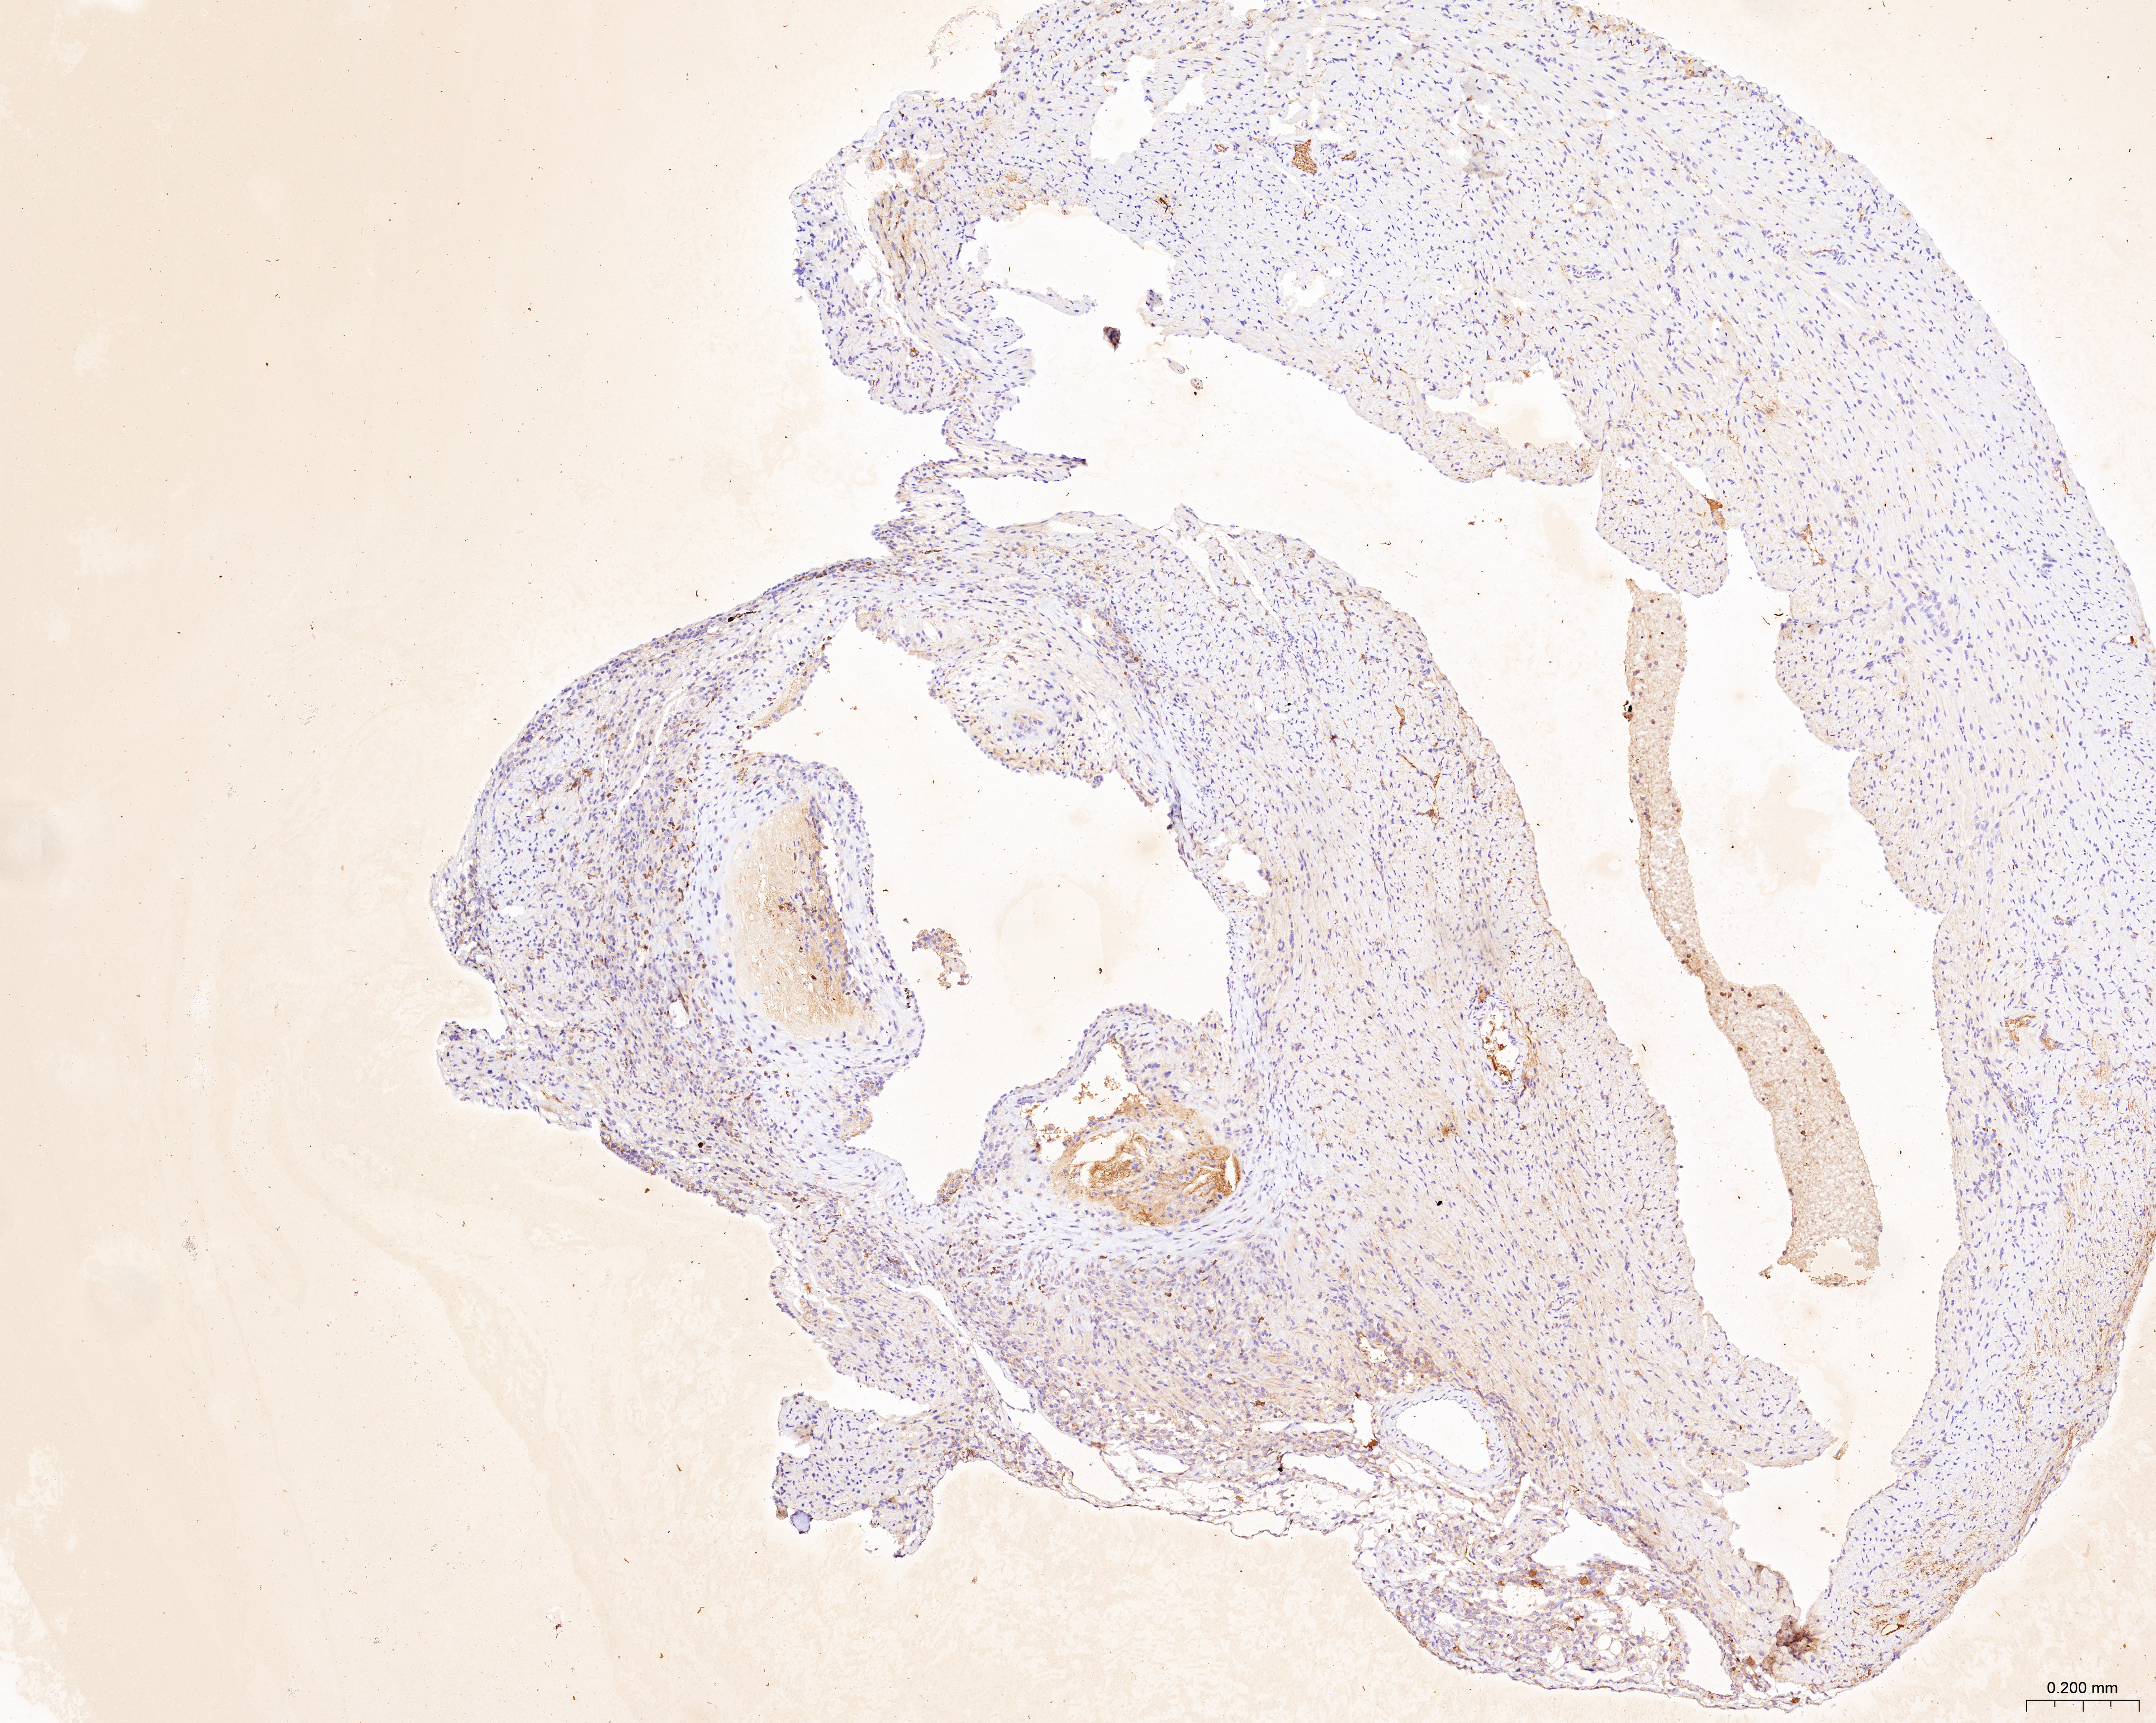
The treatment of HUVECs and HAoSMCs with ox-LDL significantly increased the expression levels of CCL2, LAMP2, and CTSB proteins (Figs. 9A and 9B) and mRNAs (Fig. 9C). Furthermore, ORO staining results demonstrated significant increase in the levels of atherosclerotic lesions in the high-fat-fed ApoE−/− mice compared with the control group (Figs. 9D and 9G). Moreover, H&E staining results showed larger plaques in the aortic root of the high-fat-fed ApoE−/− mice compared with normal-diet-fed C57BL/6 mice (Figs. 9E and 9H). This demonstrated the successful establishment of atherosclerotic mouse models. IHC staining of the aortic root also showed that the expression levels of CCL2, LAMP2, and CTSB were higher in the AS group compared with the control group (Figs. 9F, 9I–9K).
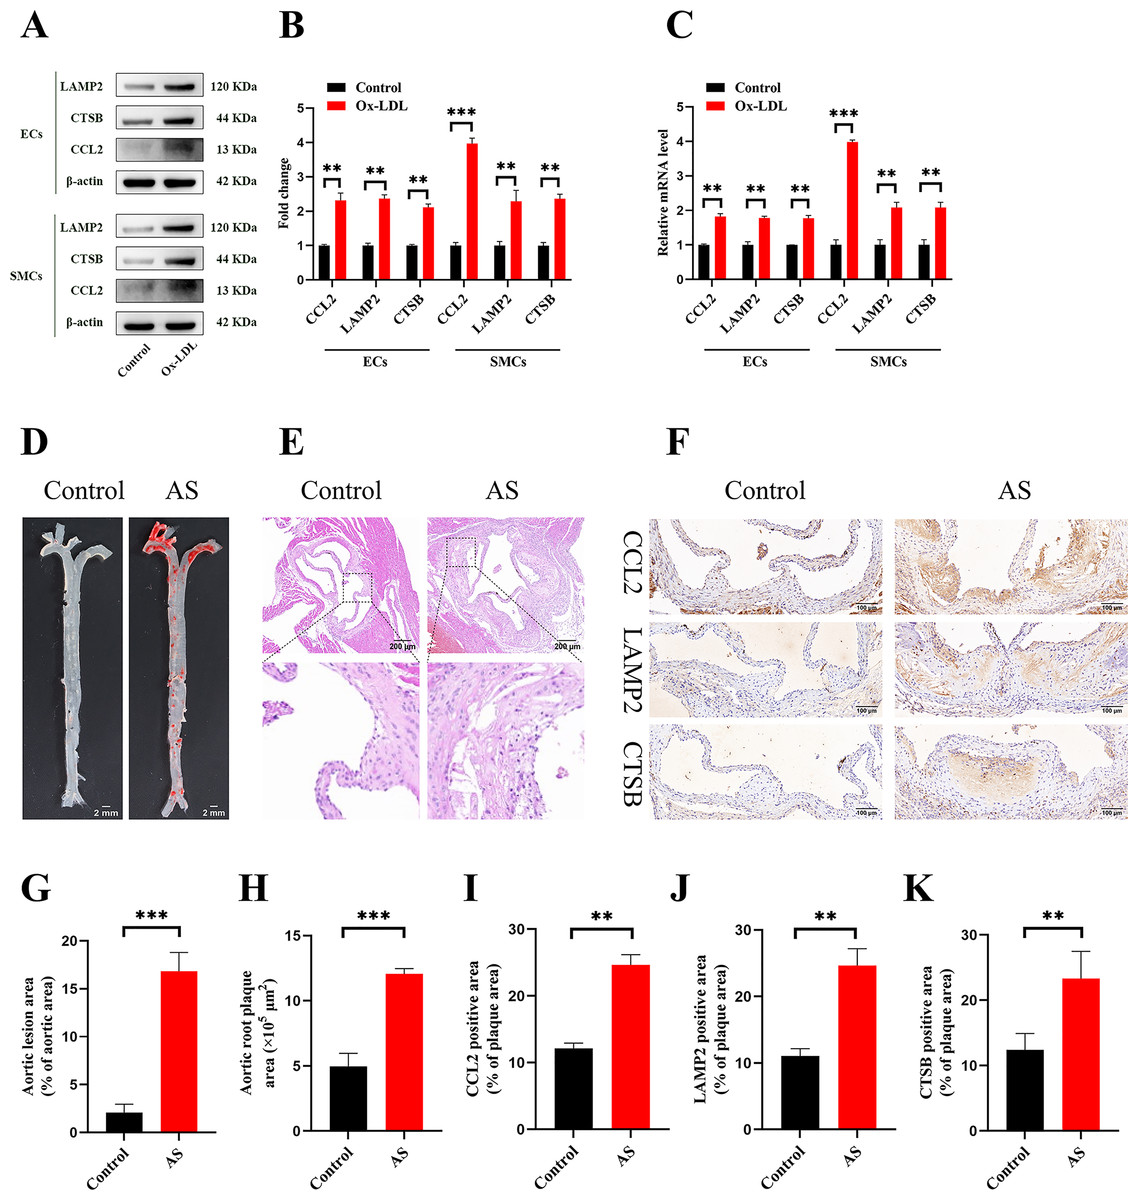
Figure 9: Vitro and vivo experiments verified the expression of three key CAS-related DE-ATGs.
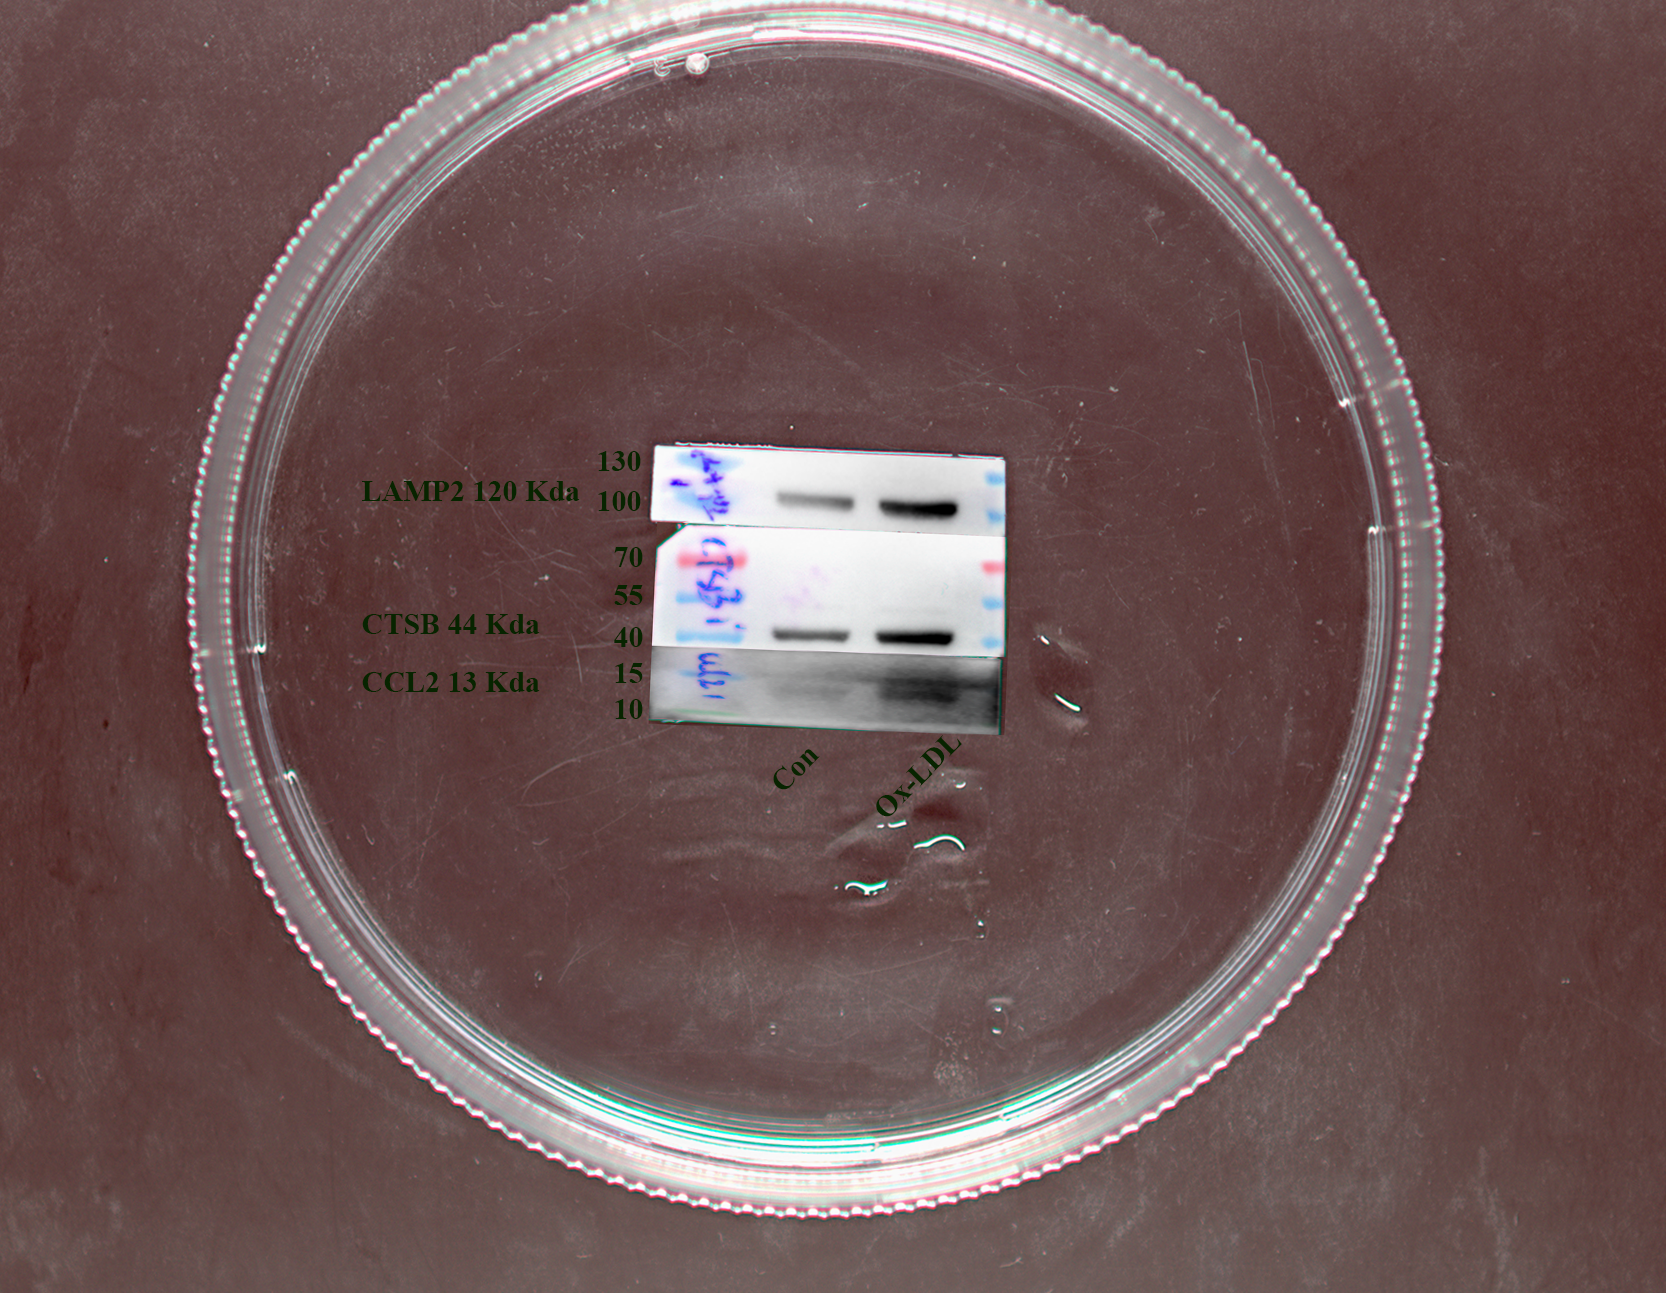
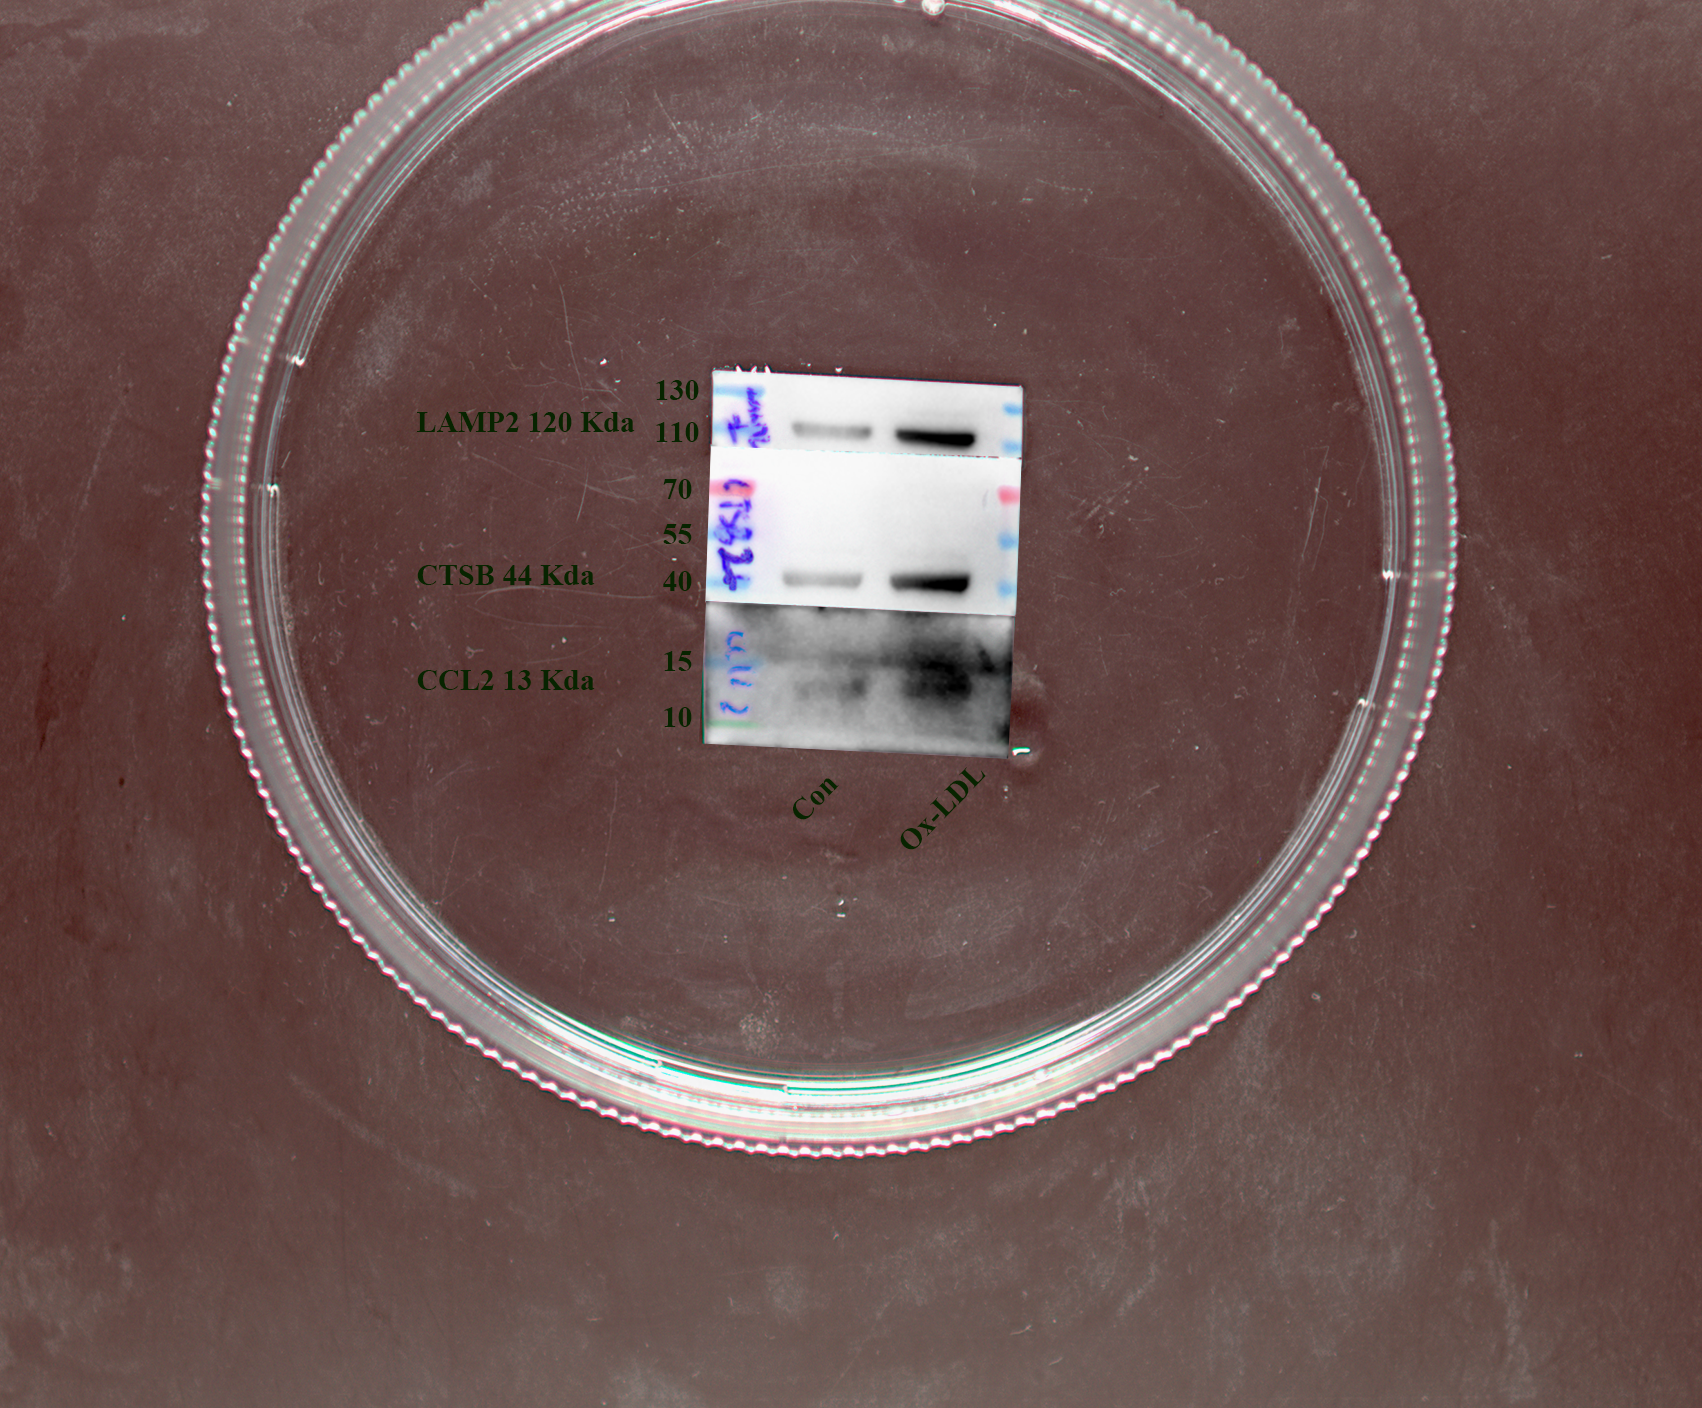
(A) HUVECs and HAoSMCs were incubated with ox-LDL (50 μg/mL) for 24 h or with normal medium for 24 h, and the expression of CCL2, LAMP2, and CTSB was measured by western blot (original blots are presented in Figs. S1 and S2). (B) Quantitative result of western blot. (C) QRT-PCR measured the expression of CCL2, LAMP2, and CTSB. (D) ORO staining of the entire aortas. Scale bars, 2 mm. (E) HE staining of the aortic root. Scale bars, 200 µm. (F) The aortic root was stained with antibodies against CCL2, LAMP2, and CSTB. Scale bars, 100 µm. (G) Quantification of the proportion of ORO positive area/total aortic area (%). (H) Quantitative data of the aortic root plaque area. (I–K) The percentages of CCL2, LAMP2, and CTSB positive area in the aortic root lesion. Data are presented as mean ± SD (n = 6). *P < 0.05; **P < 0.01; ***P < 0.001.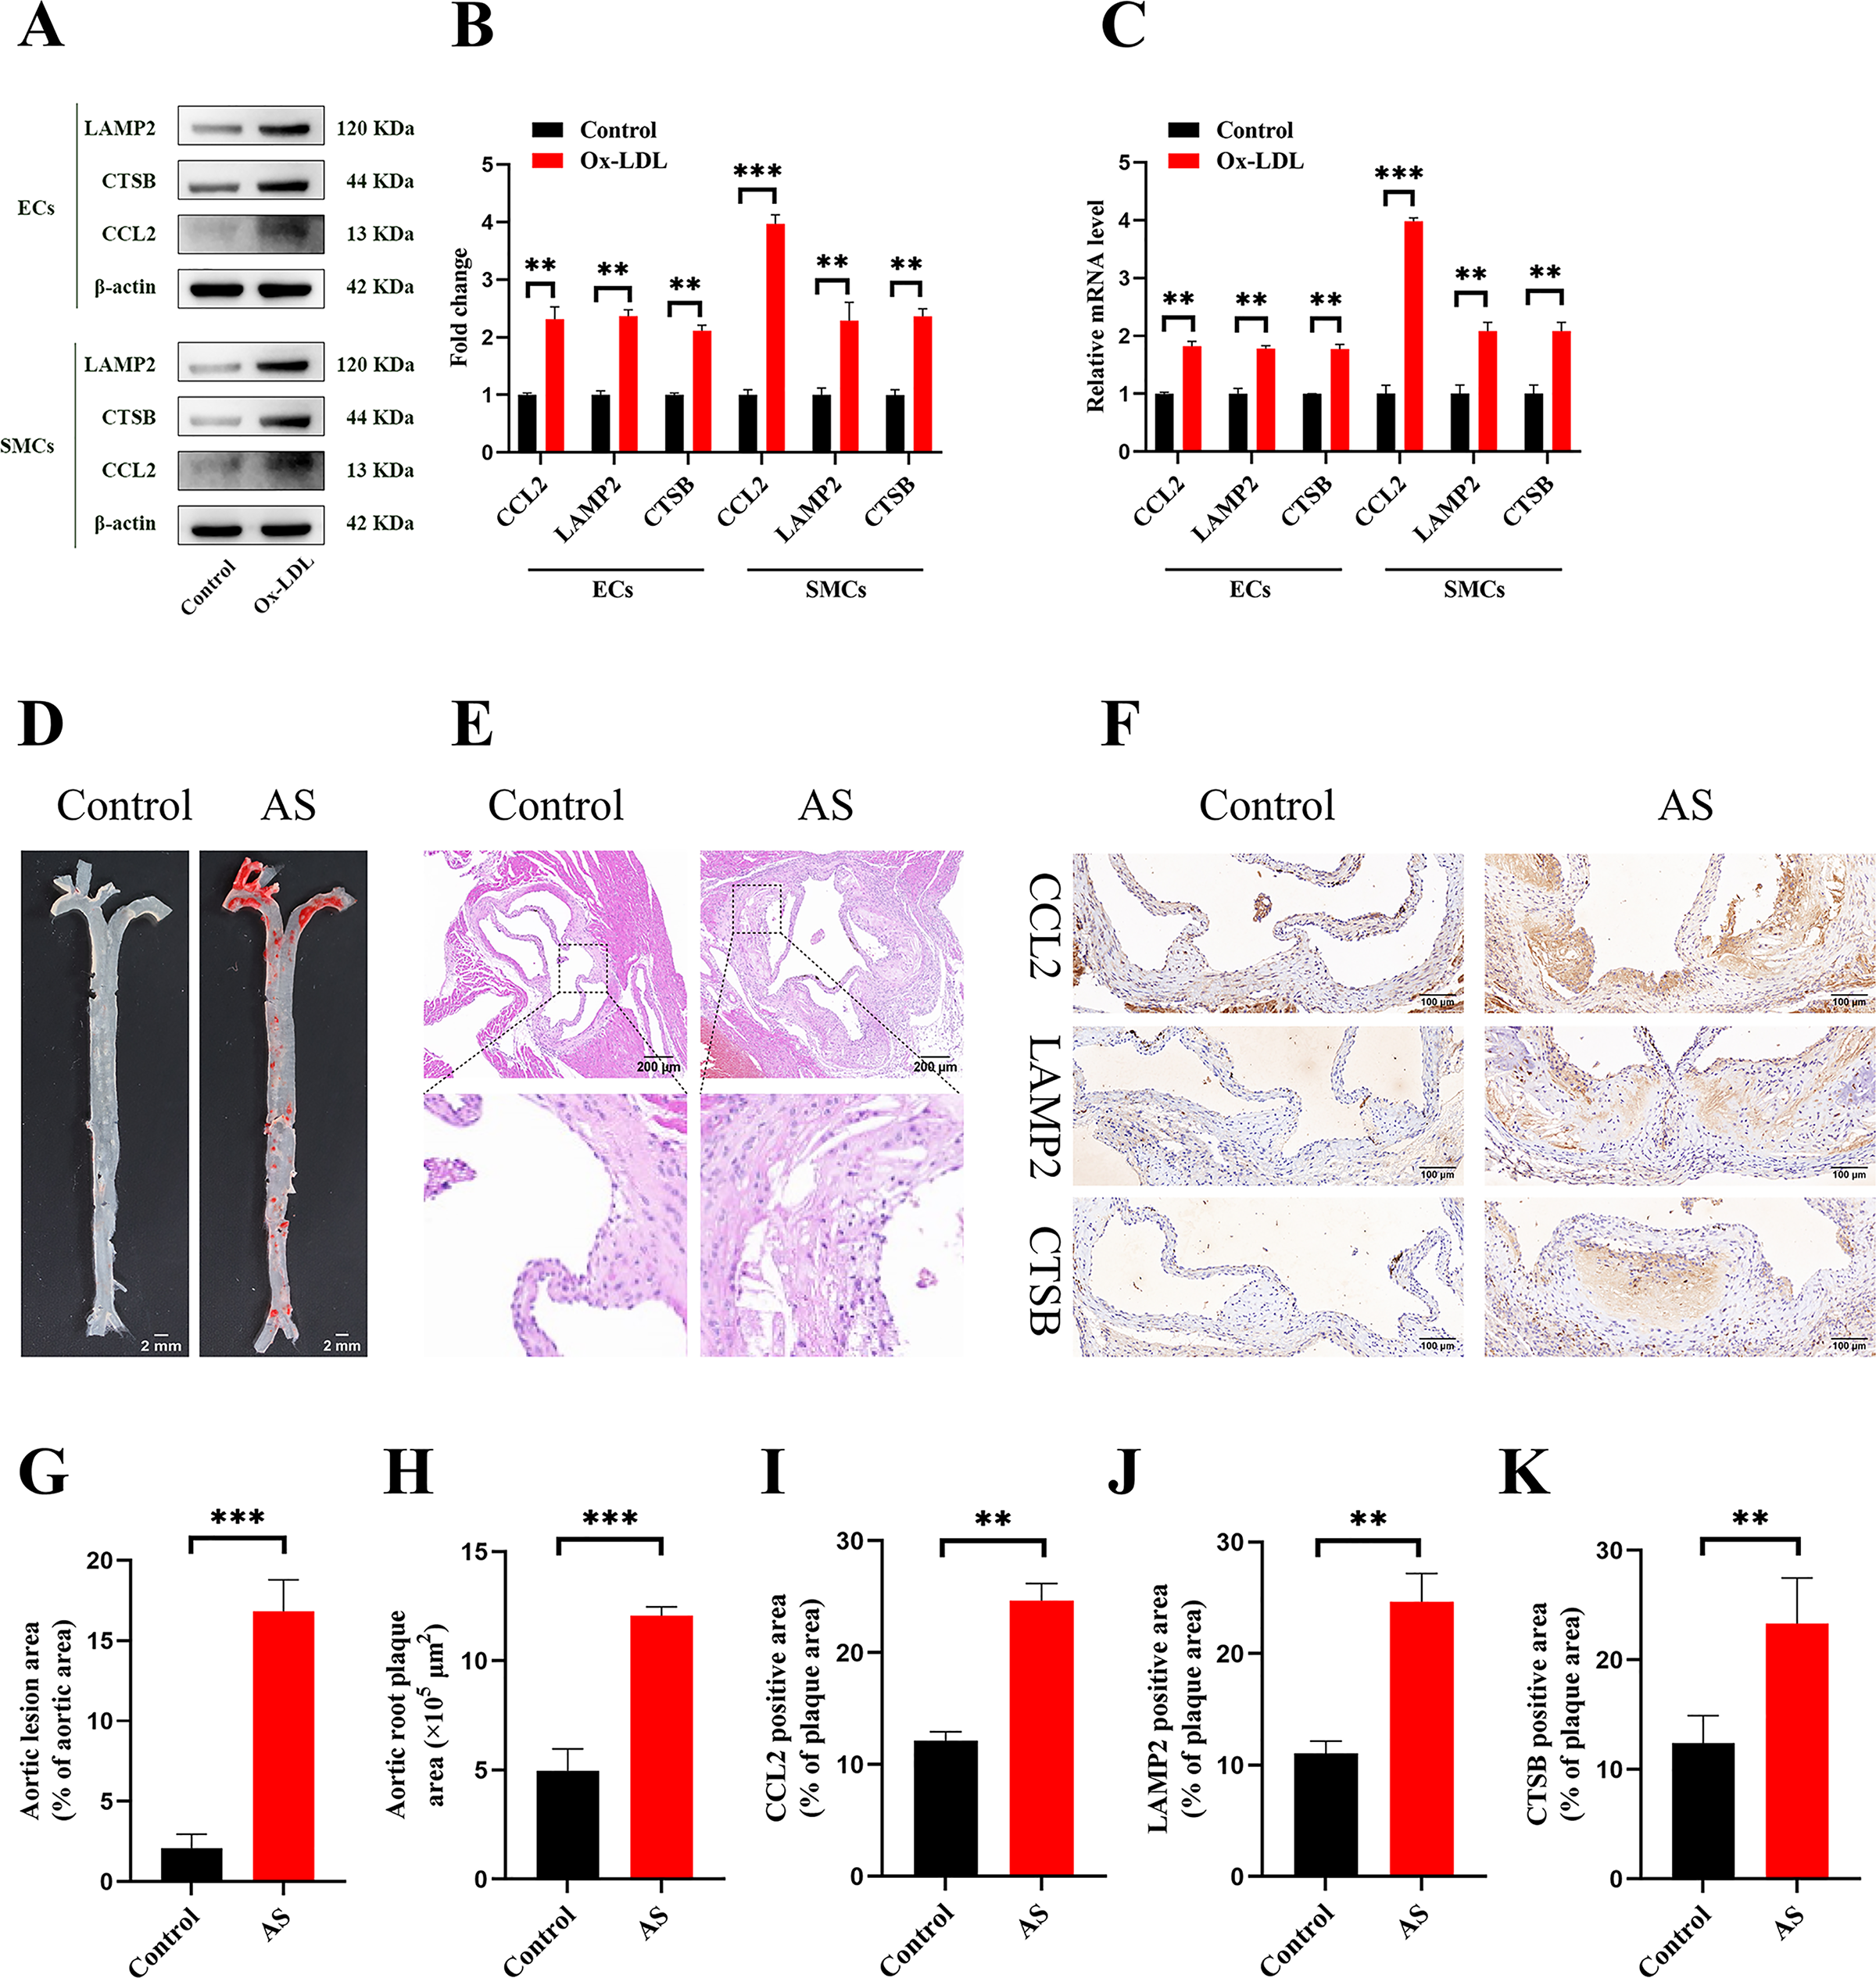
Discussion
CAS is a chronic inflammatory disease characterized by accumulation of lipids and immune cells in the sub-endothelial space of the carotid artery that causes significant damage to the endothelium (Herrero-Fernandez et al., 2019). Several studies have demonstrated that autophagy plays an essential role in the inhibition of inflammation and cholesterol efflux (Shao et al., 2016; Zhang & Zhang, 2022). However, in-depth investigations have not been conducted regarding the role of autophagy in CAS. Therefore, in this study we investigated the role of autophagy in the progression of CAS by identifying key ATGs associated with CAS.
Firstly, we identified 41 DE-ATGs in CAS based on the transcriptome data analysis of the GSE100927 dataset (GEO database) and the human autophagy database. Functional enrichment analysis of the DE-ATGs demonstrated that these DE-ATGs were associated with apoptosis, autophagy, and immune activation. We further identified three key DE-ATGs (CCL2, LAMP2, and CTSB) that were associated with CAS. ROC curve analysis demonstrated a high diagnostic value for these three key CAS-related DE-ATGs. Moreover, these three key DE-ATGs were associated with the infiltration of various immune cells into the atherosclerotic lesions. Estimation of the lesion area in the aortic root is the standard protocol for quantitating atherosclerosis in animal models (Song & Chen, 2021). Therefore, we quantified the lesion areas in the AS mouse model. Western blot and qRT-PCR analysis of the in vitro ox-LDL-treated HUVECs and HAoSMCs was used to validate the high expression of these three key ATGs. IHC staining of the aortic root was used to further confirm differential expression of these three key ATGs in the CAS model mice. Cellular and animal experiments showed that CCL2, LAMP2, and CTSB were highly expressed in the AS group. Therefore, these three key ATGs are potential diagnostic biomarkers and therapeutic targets for CAS.
CC-motif chemokine ligand 2 (CCL2) plays a key role in inflammation by enhancing the migration of monocytes/macrophages, thereby regulating the development of atherosclerosis (Singh, Anshita & Ravichandiran, 2021). CCL2 stimulates the release of several inflammatory mediators that promote the progression of CAS (Satonaka et al., 2015). The CCL2-CCR2 pathway is an emerging drug target for protecting against atherosclerosis and other cardiovascular diseases by regulating inflammation (Georgakis et al., 2022). CCL2 expression is significantly increased by inhibiting autophagy in the ATG7-specific knockout VSMCs and mice (Osonoi et al., 2018). Therefore, we postulate that CCL2 may promote inflammation and ultimately lead to the development of CAS by inhibiting autophagy.
Lysosomal-associated membrane protein 2 (LAMP2) is predominantly found on lysosomal membranes and influences the formation of CAS by regulating autophagy (Eskelinen, 2006; Zhang et al., 2021a, 2021b). LAMP2-deficient mice showed accelerated atherosclerotic progression because of increased activation of the NLRP3 inflammasome and inflammation (Qiao et al., 2021). Among patients suffering from coronary heart disease, LAMP2 gene expression was significantly increased in peripheral leukocytes, suggesting that increased LAMP2 is a protective factor (Wu et al., 2011). Therefore, we could infer that high expression of LAMP2 would slow down the progression of CAS by suppressing inflammation through enhanced autophagy.
Cathepsin B (CTSB) is a lysosomal cysteine protease found in autolysosomes during autophagy and plays a key role in CAS (Cai, Xu & Liu, 2024; Man & Kanneganti, 2016). CTSB leads to apoptosis by promoting autophagy (Chen et al., 2021). The expression levels of CTSB are elevated in chronic heart disease (Dai et al., 2021). We postulate that CTSB-activated autophagy delays the progression of CAS by promoting cellular apoptosis in patients with CAS. Therefore, drugs that increase CTSB levels may be effective in slowing down the progression of CAS and improving the prognosis of patients with CAS.
Dysregulation of autophagy is present in atherosclerosis. Basic autophagy exerts anti-atherosclerotic effects by promoting cholesterol efflux and attenuating inflammatory responses, whereas inhibited or overstimulated autophagy exerts pro-atherosclerotic effects by inhibiting cholesterol efflux and exacerbating inflammatory responses (Lin et al., 2021). For example, ATG14 inhibited inflammation and atherosclerosis by promoting autophagy (Zhang et al., 2021a). However, ATG7 silencing in the VSMCs and mice inhibited autophagy and accelerated atherosclerotic development (Osonoi et al., 2018). In our study, CCL2 promotes CAS by inhibiting autophagy, whereas LAMP2 and CTSB inhibit CAS by enhancing autophagy.
CAS is a chronic inflammatory disease associated with the immune response (Roy, Orecchioni & Ley, 2022; Wolf & Ley, 2019). Single-cell sequencing data has previously confirmed significant enrichment of T cells and macrophages in the CAS plaques (Fernandez et al., 2019). However, the role of other immune cells needs to be clarified. We used CIBERSORT to assess the proportion of different types of immune cells in the early and advanced plaques. In the current study, the proportion of M0 macrophages and gamma delta T cells was significantly higher in the advanced plaques compared with the early plaques. This concurred with the results from previous studies that also showed higher proportions of M0 macrophages and gamma delta T cells in the atherosclerotic plaques (Shen et al., 2021; Yang et al., 2021). Previous studies have also shown that significant increase in the proportion of mast cells promotes the initiation and progression of atherosclerosis (Bot & Biessen, 2011; Bot, Shi & Kovanen, 2015). Subsequently, we demonstrated that the three key ATGs with diagnostic value were closely associated with the immune cells. Therefore, we propose that a combination of the expression levels of the key DE-ATGs and the infiltration levels of immune cells would significantly increase inflammation within the plaques in advanced CAS.
In recent years, targeted drugs have developed rapidly and are preferred for clinical use because of their therapeutic stability and low toxicity (Yang et al., 2020). For example, a targeted drug loaded with IL-10 mRNA inhibits the progression of atherosclerosis by suppressing inflammation (Gao et al., 2023). We postulate that development of targeted drugs to these key ATGs may reduce the risk of surgery and the cost of early intervention for the CAS patients. Functional analysis of the three key ATGs demonstrated that increased CCL2 expression was linked to inflammatory activation and deficient autophagy, whereas increased LAMP2 and CTSB expression was linked to activation of autophagy. This suggested that combining anti-inflammatory drugs with drugs that increase autophagy may be an effective treatment strategy for suppressing the progression of CAS.
This study has several limitations. Firstly, we analyzed only two publicly available datasets with limited samples. In the future, bioinformatics analyses of a larger number of samples and datasets are required to confirm our findings. Secondly, further experimental validation is required to confirm the changes in the immune cell type composition of the early and advanced plaques. Finally, we verified expression levels of the three key ATGs in the in vitro and in vivo experiments but did not investigate the potential mechanism of these genes in cells and tissues. So, further in vitro and in vivo experiments are necessary to confirm our findings.
Conclusion
We identified three key DE-ATGs (CCL2, LAMP2, and CTSB) that were linked to the formation and progression of the CAS plaques. These three key DE-ATGs were associated with the infiltration of immune cell types into the CAS plaques. CCL2, LAMP2, and CTSB are promising diagnostic biomarkers and therapeutic targets for patients with CAS.