Road mortality of water snakes in light of landscape structure and traffic intensity in north-eastern Hungary
- Published
- Accepted
- Received
- Academic Editor
- Daniel Silva
- Subject Areas
- Biodiversity, Conservation Biology, Ecology, Zoology, Freshwater Biology
- Keywords
- Flood control, Hibernation, Inundation, Landscape composition, Roadkill, Wetland, Natrix, Life history
- Copyright
- © 2024 Szabolcs et al.
- Licence
- This is an open access article distributed under the terms of the Creative Commons Attribution License, which permits using, remixing, and building upon the work non-commercially, as long as it is properly attributed. For attribution, the original author(s), title, publication source (PeerJ) and either DOI or URL of the article must be cited.
- Cite this article
- 2024. Road mortality of water snakes in light of landscape structure and traffic intensity in north-eastern Hungary. PeerJ 12:e17923 https://doi.org/10.7717/peerj.17923
Abstract
Road mortality can be a serious threat to different animals, including snakes. However, mortality patterns can vary between species, intraspecific groups, locations and time. We compared the number of road-killed individuals (carcasses) of two semiaquatic water snakes (Natrix natrix and N. tessellata) on 58 km of road sections bordered by an active floodplain and a flood-protected former floodplain on one side and mountainous areas on the other in NE Hungary based on surveys conducted once every two weeks in three non-consecutive years. The results showed high road mortality of snakes, with a spring and an autumn peak corresponding to the times when snakes emerge from and return to hibernating sites. The results show that small-scale spatial differences in road mortality were mediated by landscape structure along the road, while the effects of traffic volume, flood regime and the age and sex of the individuals were negligible. For conservation, the study suggests that establishing culvert passages under the road and/or artificial hibernating sites on the floodplain-side of the roads in critical sections can be promising in reducing road-related mortality.
Introduction
Despite their relatively small area, linear infrastructures such as roads can have a high impact on wildlife occurring in surrounding areas. Roads can disrupt landscape connectivity and lead to habitat fragmentation (Trombulak & Frissell, 2000), reduce gene flow between populations (Riley et al., 2006), and, most visibly, can lead to the direct mortality of animals through collisions with vehicles, which can result in reduced population sizes (Fahrig & Rytwinski, 2009; Grilo et al., 2021). Road-related mortality usually occurs non-randomly along the road and is often confined to specific time and space intervals related to biological and environmental factors (Sillero et al., 2019; Medinas et al., 2021; Russo-Petrick & Root, 2023). Biological factors, such as reproductive features of animals, can explain the seasonality of increased road mortality (Rahhal et al., 2023), for example, when traffic co-occurs with the dispersal of juveniles from their places of birth or hatching (Seo et al., 2013) or with the migration of adults to breeding sites (Elzanowski et al., 2008). Environmental factors such as landscape features and roadside habitats can also have a major impact on the spatial patterns of road mortality (Matos, Sillero & Argaña, 2012; Medrano-Vizcaíno et al., 2023a; Medrano-Vizcaíno et al., 2023b). Finally, the overall increase in the intensity of vehicle traffic may also increase road mortality. However, its effect is ambiguous and can be limited to certain animals (Erritzoe, Mazgajski & Rejt, 2003; Mazerolle, 2004).
Many snake species are mobile, use multiple habitats in a year, and are frequent victims of road mortality, which can be responsible for eliminating as much as 10–20% of individuals of a population per year (Roe, Gibson & Kingsbury, 2006) and may even lead to increased risk of population extinction (Row, Blouin-Demers & Weatherhead, 2007). Snakes are often hit by cars transitioning between different habitat types, for example, when they leave hibernation sites for foraging areas in their active season (Shine & Mason, 2004); when they disperse from hatching sites as juveniles; when they search for conspecifics for mating; or when females look for nest sites for egg-laying (Bonnet, Naulleau & Shine, 1999). Because snakes often use different habitats for different behaviours, they are highly suitable for monitoring the impact of road mortality on biodiversity.
The aim of this study was to compare road mortality of two semi-aquatic snake species (grass snake Natrix natrix, dice snake Natrix tessellata) on roads running through a diverse landscape in north-eastern Hungary. Three specific questions were addressed:
What are the temporal and spatial patterns of road mortality?
How does land use affect road mortality?
Does flood regime or traffic intensity play a role in road mortality?
We also provide conservation recommendations to reduce the road mortality of snakes and other animal species in floodplain areas.
Material and Methods
Portions of this text were previously published as part of a preprint (https://www.researchsquare.com/article/rs-2715110/v1).
Study area
The studied road sections are located in the Tokaj-Hegyalja region, in the south of the Zemplén mountains and north of Tokaj town (E 21.4124, N 48.1215) in north-eastern Hungary. In the south they are bordered by two floodplain areas, the Taktaköz in the southwest and the Bodrogzug in the southeast that share most of the habitat types of the region but differ in hydrological regime. Both areas are dominated by floodplain meadows, forests and arable lands, whereas the hillside areas are dominated by meadows, forests, and vineyards (Fig. 1). The construction of a system of levees and drainage canals led to the cessation of floods in the Taktaköz floodplain (referred to as “flood-protected area” heretofore), whereas the Bodrogzug area has remained an active floodplain (Boldogh et al., 2016).
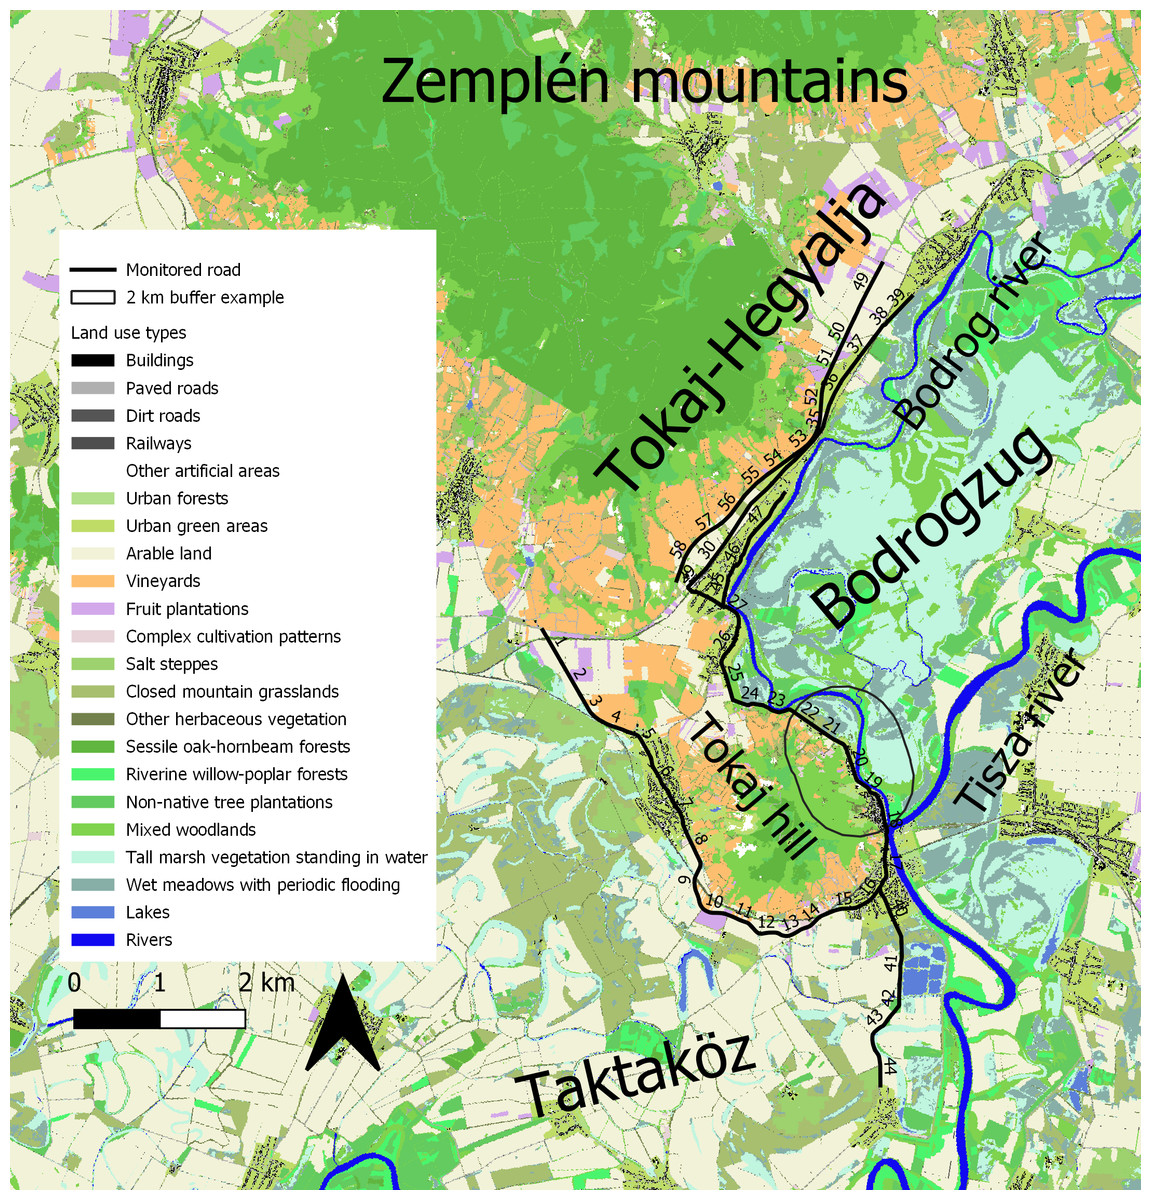
Figure 1: Map of the study area.
The numbers on the solid line are indicating the monitored road sections. A 2-km buffer was added to section 20 to demonstrate buffer size in the landscape. Different land use types are indicated with different colors. This map and analysis was created using the Ecosystem Map of Hungary (project KEHOP-430-VEKOP-15-2016-00001, Ministry of Agriculture, 2019; http://alapterkep.termeszetem.hu/).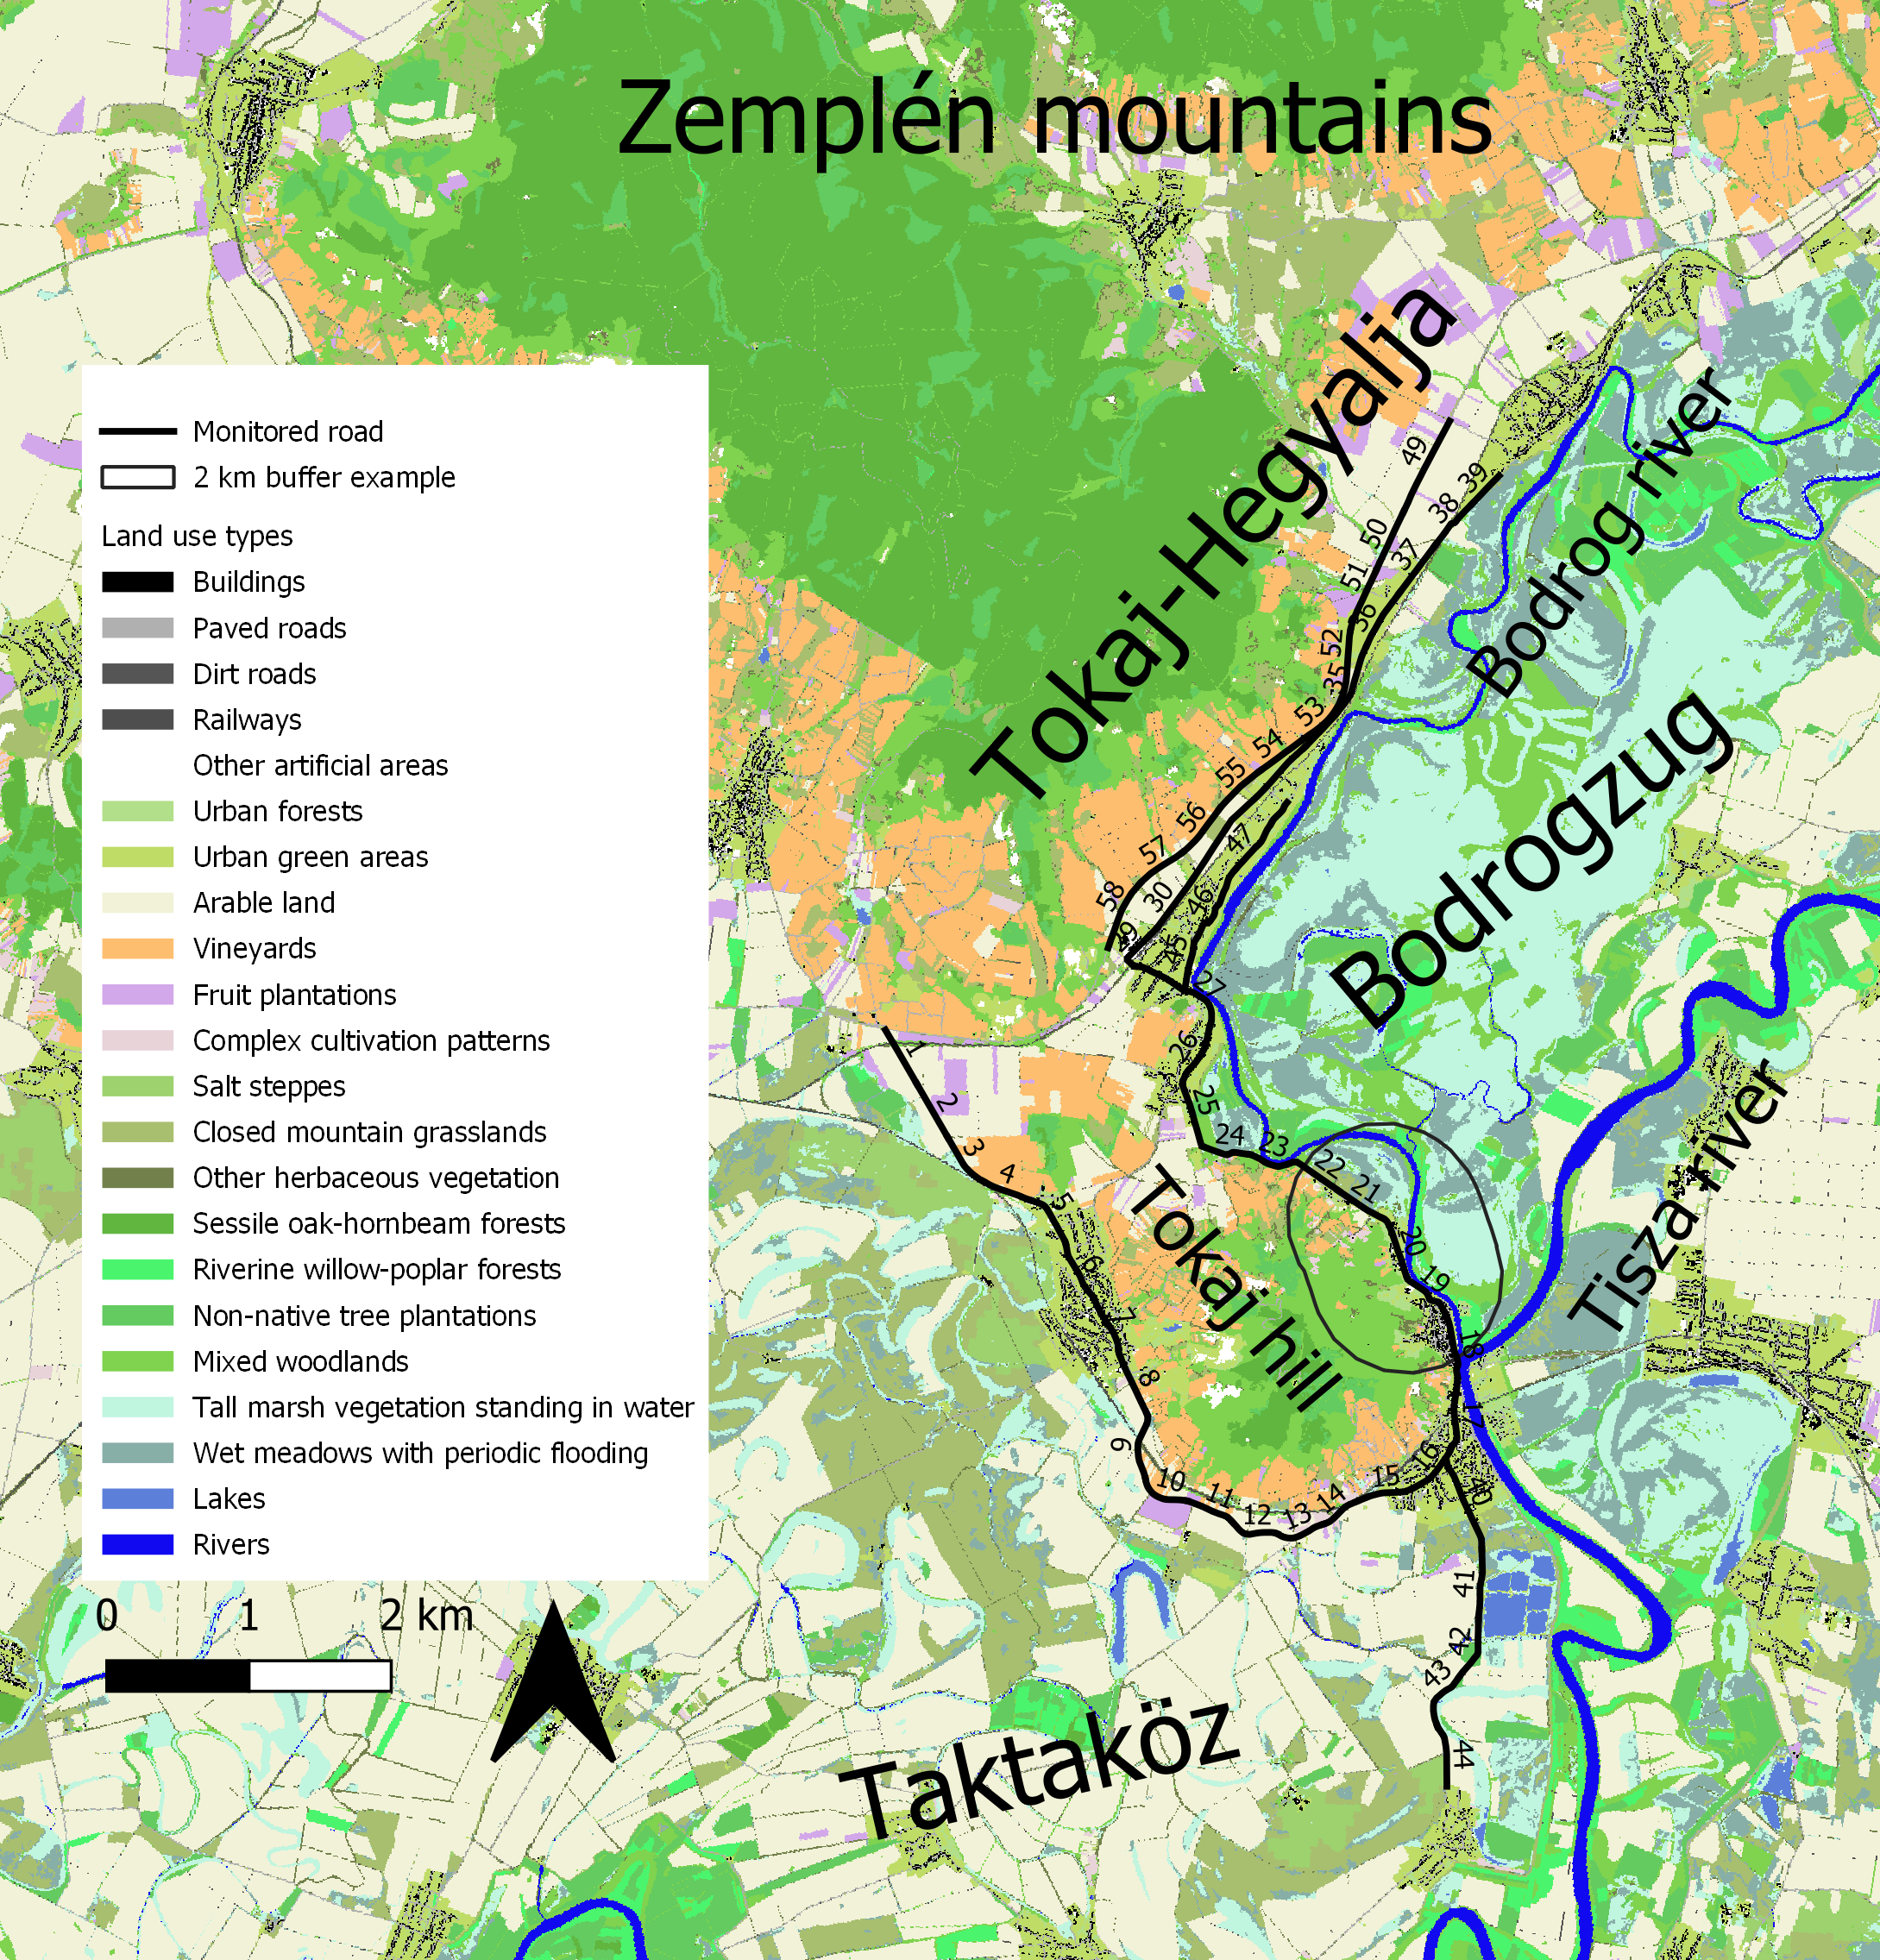
Study species
Primarily, we were interested in understanding which species were most readily susceptible to road mortality. To accomplish this, we surveyed every snake carcass encountered within the parameters of the study site. Results revealed that the majority of carcasses belonged to two semi-aquatic snake species, the grass snake Natrix natrix and the dice snake Natrix tessellata. We found only few carcasses of other species occurring in the area which were eventually excluded from this study due to low sample sizes. Both Natrix species are usually confined to aquatic habitats, such as rivers, lakes and nearby habitats. Natrix natrix is a habitat generalist often found far from water in forests and meadows where its amphibian prey occur, while the more habitat specialist piscivorous N. tessellata spends more time in and around water (Speybroeck et al., 2016).
Field methods
We surveyed a total of 58 km of roads which transecting areas where the land use types characteristic to the region are well represented (Fig. 1). All roads surveyed were similar in width with two lanes and two-way traffic.
We estimated snake road mortality by counting the number of carcasses as an index of roadkill incidents, due to sampling errors not considered in the estimated rates. Surveys were conducted biweekly throughout the entire activity period (late March to early November) of snakes in 2012, 2013 and 2020. One of the authors (MS) surveyed all road sections in one direction in a one-day duration riding a bicycle with a steady speed (c. 20 km/h). Upon finding a snake carcass on the road, the surveyor recorded the specimen’s location with a GPS device (Garmin eTrex 10, accuracy ± 3 m), identified the species, measured its size (snout-vent length, SVL) and determined its sex when possible. Snake carcasses were also removed from the road to avoid multiple counting. Using literature sources (Madsen, 1983; Ciesiołkiewicz, Orłowski & Elzanowski, 2006; Borczyk, 2007; Ajtić et al., 2013) and SVL measurements, we applied a proxy age classification based on body size, where snakes were classified into three categories as juveniles (SVL <20 cm), subadults (20 cm <SVL <30 cm) or adults (SVL >30 cm), both for females and males. Although females are usually larger than males and mature at a larger size, this classification allowed us to estimate the age of snakes when sex determination was not possible due to the bad condition of carcasses (n = 87 N. natrix, n = 19 N. tessellata). We determined the sex of adult specimens by visually examining the cloacal region and inferred male sex for individuals that had a thicker tail base. We used the same age classification and sex determination for each studied species.
Analyses of temporal and spatial patterns
We divided the roads into 58 1-km-long sections and summed the number of observed snake carcasses per section per survey as primary datapoints. We used this method instead of kernel density estimation or another method with data transformation because we assumed that exact numbers in road sections might be more informative for local stakeholders when the results are presented for conservation interventions. We used the R 4.0.2. statistical environment (R Core Team, 2021) for statistical analyses and QGIS 3.18 (QGIS Development Team, 2021) for spatial analyses and visualisations.
We assessed temporal and spatial variation in road mortality by comparing the number of snake carcasses found per month and per road section. We built generalized linear mixed-effects models (GLMMs) using the ‘lme4′package of R (Bates et al., 2015), to analyse the effects of possible interactions between months and age/sex categories in the first GLMM and between road sections and age/sex categories in the second GLMM on the number of road-killed N. natrix and N. tessellata, with year as random factor. We also compared the number of snake carcasses per month to a random equal distribution across months using χ2 tests. A similar analysis for road sections was not performed due to many zeros, which violated the assumption of tests based on the χ2 distribution. χ2 tests were also used to compare whether the sex ratio of roadkilled snakes differed from unity.
To make our results comparable with other road mortality studies we calculated observed road mortality rates both temporarily and spatially by dividing the number of carcasses with the number of days in the study period (from the first day of sampling to the last day summed for the three years) and with the number of road sections for both species (Medrano-Vizcaíno et al., 2023a; Medrano-Vizcaíno et al., 2023b).
Analyses with environmental drivers of land use, flood regime and traffic intensity
To evaluate the effect of land use on snake road mortality, we used the Ecosystem Map of Hungary (Ministry of Agriculture of Hungary, 2019; Tanács et al., 2019). This map contains recent (2010-2018) data on land use types in raster format, with a cell size of 20 × 20 m. For analyses, we reduced the number of land use types from 39 to 22 by merging similar types, and types with a low, 1–2% spatial share into broader categories (e.g., Low buildings and High buildings into Buildings). We then calculated the proportion of land use types in 2-km buffer zones around the 1-km road sections. While the home range of these species might be smaller (Wisler, Hofer & Arlettaz, 2008), we chose this distance to include most of the known and suspected hibernating sites in the foothills and the foraging sites such as oxbows and canals in lower-lying areas and to include individuals that may move beyond their home ranges, e.g., during seasonal migration to/from winter hibernating and summer feeding sites. Because floods in road surrounding areas could also influence the number of road-killed snakes, we divided the road sections into two groups based on the flood regime of the neighbouring areas. Snake movement might be affected as floods maintain more wetlands which are important for Natrix species (Speybroeck et al., 2016). Thirty-six road sections were adjacent to regularly flooded areas (Fig. 1, sections 18–39 and 45–58) and 22 sections (sections 1–17 and 40–44) were surrounded on both sides by areas protected from floods by levees. To characterise traffic intensity, we obtained daily traffic volume from the website of Hungarian Public Roads (2020). Traffic data were available in 5 to 10-km sections, and one such section could cover several of our road sections. When road section borders in the traffic data fell within one road section in this study, we averaged the two values for that road section.
The Hungarian Public Roads website and the Ecosystem Map of Hungary only shows recent data, thus we assumed that land use and traffic volume did not vary significantly over the study period. Land use change in the region mostly occurred in the 1990s (Prokopová et al., 2018) and land use was rather stable in the study period (M.S., pers. obs.). To check whether traffic volume was the same between the years, we used traffic data from a 17-km road section (sections 19–35) for which data were available from 2013 and 2021. We found that traffic volume did not differ between 2013 and 2021 in these sections (t-test: t11 = 0.249, p = 0.808).
To model the effect of landscape structure on snake road mortality, we further reduced the 22 land use types into four latent variables (LV1–LV4) in a Bayesian ordination approach using the ‘boral’ package of R (Hui, 2016). Latent variables are used in a similar way as principal components from a PCA but have an advantage over them because they are not linear combinations of the original variables yet they still reduce variance inflation arising from multicollinearity among the original independent variables (Mizsei et al., 2020). For the interpretation of results, we calculated Pearson correlation coefficients between LV1-4 and the original data on the proportion of land use types. These correlations showed that LV1 represented a gradient from rural to urban habitats, with significantly negative correlations with habitats such as sessile oak-hornbeam forests, fruit plantations and arable land and significantly positive with habitats like buildings, paved roads and urban forests. Within the same logic, LV2 represented a gradient from dry to wet habitats from dirt roads, arable lands and railways (negative correlations) to rivers, riverine willow-poplar forests and mixed woodlands (positive correlations). LV3 represented a gradient from artificial to natural habitats with complex cultivation patterns, vineyards and other artificial areas (negative) to tall marsh vegetation standing in water, wet meadows with periodic flooding and lakes (positive), and LV4 was a gradient from closed (woody) to open (treeless) habitats from urban forests, urban green areas and mixed woodlands to arable land, closed mountain grasslands and lakes (Fig. 2).
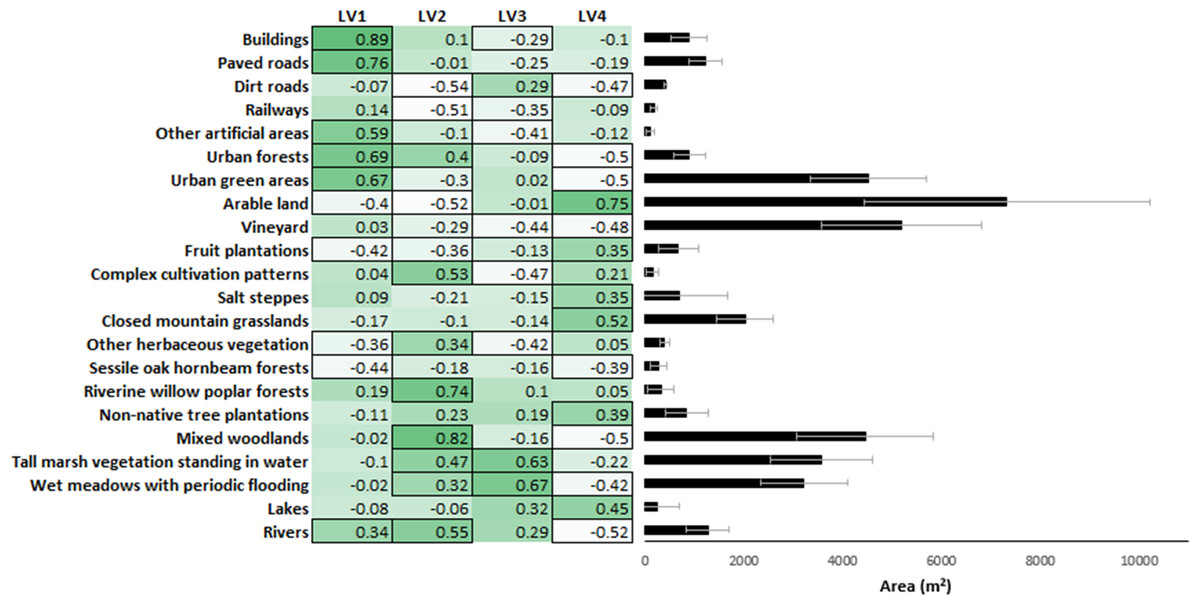
Figure 2: Correlation matrix of the 22 land use types with the four latent variables and the proportion of the land use types in the buffers.
Stronger colors indicating positive, while lighter colors indicating negative correlations. The cells that are framed indicate significant correlations.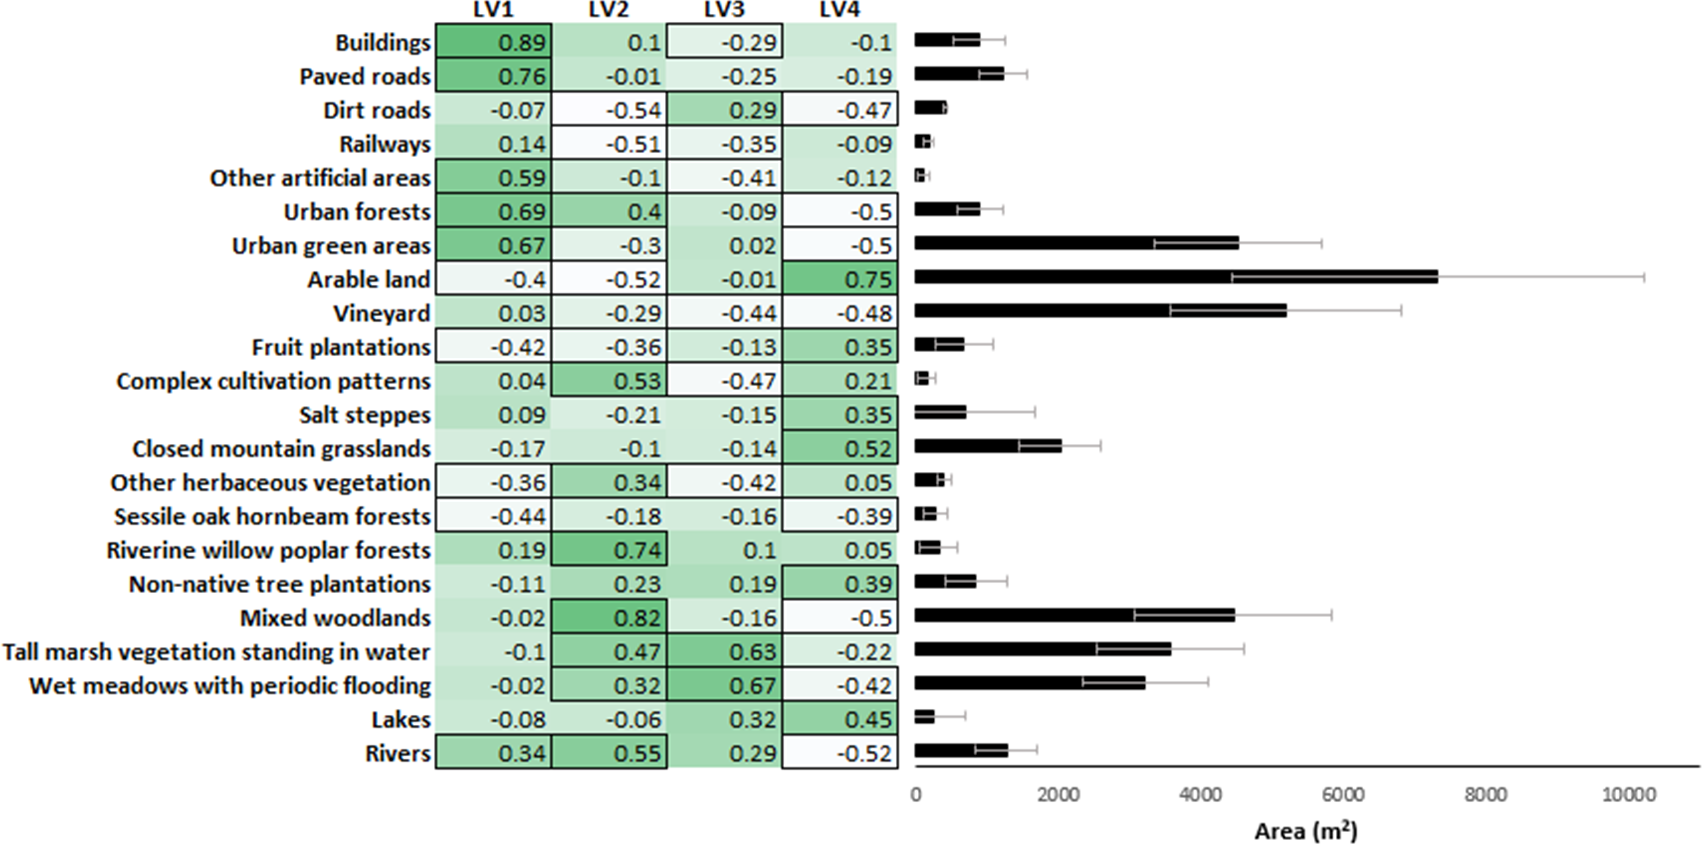
We assessed the effect of environmental drivers (landscape structure, flood regime and traffic volume) on snake road mortality by constructing a GLMM for each species using the ‘lme4′package of R. We built GLMMs with the number of individuals per section per survey as discrete dependent variable, and flood regime (flooded vs. flood-protected as binary variable), traffic volume, survey week and the four latent habitat variables (LV1-LV4) as fixed explanatory variables and by specifying Poisson error distribution with logit link function. Road section ID and survey year were used as random effects to control for spatial and temporal non-independence of road sections and survey dates, respectively. Then a model selection approach was used in an information-theoretic framework (Burnham & Anderson, 2002) to identify models with substantial empirical support based on Akaike differences (Δi = AICi –AIC min <2.0) and to find the best set of explanatory variables for the number of carcasses found in each species. After this we performed model-averaging of the best models using the ‘MuMIn’ package of R for each species (Bartoń, 2019). When either of the LVs was significant in the averaged model, simple linear regressions were conducted to evaluate which land use type had direct positive or negative effect on the number of road-killed snakes. In these analyses, we only tested variables that showed the three strongest correlations with the number of road-killed snakes either in the positive or the negative direction (Fig. 2), and we adjusted significance levels for multiple comparisons by the False Discovery Rate method (Benjamini & Hochberg, 1995).
Results
Numbers of road-killed snakes
We found a total of 1,715 carcasses of snakes: 1,441 belonged to Natrix natrix, 214 to Natrix tessellata, 45 to Zamenis longissimus, 14 to Coronella austriaca and one was Vipera berus. Because sample sizes were low for the latter three species, we restricted statistical analyses to N. natrix and N. tessellata.
Temporal patterns
By visual examination we identified two peaks in the number of carcasses found (Fig. 3A), which differed significantly from a random equal distribution across the months (N. natrix: χ2 = 790.45, df = 8, p < 0.0001; N. tessellata: χ2 = 137.93, df = 8, p < 0.0001). For N. natrix, the first peak was in May and June, and the second was in September and October (Figs. 3B and 3D), whereas for N. tessellata, the first peak was between March and May, and the second from July to September (Figs. 3C and 3E).
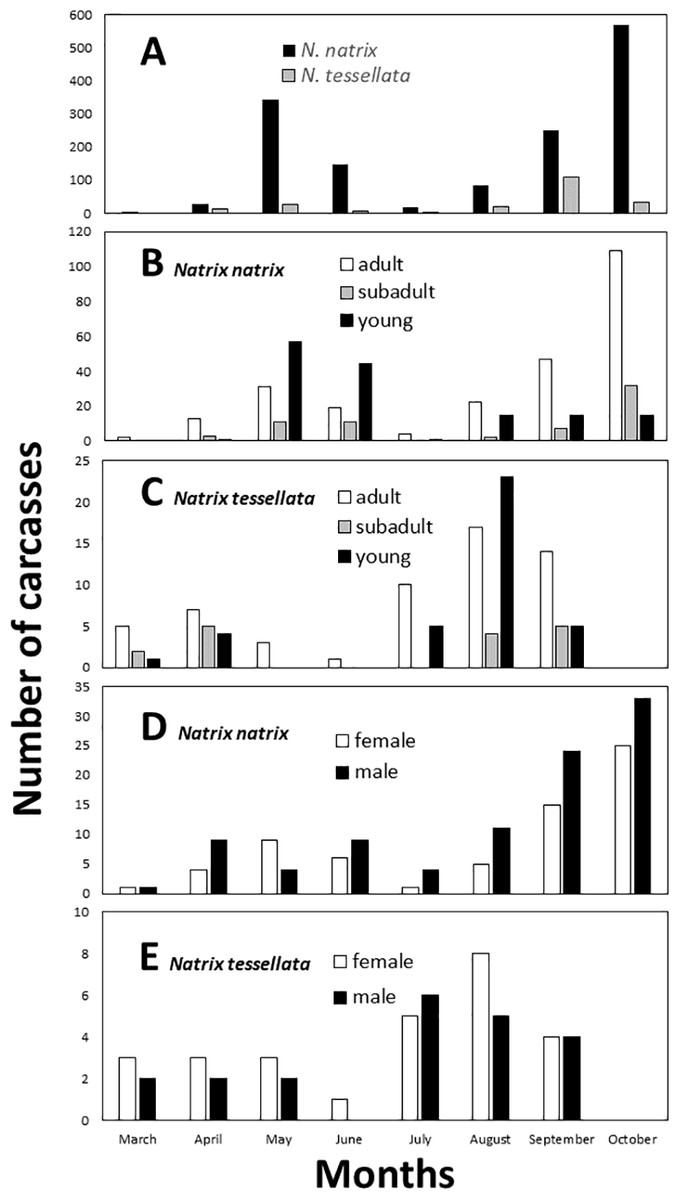
Figure 3: Temporal patterns of roadkilled snakes.
Natrix natrix and N. tessellata overall (A), age categories of N. natrix (B) and N. tessellata (C), sexes of N. natrix (D) and N. tessellata (E). Please note different ranges on Y axes. In (A), the number of carcasses (20) from November were summed together with October.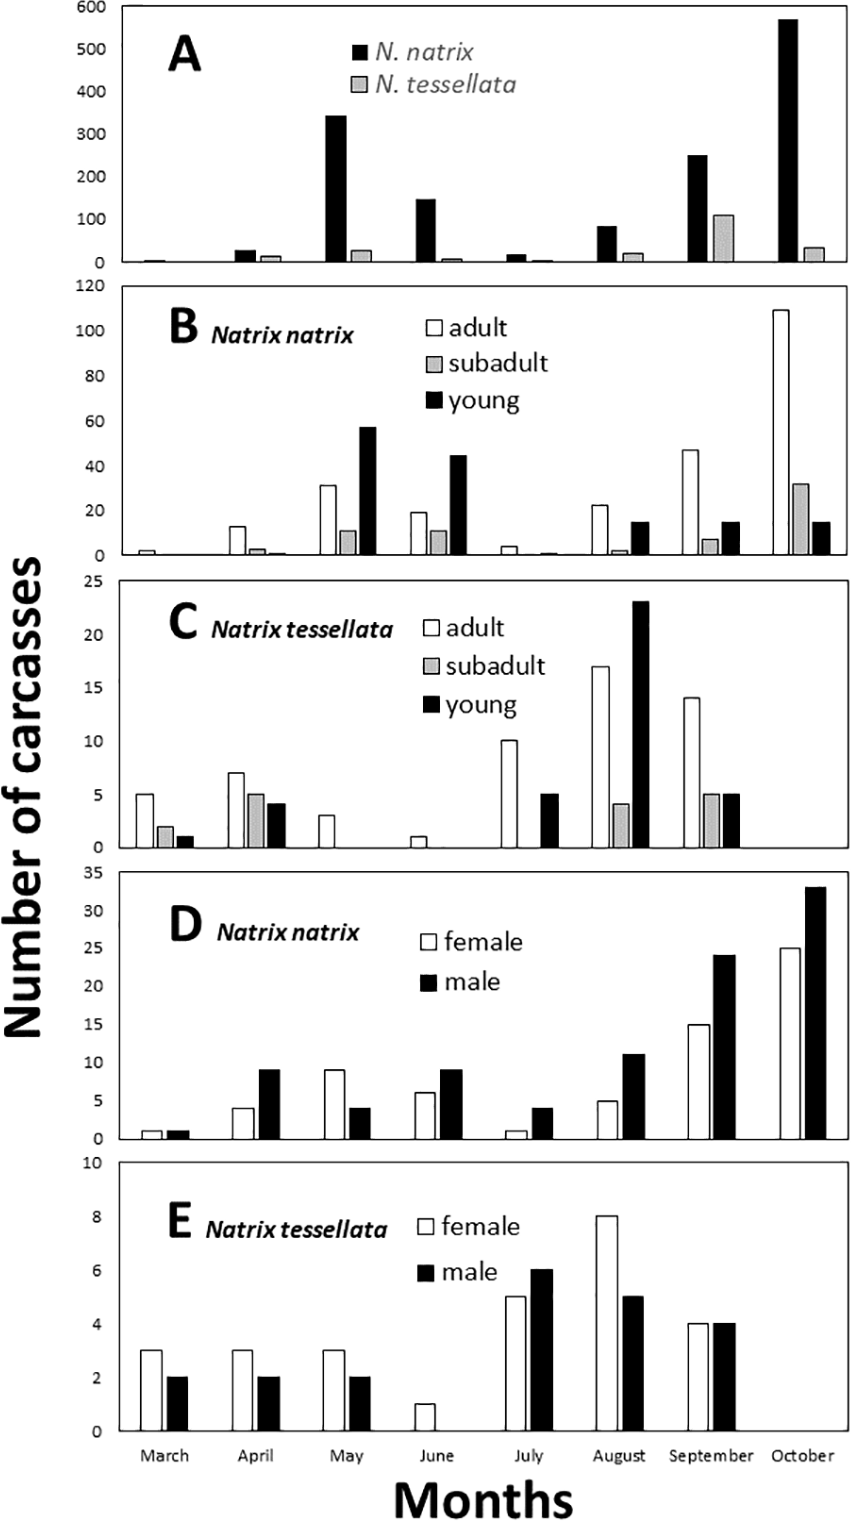
It was possible to measure the length and to assess the age of 461 roadkilled individuals of N. natrix (247 adults, 66 subadults, 148 juveniles) and 111 individuals of N. tessellata (57 adults, 16 subadults, 38 juveniles). Road mortality did not influence either the age categories (GLMM, N. natrix, F3,20 = 2.58, p = 0.082; N. tessellata, F3,17 = 1.153, p = 0.356) or sex (N. natrix, F2,21 = 2.902, p = 0.077; N. tessellata, F2,18 = 0.611, p = 0.554) of the carcasses (Figs. 3B–3E). Within adults, sex ratio was 1:1.42 females to males in N. natrix and 1.3:1 females to males in N. tessellata, which did not differ from unity (N. natrix: χ2 = 2.469, df = 1, p = 0.116; N. tessellata: χ2 = 0.689, df = 1, p = 0.540).
The total number of days in the study period was 605, observed mortality rate per day (roadkilled individuals/days in the study period) was 2.382 for N. natrix and 0.354 for N. tessellata.
Spatial patterns
The number of snake carcasses in the 1-km sections ranged from 0 to 202 in N. natrix and 0 to 53 in N. tessellata. The number of carcasses found suggested large differences among the sections and was significantly different from a random, i.e., equal, distribution of carcasses in road sections in both species (N. natrix: χ2 = 956.21, p < 0.0001; N. tessellata: χ2 = 69.5, p < 0.0001) (Fig. 4A).
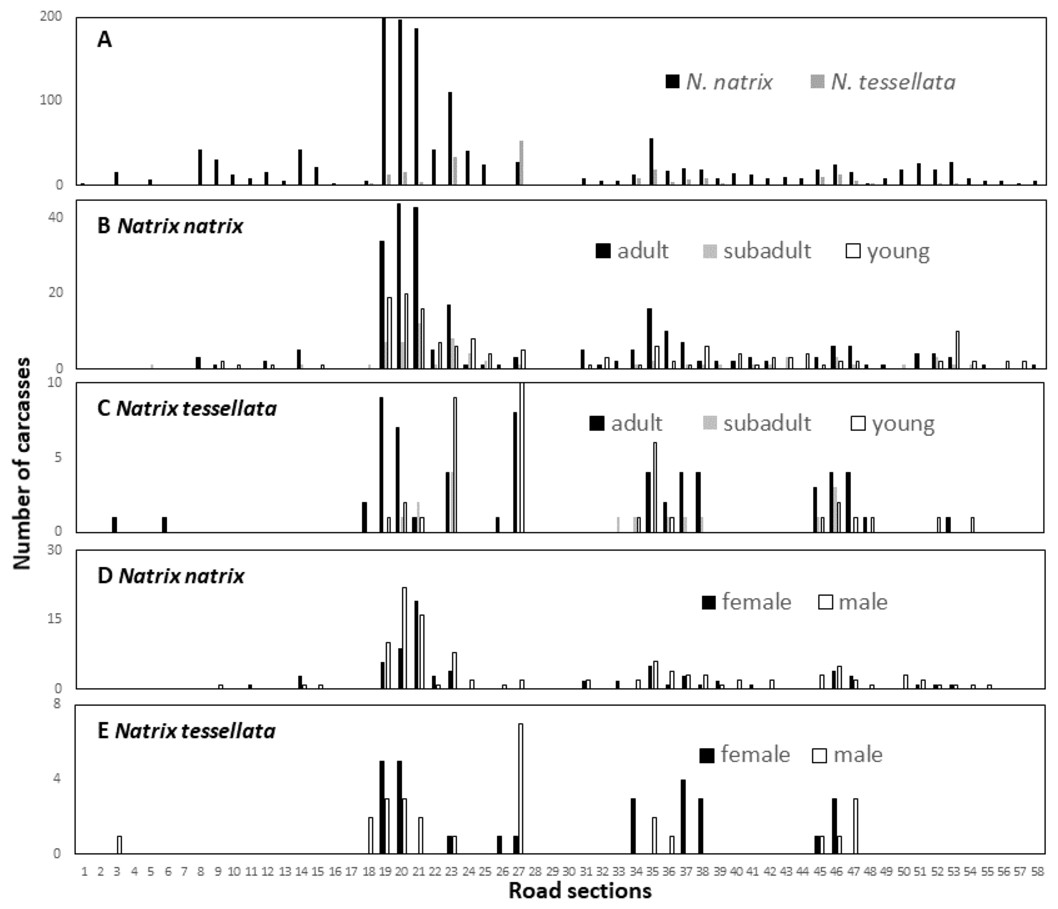
Figure 4: Spatial patterns of roadkilled snakes.
Natrix natrix and N. tessellata overall (A), age categories of N. natrix (B) and N. tessellata (C), sexes of N. natrix (D) and N. tessellata (E). Please note different ranges on Y axes.
We recorded particularly high numbers of carcasses of both species between road sections 18 and 24, and in sections 27 (highest number for N. tessellata), and 35 (Fig. 4A). Road mortality did not influence either the age categories (Figs. 4B–4C; GLMM, N. natrix, F2,226 = 1.508, p = 0.224; N. tessellata, F2,102 = 0.884, p = 0.416) or sex (Figs. 4D–4E; N. natrix, F2,112 = 0.757, p = 0.386; N. tessellata, F1,68 = 0.094, p = 0.761) of the individuals indicating that risk of mortality was similar regardless of age category and sex on all sections (Figs. 4B–4E).
Observed road mortality rate per sections (divided by the 58 1-km sections) was 24.845 for N. natrix and 3.69 for N. tessellata. Observed mortality rate per sections per day was 0.041 for N. natrix and 0.006 for N. tessellata.
Environmental drivers of road mortality
The GLMM models suggested that the number of roadkilled N. natrix was significantly positively influenced by the closed to open LV4 and week of the year, and significantly negatively affected by the dry to wet LV2 and the artificial to natural LV3, while flood regime, traffic volume and the rural to urban LV1 had no effect (Table 1). The number of roadkilled N. tessellata was significantly positively influenced by flood regime and week of the year, and significantly negatively affected by traffic volume (Table 1). We did not find significant relationships with any of the latent variables.
| Natrix natrix | Estimate | SE | z | p |
|---|---|---|---|---|
| (Intercept) | −3.3404 | 0.4122 | 8.1020 | <0.0001 |
| Flood regime | 0.8407 | 0.4484 | 1.8742 | 0.0609 |
| LV1 | −0.1577 | 0.1775 | 0.8880 | 0.3745 |
| LV2 | −0.5504 | 0.2387 | 2.3045 | 0.0212 |
| LV3 | −0.6824 | 0.2319 | 2.9418 | 0.0033 |
| LV4 | 0.5879 | 0.2399 | 2.4496 | 0.0143 |
| Week | 0.0460 | 0.0030 | 15.1594 | <0.0001 |
| Traffic volume | −0.0001 | <0.0001 | 0.2885 | 0.7729 |
| Natrix tessellata | ||||
| (Intercept) | −8.1240 | 1.1672 | 6.9573 | <0.0001 |
| Flood regime | 3.9010 | 1.0260 | 3.8004 | 0.0001 |
| LV2 | −0.7070 | 0.4141 | 1.7063 | 0.0879 |
| LV3 | −0.2007 | 0.4669 | 0.4297 | 0.6675 |
| LV4 | 0.3999 | 0.3728 | 1.0724 | 0.2835 |
| Week | 0.0546 | 0.0082 | 6.6587 | <0.0001 |
| Traffic volume | −0.0002 | 0.0001 | 2.0336 | 0.0419 |
Notes:
Significant estimates are highlighted in bold letters.
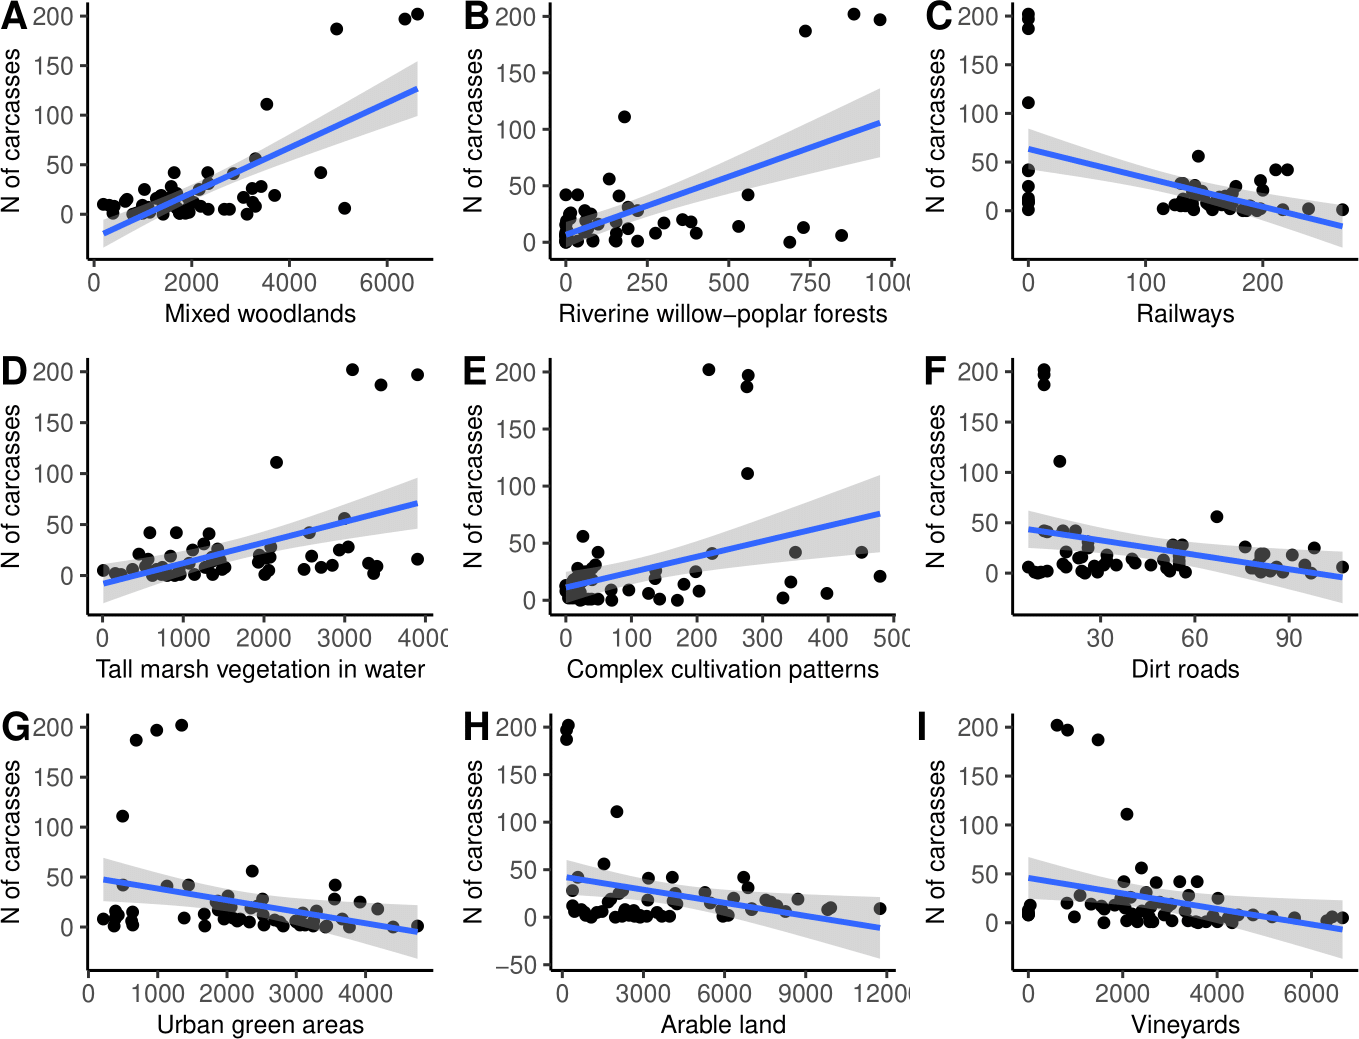
Finally, the simple linear regression analysis suggested that the number of N. natrix carcasses found was positively influenced by the area of mixed woodlands, riverine willow-poplar forests, tall marsh vegetation standing in water, and complex cultivation patterns, and negatively affected by the area of railways, dirt roads, urban green areas, arable lands, and vineyards (Fig. 5, Table 2).
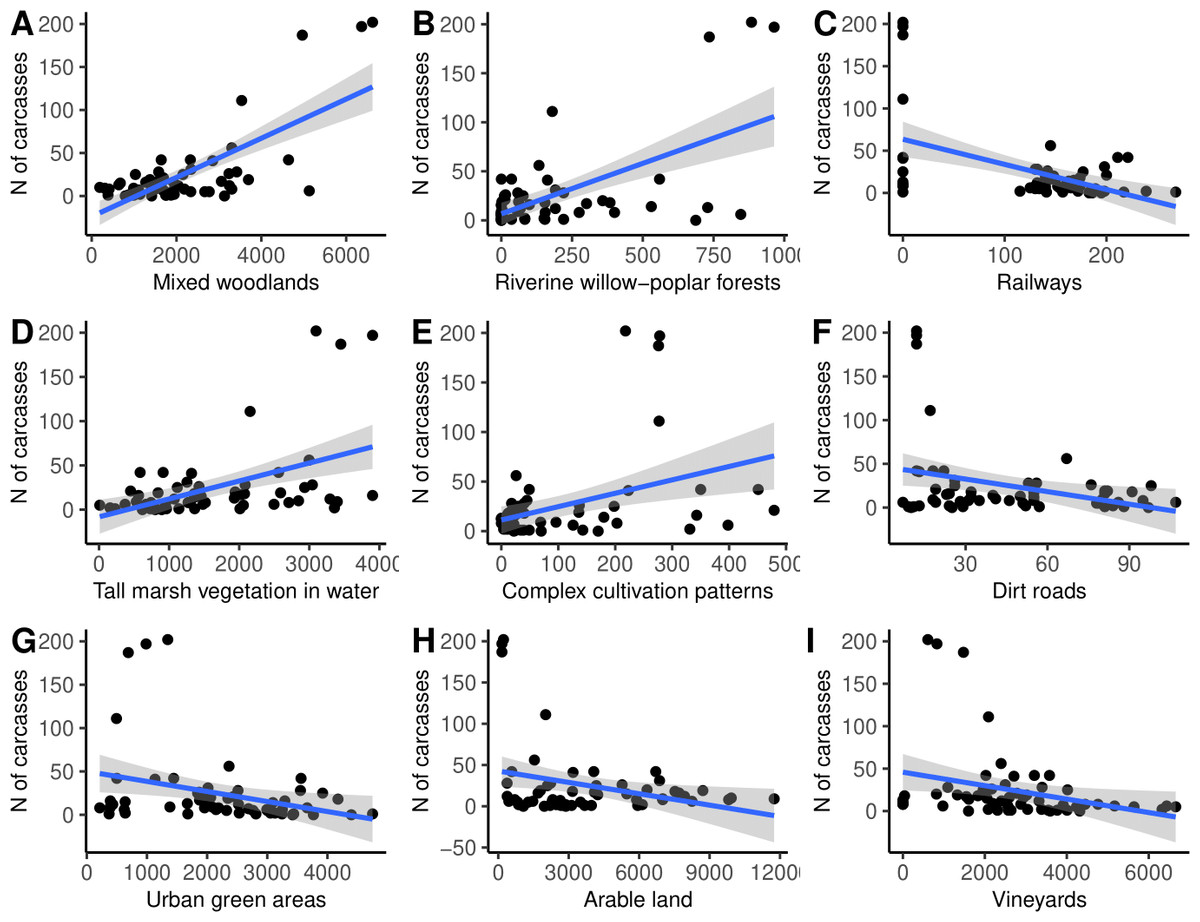
Figure 5: (A–I) The number of roadkilled Natrix natrix as a function of the area of different land use types in 2-km buffer areas along road sections.
| Habitat type | Coefficient | Std error | r2 | t | Padjusted |
|---|---|---|---|---|---|
| Mixed woodlands | 0.718 | 2.933 | 0.516 | 7.726 | 0.001 |
| Riverine willow-poplar forests | 0.599 | 0.622 | 0.358 | 5.592 | 0.001 |
| Railways | −0.494 | 0.193 | 0.244 | 4.246 | 0.001 |
| Tall marsh vegetation standing in water | 0.477 | 2.759 | 0.227 | 4.056 | 0.001 |
| Complex cultivation patterns | 0.392 | 0.357 | 0.154 | 3.189 | 0.007 |
| Dirt roads | −0.320 | 0.085 | 0.102 | 2.523 | 0.036 |
| Urban green areas | −0.310 | 3.405 | 0.096 | 2.444 | 0.038 |
| Arable land | −0.302 | 8.376 | 0.091 | 2.370 | 0.040 |
| Vineyards | −0.293 | 4.730 | 0.086 | 2.295 | 0.043 |
| Rivers | 0.257 | 1.249 | 0.066 | 1.990 | 0.077 |
| Wet meadows with periodic flooding | 0.228 | 2.613 | 0.052 | 1.748 | 0.117 |
| Urban forests | 0.139 | 0.981 | 0.019 | 1.049 | 0.374 |
| Closed mountain grasslands | −0.105 | 1.691 | 0.011 | 0.792 | 0.498 |
| Lakes | −0.085 | 1.337 | 0.007 | 0.640 | 0.562 |
| Other artificial areas | −0.072 | 0.288 | 0.005 | 0.542 | 0.590 |
Discussion
This study provided two key results:
•The number of carcasses of both Natrix species were confined to specific time and space intervals. Numbers peaked in the spring and in the autumn in each year with certain road sections containing more N. natrix carcasses than others.
•These differences mainly arose because of the higher percentages of snakes in sections surrounded by more natural land use types and lower in sections surrounded by urban or agricultural areas. Observed road mortality rates in this study were lower compared to two investigations conducted in climatically similar study sites on Natrix species (Ciesiołkiewicz, Orłowski & Elzanowski, 2006 in S Poland; Anđelković and Bogdanović 2022 in N Serbia); however, we monitored a larger area which can predominantly influence the results (58 km versus 1.8 and 4.2 km respectively), as the aim was to monitor road sections with different observed road mortality rates to make meaningful comparisons about the factors affecting mortality patterns.
It is important to note that the number of snake carcasses found should be considered as a minimum estimate and thus snake mortality is likely to be much higher than reported here (Barrientos et al., 2018). First, the biweekly monitoring interval enabled us to obtain an index of road mortality across months and road sections but was insufficient to estimate absolute numbers. In a study in southern Portugal Santos, Carvalho & Mira (2011) found that most snake carcasses disappeared from the road after one day on average and that very few remained there for a maximum of 14 days. If we accept that carcasses disappear from the road in one day, our biweekly survey would enable us to locate carcasses of snakes killed by cars on the day before the survey. The number of road-killed snakes could be up to 14 times higher (c. 24,000 snakes in three years) than found in our biweekly survey. Secondly, observer efficiency in detecting snake carcasses can also limit the number of carcasses recorded during the surveys (Barrientos et al., 2018). For instance, carcasses varied in size from 120 to 720 mm SVL, and smaller carcasses could have been more difficult to find. We aimed to minimise the latter source of error by riding a bicycle, as opposed to driving a car at low speed, as typically done in most roadkill surveys. Observer efficiency during riding a bicycle is likely to be closer to surveying the road on foot, which can detect 12 to 16 times more roadkill than surveys while driving a car (Slater, 2002).
The monthly variation in the number of roadkilled snakes can be explained in conjunction with such as hibernation and foraging. The spring peak in the number of carcasses is likely related to the end of the hibernating period, when snakes migrate to their lower altitude foraging grounds in rivers and wetlands, and the autumn peak is related to their migration from the feeding areas to higher altitude foothill areas used as hibernating sites (Fig. 3). Similar monthly patterns, with higher mortality in spring and autumn and limited mortality in summer also occur elsewhere in Central Europe in Natrix species (Heigl et al., 2017; Anđelković & Bogdanović, 2022). Such movements, when individuals move larger distances when compared to their usual daily movements in the active season, are known in several snake species living in temperate areas (e.g., for Thamnophis sirtalis, Gregory & Stewart, 2011 or Agkistrodon piscivorus, Glaudas et al., 2007). Changes in body temperatures in reptiles fluctuates alongside with environmental temperature, thus they need to hibernate to maintain their life functions in cold climates (Ultsch, 1989). The availability of ideal hibernating sites or hibernacula in par can also be more limited with increasing latitudes (Rudolph et al., 2007). The temporal patterns in the number of carcasses were similar in both species, suggesting that road mortality is predominantly mediated by the movement of snakes in and out of hibernacula, and not by activities related to reproduction such as mate-searching in males, egg laying in females, or the dispersal of juveniles as in these cases one would expect mortality patterns skewed towards particular age or sex categories (Bonnet, Naulleau & Shine, 1999). Unfortunately, there is scarce information about the hibernation preferences of Natrix species and European Colubrids as a whole. Our limited number of field observations suggest that both species hibernate in sites (soil and rock pits) well above the flood water level. Floods on rivers Bodrog and Tisza regularly occur at the end of winter and early spring when snow melts in the catchment area, and when temperature is too low for snakes to emerge. Therefore, snakes need to find hibernacula well above the flood water level as in the closely related species from the North American genus Nerodia, in which individuals abandon flooded hibernacula (Ultsch, 1989).
The number of roadkilled N. natrix was significantly affected by land use surrounding the road, as it was positively related to a gradient from closed to open and negatively related to gradients from dry to wet and from artificial to natural land use types (Table 1). Surprisingly, the analyses of latent variables indicated fewer roadkilled snakes on roads running through wetter and more natural land use types in general, as opposed to our expectation that more snakes are killed on roads bordered by more natural land use types. This apparently also contradicts the results from the simple linear regressions where we found that more natural land use types such as riverine willow-poplar forests or Tall marsh vegetation standing in water positively influenced the number of carcasses, while more artificial types such as arable land or urban green areas indicated an opposite response. The differences can be explained in three ways. First, N. natrix is a rather generalist species (Reading & Jofré, 2009), which can occur in many different habitats. Second, a large proportion of the studied landscape is modified by human activities, with many areas converted to arable land or vineyards (Figs. 1 and 2), thus it is not surprising that the proportion of these two land use types fundamentally influenced our calculations. Finally, it is also possible that snakes find their habitats easier in road sections surrounded by wetter and more natural land use types than in sections surrounded by drier and more artificial land use types, where they may spend more time on the road, increasing roadkill risk. Alternatively, the higher number of snake carcasses in drier areas may also be explained if snakes use the road for thermoregulation (Mccardle & Fontenot, 2016). However, this is unlikely since we have never observed snakes basking on or near the road during our surveys and because there are also plenty of microsites available for basking (rocks, wood logs, open areas near treelines etc.) farther from the road. Overall, our results on spatial patterns support the view that the local presence and/or the proximity of natural land use types near the road, largely influenced the road mortality of water snakes at the road-section scale. We found no such effects on the number of roadkilled N. tessellata individuals; however, the number of carcasses in this species was also confined to specific road sections (Fig. 4B), suggesting that the lack of significant effects of neighbouring habitat is likely due to low sample size. The number of carcasses of this species had a negative relationship with traffic volume, indicating more carcasses in less busy road sections which might be an artefact resulting from low sample size. Such a negative relationship is very rare and might be answered by factors other than traffic intensity (Mazerolle, 2004).
Conservation Implications
Because wetlands are abundant in the studied landscape, road mortality of water snakes could occur in several places, yet fortunately mortality was low in most of the road sections. However, there are a few road sections where road mortality is a serious conservation concern (Fig. 4). Our minimum estimate of the maximum number of roadkilled N. natrix in a section was 202 but this number can be in the hundreds annually. These results were useful in identifying the sections where conservation interventions should be implemented.
There are sections outside of towns (sections 21–23, 35 Figs. 1 and 4) where underneath culvert passages with barrier walls under the road could be a feasible solution to reduce snake mortality (Dodd, Barichivich & Smith, 2004). However, it is important that these are designed properly, e.g., wide enough to be used by snakes or other animals because a passage itself is no guarantee that animals will use it (Baxter-Gilbert et al., 2015). Other sections of concern are located in towns (sections 19-20, 24-25, 27 Figs. 1 and 4), for example, those with the highest mortality in the study are located within the city limits of Tokaj (section 19). Although they are located in a green urban space, there are several buildings, pedestrian crossings, parking lots and other elements which, in our view, makes it very difficult to construct such road features. Our suggestion is to build one or a series of artificial hibernacula to provide migrating snakes shelter farther from the road. Snakes often occur in or near artificial structures and such hibernacula are used as a conservation tool to provide additional shelter (Zappalorti et al., 2014). We are aware of two hibernacula on the floodplain side of the road, but well above the stream level, which are predominantly used by a few hundred N. tessellata individuals but N. natrix and Zamenis longissimus also occur in them. In addition, one of the hibernaculas is artificial, as it is made from illegally disposed debris of building materials and other household litter, indicating that these snakes are capable of occupying such novel structures. Artificial snake hibernaculas are usually made from logs and stones covered with soil thick enough to prevent snakes from freezing (Zappalorti et al., 2014). We are not aware of such an intervention to prevent road mortality, but there is evidence that artificial nesting sites can reduce road mortality for freshwater turtles (Paterson, Steinberg & Litzgus, 2013).