
Glycyrrhizic acid Poly(D,L-lactide-co-glycolide) nanoparticles: anti-aging cosmeceutical formulation for topical applications
- Published
- Accepted
- Received
- Academic Editor
- Jui-Yang Lai
- Subject Areas
- Bioengineering, Computational Biology, Toxicology, Dermatology, Drugs and Devices
- Keywords
- Glycyrrhizic acid, Nanoparticles, PLGA, Genotoxicity, Cytotoxicity, Molecular docking, MD
- Copyright
- © 2022 Cetin Aluc et al.
- Licence
- This is an open access article distributed under the terms of the Creative Commons Attribution License, which permits unrestricted use, distribution, reproduction and adaptation in any medium and for any purpose provided that it is properly attributed. For attribution, the original author(s), title, publication source (PeerJ) and either DOI or URL of the article must be cited.
- Cite this article
- 2022. Glycyrrhizic acid Poly(D,L-lactide-co-glycolide) nanoparticles: anti-aging cosmeceutical formulation for topical applications. PeerJ 10:e14139 https://doi.org/10.7717/peerj.14139
Abstract
Glycyrrhizic acid (GA) is one of the components of licorice roots (Glycyrrhiza glabra L.). GA is a triterpenoid saponin can be used as a medicinal plant with its antiallergic, antiviral, anti-inflammatory, anti-ulcer, hepatoprotective, anticancer, anti-oxidation activities and several other therapeutic properties. The aim of this study is to develop an anti-aging formulation for topical application containing GA. In this context, GA-loaded Poly (D,L-lactide-co-glycolide) (PLGA) nanoparticles (NPs) were prepared using the double emulsion method, and were characterized by various spectroscopic methods. The efficacy of GA-PLGA NPs was evaluated with in vitro and in silico methods. The encapsulation efficiency and loading capacity were calculated. The in vitro release study was conducted, and the GA release profile was determined. The genotoxic activity of GA and GA-PLGA NPs was evaluated by the Ames test using TA98 and TA100 mutant strains of Salmonella typhimurium. The cytotoxic potential of GA-PLGA NPs was evaluated on the HaCaT cell line using the MTT assay. According to the genotoxicity and cytotoxicity results, it was found that the GA-PLGA NP formulation did not exhibit genotoxic and cytotoxic effects. Moreover, the efficacy of GA in preventing UVB-induced photo-aging in HaCaT cells and the clarification of the molecular mechanism of GA binding to MMPs were revealed by molecular docking analysis. In addition, through molecular dynamics (MD) analysis, the binding interaction of GA with MMPs in a dynamic system, and protein-ligand stability were predicted as a result of 50 ns MD simulation studies considering various analysis parameters. Finally, it was evaluated that GA-PLGA nanoformulation might be used as an alternative anti-aging skin care product candidate via topical application.
Introduction
Skin aging is a natural process that increases over time for humans. Ultraviolet rays (UV) are the most important cause of exogenous aging, which play an important role in skin aging. Skin cells that are overexposed in UVB are stimulated to produce reactive oxygen species (ROS), which causes oxidative stress (Chen et al., 2019b). In the oxidative stress environment, the redox balance is disturbed and the proteins, DNA and lipids in the body are damaged, and this triggers photo-aging (Averilla, Oh & Kim, 2019). In photo-aged skin, connective tissue is damaged and the disruption of the structural integrity of the extracellular matrix (ECM) can be observed (Yang et al., 2019). The ECM includes structural proteins such as collagen and elastin; these are responsible for maintaining the elasticity and hydration ability of the skin (Park et al., 2018). However, changes in ECM composition occur in photo-aged skin, which is attributed to the high expression of matrix metalloproteinases (MMPs) (Hwang, 2010). MMPs are zinc-containing endopeptidases and they mediate the degradation of different components of the extracellular matrix. MMPs play an important role in the process of skin photo-aging, and they are divided into three dominant main groups (Krusinska et al., 2018), namely collagenases (MMP-1, -8, -13, and -18), gelatinases (MMP-2 and MMP-9) and stromelysins (MMP-3, -10, -11, and -19). In this study, for molecular docking analysis, we choose one MMP from each of the three groups, such as MMP-1 which is the predominant of collagenases group, MMP-3 for stromelysins group and MMP-9 for gelatinases group of MMPs (Gentile & Garcovich, 2021; Kim et al., 2022). UVB induces excessive production of ROS, causing a high level of MMPs expression, thus it causes degradation of the collagen and inhibition of procollagen synthesis (Xiao et al., 2020; Krusinska et al., 2018).
In the aging process, there is no balance between reactive oxygen species (ROS) and antioxidants in the body; this is called oxidative stress and is accepted as a key player in the aging process. That is why the absence of endogenous antioxidant defenses leads to oxidative damage by free radicals to cellular macromolecules such as DNA, lipids and protein, cause to aging and degenerative diseases (Luceri et al., 2018; Liu et al., 2018). Endogenously generated or externally supplied antioxidants can alleviate oxidative stress by scavenging ROS, and reduce the oxidation process in cell (Masaki, 2010). Using anti-oxidants orally or topically is commonly used to provide prevention of extrinsic aging (Kohl et al., 2011; Baumann, 2007).
Glycyrrhiza glabra L. extracts and its constituents exhibit a great variety of activities in cosmetic and dermatologic products thanks to its some properties such as protecting the skin against oxidative stress injuries, accelerating wound epithelization, reducing the symptoms of atopic dermatitis (Baumann, 2007). Also, it has been proven that Glycyrrhiza glabra has such an antioxidant power that can fix aging changes such as fine lines, loss of elasticity and wrinkles (Hooda, 2015). Research has proven that GA exhibits antiallergic, antiviral, and anti-inflammatory, anti-ulcer, hepatoprotective (Ming & Yin, 2013), anticancer, anti-oxidation activities and several other therapeutic properties (Selyutina & Polyakov, 2019; Tian et al., 2019). In a study, researchers showed that the free radical scavenging activity of GA was 85.96% at the concentration of 120 μM (Kaur et al., 2012). In another study, it was reported that supramolecular complexes of GA and carotenoids were found to exhibit scavenging activity against hydroperoxyl radicals, which is 10 times stronger than that of carotenoids alone (Polyakov et al., 2006). GA increases the permeability of cell membrane and active ingredient penetration. GA has low toxicity, enhances absorption of hydrophobic drugs orally (Ming & Yin, 2013; Jin et al., 2020; Li et al., 2014). Ahmad et al. (2020) have found that the intranasal administration of enhanced chitosan-coated GA-loaded-poly(ε-caprolactone)-NPs, together with the UPLC-MS/MS method, increased the bioavailability of the drug in the rat brain. As a result of the study, it was observed that cerebral ischemia can be effectively treated with GA-NPs, and the toxicity studies have shown that the optimized nanoformulation is safe. Chauhan, Gulati & Nagaich (2019) have formulated a hydrogel containing glycyrrhizic acid loaded transfersomes effective against atopic dermatitis. The release profile revealed that the formulated transfersomes release the drug for a long time with high drug accumulation on the skin. In vivo studies have shown that the GA-trans loaded hydrogel has a therapeutic effect on the treatment of atopic dermatitis.
In recent years, designing products as nanoformulations has come to the forefront in cosmetic applications such as skin whitening, anti-wrinkle and anti-aging. With the nanoformulations, the excipient can achieve the target regions as a stable form and maintain the pharmacological effect (Tsujimoto et al., 2004; Tsujimoto & Hara, 2018). The use of nanoparticles in cosmetics production provides some advantages, such as the controlled release of active substances, improved skin penetration, and stability compared to their traditional counterparts (Shanbhag et al., 2019; Khezri, Saeedi & Maleki Dizaj, 2018; Abbas, Kamel & El-Sayed, 2018). In the study by Heydari et al. (2017), the gamma oryzanol nanoethosomal delivery system was prepared to use for dermal application to prevent skin aging. It has been proved that an enhanced antioxidant activity and photo-protective effect of the nanoethosomal formulation with compared plain gel in dermoscopic and histological examinations. In a study, folic acid loaded nanocarriers were developed to present its controlled delivery of an anti-aging effect. The free radical scavenging capacity and hydration potential of the developed formulations revealed these formulations can be used as anti-aging formulations (Ammar et al., 2016).
Poly-lactic-co-glycolic acid (PLGA) is a well-known copolymer, and PLGA-based products are approved by FDA. Its versatility in the formulation and functionality, being biocompatible and degradable are the main features that make it preferred in drug delivery systems (Ghitman et al., 2020; Locatelli & Franchini, 2012; Roointan et al., 2018; Paul et al., 2022; Ding & Zhu, 2018; Anand et al., 2022; Alvi et al., 2022; Lopez-Cazares & Eniola-Adefeso, 2022; Chatterjee & Chanda, 2022; Pinto et al., 2022). It is known that PLGA nanoparticles are also used as nano-cosmetic formulation to improve the performance of cosmetic products. There are studies that show the skin whitening and anti-aging activities of active substance-loaded PLGA nanoparticles (Ito et al., 2013). Vieira, Derner & Lemos-Senna (2021) observed that the antioxidant potential of the carotenoid-rich Haematococcus pluvialis extract was increased in nano-encapsulation with PLGA in the dermatological formulation they developed when compared to ascorbic acid. Zhu et al. (2016) observed that quercetin loaded PLGA-TPGS nanoparticles change the low hydrophilicity of quercetin and increase its anti-UVB effect. Zeeshan et al. (2021) investigated the activity of glycyrrhizic acid-loaded polymeric nanocarriers against 5-FU-induced intestinal mucositis in inflammatory bowel disease in mice. GA-PLGA nanoparticles (GA-PLGA NPs) have showed a greater localized therapeutic effect in targeted intestinal tissues, making glycyrrhizic acid an effective candidate for alleviating intestinal mucositis with enhanced pharmacokinetics by encapsulating in a PLGA nanocarrier (Zeeshan et al., 2021). Although many biological activities of GA have been investigated in the literature, there has been no study of GA loaded PLGA nanoparticles for cosmetic application purpose.
The aim of this study is to produce and characterize the GA-PLGA NPs as a candidate for anti-aging topical applications, and evaluate the biological activity of GA-PLGA NPs via in vitro cell culture and in silico molecular docking methods. For this purpose, GA-PLGA NPs were prepared and characterized. In vitro efficacy experiments were conducted, and genotoxic activity of GA-PLGA NPs was determined by AMES test and cytotoxic potential was evaluated on HaCaT cell line by MTT test. Finally, it was predicted by using in silico molecular docking and MD analysis whether GA can resist UVB-induced photo aging in HaCaT cells.
Materials and Methods
Materials
Citric acid monohydrate (C6H8O7.H2O), D-biotin, dichloromethane (DCM) (CAS no. 75-09-2), disodium hydrogen phosphate dihydrate (Na2HPO4.2H2O), glycyrrhizic acid ammonium salt from glycyrrhiza root (licorice) (CAS no. 53956-04-0), L-histidine, magnesium chloride hexahydrate (MgCl2.6H2O), PLGA (lactide:glycolide = 50:50) (CAS no. 26780-50-7), potassium chloride (KCl), polyvinyl alcohol (PVA) (CAS no. 9002-89-5), potassium phosphate (K2HPO4), sodium ammonium phosphate tetrahydrate (NaHNH4(PO4.4H2O)) 4-nitro-o-phenylenediamine (NPD), sodium chloride (NaCl), sodium dihydrogen phosphate monohydrate (NaH2PO4.H2O), sodium hydroxide (NaOH), sulfate heptahydrate (MgSO4.7H2O), and Dulbecco’s Modified Eagle Medium (DMEM) were purchased from Sigma Aldrich (St. Louis, MO, USA). HaCaT cell line was purchased from Thermo Fisher Scientific (Waltham, MA, USA). Agar was purchased from Difco (Franklin Lakes, NJ, USA). Nutrient broth was purchased from Oxoid (Hampshire, UK). Penicillin-Streptomycin Solution and Fetal Bovine Serum (FBS) were purchased from Biological Industries (Kibbutz Beit-Haemek, Israel). 3-(4,5-Dimethylthiazol-2-yl)-2,5-Diphenyltetrazolium Bromide (MTT) was purchased from Biomatik (Ontario, Canada).
Analytical validation study of GA
Linearity, precision, accuracy, specificity and robustness were evaluated according to ICH guidelines using a UV-Vis spectrophotometer (Shimadzu UV-1280) (Guideline, 2005). Linearity was investigated using five different concentrations (20, 30, 50, 55, 60 µg/mL) of GA solutions in PBS (pH = 5.5). Study was carried out at 258.2 nm, and the calibration curve was obtained (Fig. S1) Precision (intra-day and inter-day precision) was determined by three replicates of GA solutions with known concentrations (20, 55, and 60 µg/mL). The precision of the developed method was evaluated in terms of 95% confidence interval and relative standard deviation (%RSD). For accuracy, GA solutions were determined by preparing in three different known concentrations (20, 55, and 60 µg/mL). Samples were analyzed and the concentrations were recalculated from the calibration curve. Specificity was evaluated by obtaining UV-Vis spectra of GA and blank PLGA nanoparticles. A 60 µg/mL solution of GA in PBS (pH = 5.5) was prepared. Blank PLGA was lyophilized and then dissolved in 1 mL of PBS (pH = 5.5). The stability of the GA solution was evaluated for the robustness parameter. For solution stability, the GA solution, which was prepared at a concentration of 60 µg/mL, was analyzed at 258.2 nm at 0, 24 and 48 h.
The obtained data were used to plot the calibration curve, regression equation and correlation coefficient equation were determined. The maximum absorption wavelength for GA was determined to be 258.2 nm with UV-Vis spectrophotometer (Table S1). The analytical validation study results were presented with the parameters as the selectivity (Table S2) and (Table S3), linearity, precision (Table S4), accuracy (Table S5), robustness (Table S6).
The correlation coefficient was R2 = 0.9981, and the method was linear according to ICH acceptance criteria (R2 > 0.99). It was determined slope (m) as 0.0155 from the drawn calibration curve. The intraday and interday precision results confirmed the reliability and reproducibility of the developed method where all RSDs were <2.0% (Table S4). The recovery results of GA solutions prepared for accuracy were found to be within the range of 98–102.0% (99.88–101.27%) and RSD < 2.0 (0.11–0.26) (Table S5). These results proved the accuracy of the developed spectrophotometric method. According to the results of the robustness study, it was found that the GA solution was still stable after 48 h (Table S6).
Preparation of GA-PLGA NPs
GA-PLGA NPs were prepared by using double emulsion method (Budama‐Kilinc, 2019; Gutiérrez-Valenzuela et al., 2018). Briefly, 5 mg of GA was dissolved in 1 mL water, and then added into a 2 mL DCM solution containing 20 mg of PLGA. Then, the mixture was emulsified with an ultrasonic sonicator (Bandelin Sonopuls HD2070, Germany) during 3 min at 25% of amplitude in an ice bath. One mg of PVA was dissolved in 20 mL of distilled water and added to the mixture. A second emulsification was carried by sonication during 3 min at 75% amplitude in an ice bath. After the emulsification, the DCM was evaporated by continuous stirring overnight at room temperature. GA-PLGA NPs were washed with deionized water by three centrifugation cycles (at 8,000 rpm for 30 min) using a Universal 320 R centrifuge (Hettich GmbH, Tuttlingen, Germany). Then, the nanoparticles were filtered through a 0.45 µm cellulose membrane filter. Finally, GA-PLGA NPs were are freeze-dried in freeze dryer (Biobase, Shandong, China). All experiments were performed in triplicate.
Characterization of GA-PLGA NPs
Dynamic light scattering (DLS) analysis
Average size (Z-Ave), polydispersity index (PDI), zeta potential (ZP) of the GA-PLGA NPs were determined using a Zeta Sizer Nano ZS (Malvern Instruments, UK) instrument, equipped with a 4.0 MV He-Ne laser (633 nm), operating at 25 °C. Lyophilized GA-PLGA NPs were homogeneously dissolved with distilled water (1:10 ratio), and then measured in triplicate.
Scanning electron microscopy (SEM) analysis
GA-PLGA NPs were characterized for their morphology by SEM. After the GA-PLGA NPs sample was dispersed in distilled water, it was placed in an ultrasonic bath for sonication for 45 min. Then, 100 µL of GA-PLGA-NP was dropped in the glass and dried at room temperature for 6 h. The SEM images were obtained at 10.00 kV, 20.00 KX magnification, 15.0 mm working distance with an in-lens detector.
Determination of encapsulation efficiency and loading capacity
The supernatant was removed after centrifugation of the GA-PLGA NPs, and the amount of free GA was calculated. Afterwards, the encapsulation efficiency and the loading capacity for GA-PLGA NPs were calculated using Eqs. (1) and (2), respectively.
(1)
(2)
In vitro release profile of GA-PLGA NPs
Membrane diffusion technique was used to determination of the in vitro release profile of GA-PLGA NPs (Ercin et al., 2022). The phosphate buffer (PBS) of pH = 5.5 for a release medium was used because of the pH value of human skin is between 4.1–5.8. Experiments were carried out by suspending 1 mg of loaded nanoparticles into 50 mL of PBS (Proksch, 2018). The samples were incubated at 120 rpm in a horizontal shaking water bath at 37 °C. In vitro release study was performed at time intervals 1, 2, 3, 4, 5, 12, 24 and 48 h. One mL sample was taken from the release medium and the same volume of fresh release medium was added instead. Experiments were carried out in triplicate. The samples were analyzed by UV–Vis spectrophotometer, and the amount of GA released from the GA-loaded PLGA-NPs, depending on time, was calculated by using Eq. (3).
(3)
Assessment of the genotoxic activity
Genotoxicity of GA and GA-PLGA NPs was evaluated by the Ames test using TA98 and TA100 mutant strains of Salmonella typhimurium (Maron & Ames, 1983). GA and GA-PLGA NPs were dissolved in water. GA-PLGA NPs concentrations were determined as 0.125, 0.25, 0.5, 1 mg/mL, and GA concentrations were determined according to the loading capacity value. In the experiments, ultrapure water was used as negative control. 0.1 mL of bacterial culture (1–2 × 10⁹) and the test sample were added to the top agar and poured onto the surface of the minimal glucose agar (MGA) plate after vortexing. Plates were incubated at 37 °C for 48 h. Plates for a negative control, spontaneous control and positive control TA98 (4-nitro-o-phenylenediamine) and TA100 (sodium azide) were prepared in parallel with the test samples. After incubation at 37 °C for 48 h, genotoxicity was determined by the test. The genotoxicity of the samples was evaluated by comparing the number of colonies returning on the sample plates with the number of colonies returning on the negative plates. Experiments were performed in triplicate for each sample.
Preparation of cell culture
The immortalized human keratinocyte (HaCaT) cells were incubated in DMEM supplemented with 100 U/mL penicillin-100 μg/mL streptomycin and 10% fetal bovine serum (FBS) at 37 °C in a 5% CO2 atmosphere. When the cell culture reached 80–90% confluence, it was treated with 1 mL of trypsin and centrifuged at 1,500 rpm for 5 min. The supernatant was discarded and 1 mL of medium was added to the cells in the pellet, counted with a hemocytometer and prepared for experiments.
Determination of cytotoxicity of NPs
HaCaT cells were prepared as 105 cells per 1 mL medium (89% DMEM, 10% FBS, 1% Penicillin-Streptomycin). Then, 100 µL of cell solution with a final density of 1 × 10⁴ for each well was seeded into the 96-well micro-plate and incubated for 24 h. GA and lyophilized GA-PLGA NPs were homogeneously dissolved with DMEM. Then, GA-PLGA NPs concentrations of 0.0625, 0.125, 0.25, 0.5, 1, 2, 3 and 4 mg/mL were added to the cells, and the GA concentration was determined according to the loading capacity value, in equal volumes (100 µL) to each well, and it was left to incubate for 24 h. After 24 h of incubation, the medium was replaced with 5 mg/mL MTT and incubated for 4 h. Then 100 μL of DMSO was added. The results were recorded at 570 nm with a microplate reader. The percentage of cell viability was calculated using Eq. (4) (Lee et al., 2017).
(4)
In silico molecular docking and MD analysis
The molecular structure of GA was downloaded from the PubChem database (CID:14982) (Kim et al., 2021). The collagenase-1 matrix metalloproteinase-1 (MMP-1) (pdb:966C) (Browner et al., 1999), matrix metalloproteinase-3 (MMP-3) (pdb:2JT6) (Alcaraz et al., 2007), and matrix metalloproteinase-9 (MMP-9) (pdb:5CUH) (Camodeca et al., 2016), which are a series of matrix metalloprotease (MMP) were prepared by retrieving the three-dimensional crystal structure from the RCSB protein data bank (https://www.rcsb.org/) (Burley et al., 2021). The ligand and receptors structures minimization were implemented before conducting the molecular docking analysis using the following ligand and receptors preparation. The molecular docking analysis were accomplished using the Glide SP module of Schrödinger Software Maestro version 11.4 (Friesner et al., 2004; Halgren et al., 2004; Friesner et al., 2006) to investigate the direct interactions between GA and MMP’s and also their binding affinities.
The GA-MMPs complex were taken from the docking results for dynamics study. The complexes were comparatively studied concerning their inhibition profiles and structure stabilities. Following three systems were considered for our molecular dynamics simulation studies. All MD simulations were performed using Desmond simulation package of Schrödinger program (D.E. Shaw Research, Schrödinger Release (2020-3), 2020; Release, 2017; Bowers et al., 2006). All systems were solvated using a cubic box containing a model of TIP3P water molecules and Na+ and Cl− ions were added to neutralize the net charge of the system. To maintain pressure (1 bar) and temperature (300K) NPT ensemble was applied and all systems were subjected to final MD simulations for 50 ns.
The tools provided by the Desmond simulation package of Schrödinger program were utilized to analyze different MD trajectories. Structures of the MMPs and three GA-MMPs complexes were compared by using root-mean-square deviation (RMSD) analysis. The detailed picture of the differences in residue mobility and stability within simulations were obtained from graphs of the root-mean-square fluctuations (RMSF) of Cα atoms and side chain relative to the average structure. Protein-Ligand contacts and interactions were also analyzed, and given with contact times and contact zones.
The physicochemical, pharmacokinetics, lipophilicity, water solubility and drug likeness properties of GA were predicted by Mol inspiration (https://www.molinspiration.com, Slovensky Grob, Slovakia) and SwissADME server (Daina, Michielin & Zoete, 2017). The Absorption, Distribution, Metabolism, Excretion and Toxicity (ADMET) properties were also analyzed in detail using pkCSM (Pires, Blundell & Ascher, 2015) and proTOX-II (Banerjee et al., 2018) servers.
Statistical analysis
For both the Ames and the MTT tests, the results obtained from the control and treatment groups were evaluated statistically. Differences between group mean for both test systems were evaluated with a one-way analysis of variance (one way ANOVA) using the IBM SPSS Statistics 21 package program. The significance level of the differences between the group means was determined at the p < 0.05 level with the Tukey test according to the homogeneity of the variances. The mean values are presented as ± SD.
Results and discussion
Dynamic light scattering (DLS) analysis
The double emulsion method was used for the production of GA-PLGA NP formulation intended to be used as a skin care product candidate. The double emulsion method is accepted as one of the most suitable methods for encapsulating hydrophilic drugs used in cosmetics, food and other fields. This is a technique for preparing polymeric particles that allow the controlled release of active ingredients dissolved in the inner aqueous phase. The most important function of the particles developed with this technique is considered being an internal reservoir for entrapped active substances; this can protect the trapped sensitive component against light, enzymatic degradation and oxidation (Iqbal et al., 2021).
Dynamic light scattering technique is a useful method to determine the size distribution profile of nanoparticle formulations. In this way, it is possible to predict the stability of the colloidal system (Maguire et al., 2018; Wilson & Prud’homme, 2021).
The Z-Ave, ZP and PDI values were measured. Each measurements were performed in triplicate. The results of Z-Ave, PDI and ZP values were given in Figs. 1A and 1B for blank PLGA-NPs and Figs. 1C and 1D for GA-PLGA NPs.
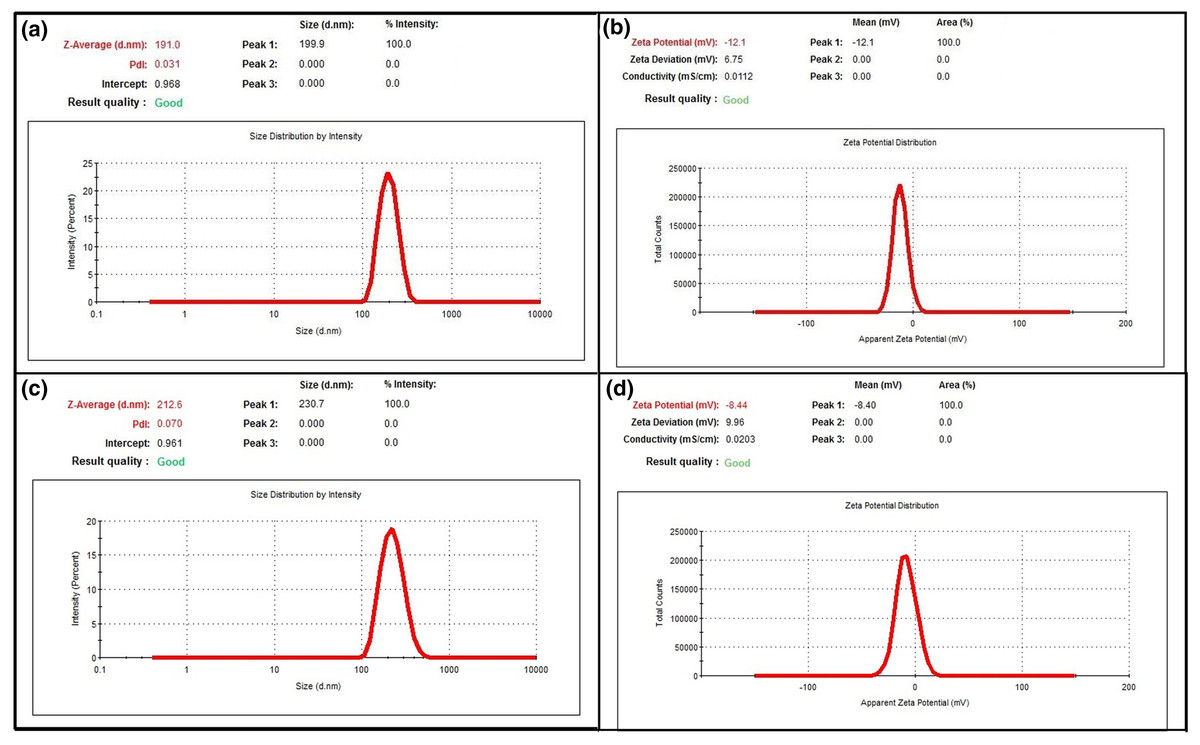
Figure 1: Results of DLS analysis.
(A) Z-Ave and PDI graph of blank PLGA-NPs (B) ZP graph of blank PLGA-NPs (C) Z-Ave and PDI graph of GA-PLGA NPs (D) ZP graph of GA-PLGA NPs.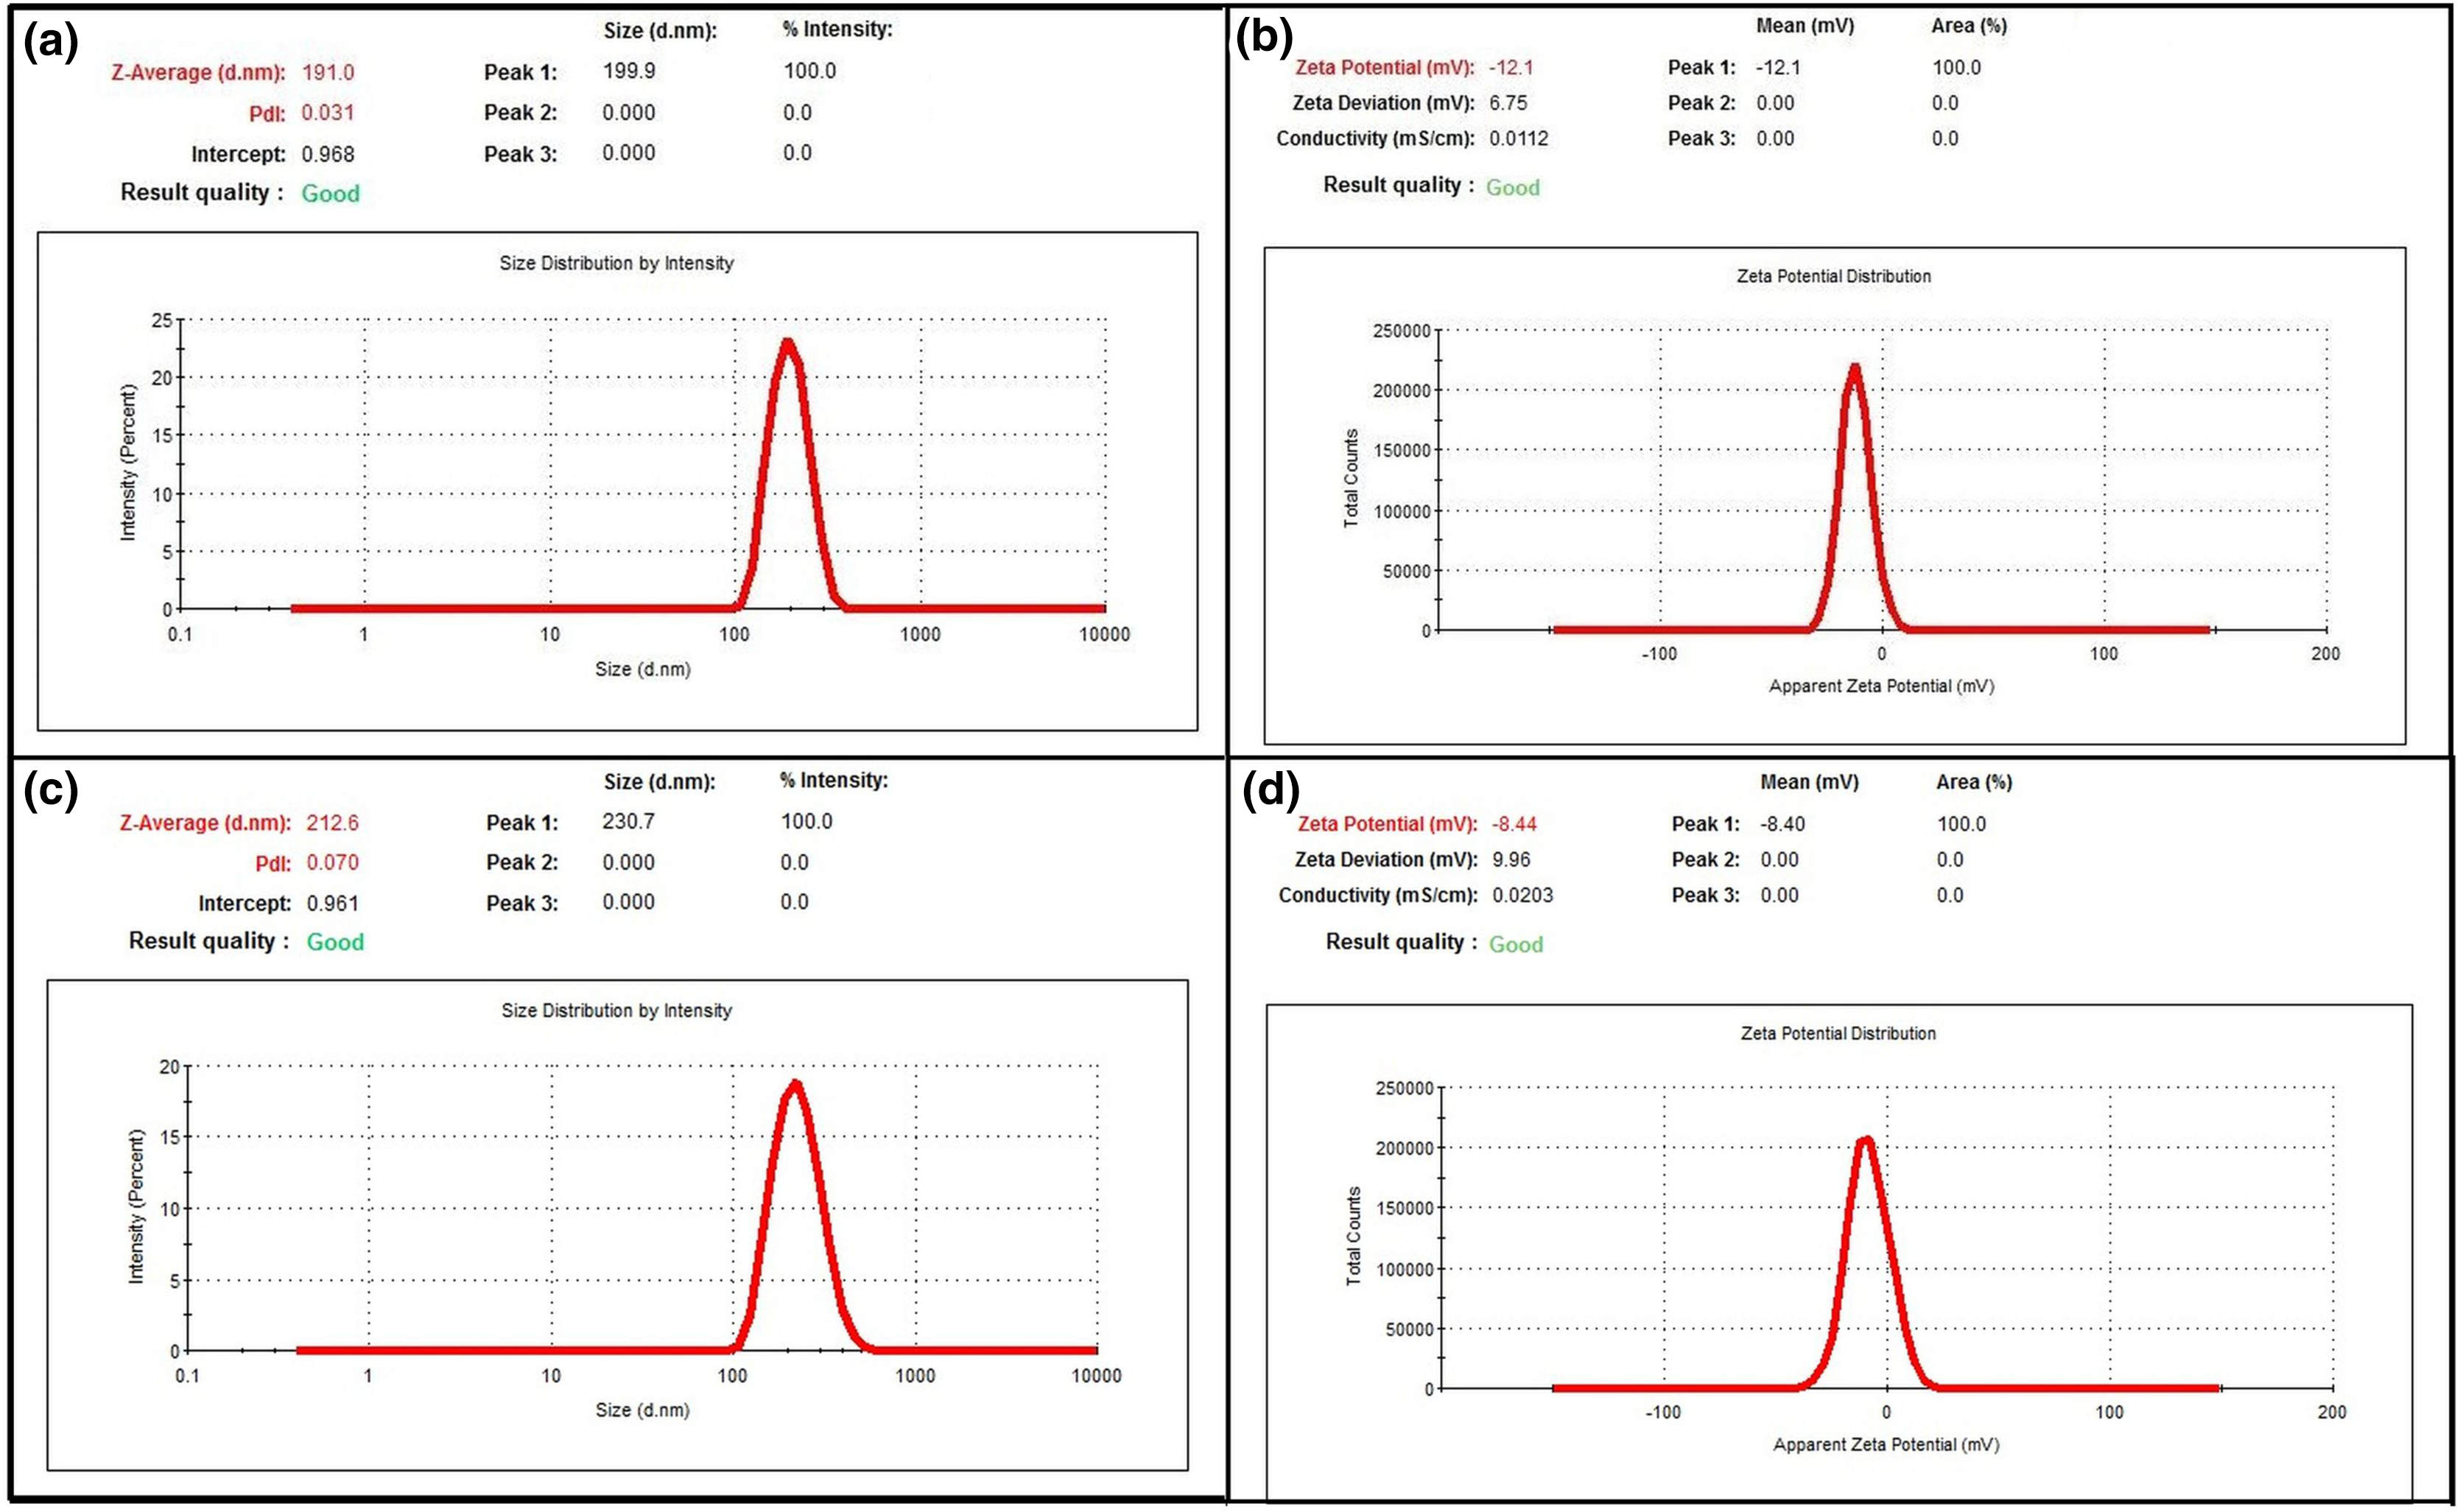
In our study, Z-Ave was observed in the range 191.0 ± 2.41 nm and 212.6 ± 2.892 nm respectively, in the blank PLGA-NPs and GA-PLGA NPs. It was determined that there was an increase of approximately 10 nm in the average nanoparticle size with GA loading. In a study, it was reported that the average particle size of blank NPs was ranged between 176.9 ± 3.7 and 217.3 ± 9.0 nm, average particle size of flurbiprofen NPs increased with the active substance loading (Şenel & Öztürk, 2019). In another study, the Z-Ave of blank PLGA NPs varied between 142.0 ± 2.6 nm and 154.4 ± 5.4 nm, whereas the Z-Ave of clarithromycin-loaded PLGA NPs varied between 178.7 ± 1.6 nm and 198.9 ± 1.5 nm (Öztürk, Yenilmez & Özarda, 2019). Ercin et al. (2022) found that Laurus nobilis L. plant extract loaded PLGA NPs were 211.4 ± 4.031 nm, while the average particles size of the blank PLGA NPs was 182.4 ± 0.499 nm. There are many studies in the literature showing that the average particle size increases after the addition of the active ingredient. This increase in particle size is thought to occur because of the interaction of the functional groups of the active substance with the polymer chains during the encapsulation process.
The PDI value refers to the distribution of size populations of particles within colloidal system. This value varies between 0.0 and 1.0, as the value increases, the size distribution of the particles shows differences, and thus a heterogeneous size distribution is observed (Anwer et al., 2019). Generally, values of 0.2 and below are acceptable for polymer-based nanoparticle materials and shows the monodispersed status (Danaei et al., 2018; Clarke, 2013). In our study, PDI was measured at 0.031 ± 0.017 and 0.070 ± 0.042 in blank PLGA-NPs and GA-PLGA NPs, respectively. These PDI values prove the nanoparticles are in monodisperse state and have a high-quality dispersion.
For a colloidally dispersed system in a liquid to be considered a stable formulation, the ZP must be in the range of +/−30 mV (Emami et al., 2015; Öztürk et al., 2020; Rigon et al., 2016). In a study, it was investigated the protective effects of quercetin-loaded PLGA-TPGS NPs against UVB-induced proinflammatory responses and oxidative damage. The ZP value of the quercetin loaded NP was determined as −17.00 ± 0.04 mV (Zhu et al., 2016). In another study, the ZP of thymol-loaded PLGA nanoparticles prepared for acne treatment was measured between −22 and −31 mV (Folle et al., 2021). Iqbal et al. (2021) were prepared quercetin and curcumin loaded PLGA nanoparticles for topical formulations. They found the ZP values were between −1.83 to −3.2 mV (Iqbal et al., 2021). In our study, ZP values of blank PLGA NPs and GA-PLGA NPs were observed as −12.10 ± 0.208 and −8.44 ± 0.525 mV, respectively.
SEM analysis
The morphology and particle size of GA-PLGA NPs were determined by SEM. In the DLS technique, the measured nanoparticle diameter is calculated by the diffusion rate of the particles, resulting in an overall larger particle size to be observed. In the SEM technique, in the particle size measurement, after the electron beam-sample interaction in the dry sample, the micrograph of the sample is obtained with the desired resolution (Egil et al., 2020; Ghanei-Motlagh & Taher, 2017; Eaton et al., 2017). From the obtained images, it was determined that the GA-PLGA NPs were homogeneously dispersed and had a smaller particle size compared to the DLS analysis results. As seen in Fig. 2, GA-PLGA NPs were found to be uniformly spherical, with sizes ranging from 104 to 150 nm.
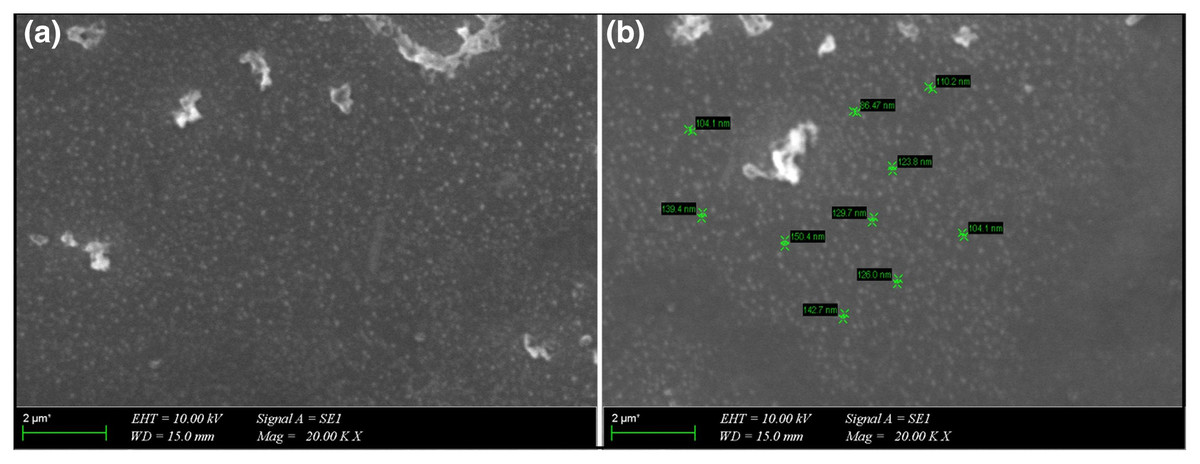
Figure 2: SEM images.
SEM images of GA-PLGA NPs. (A) Overview of GA-PLGA NPs; (B) dimensions of GA-PLGA NPs marked.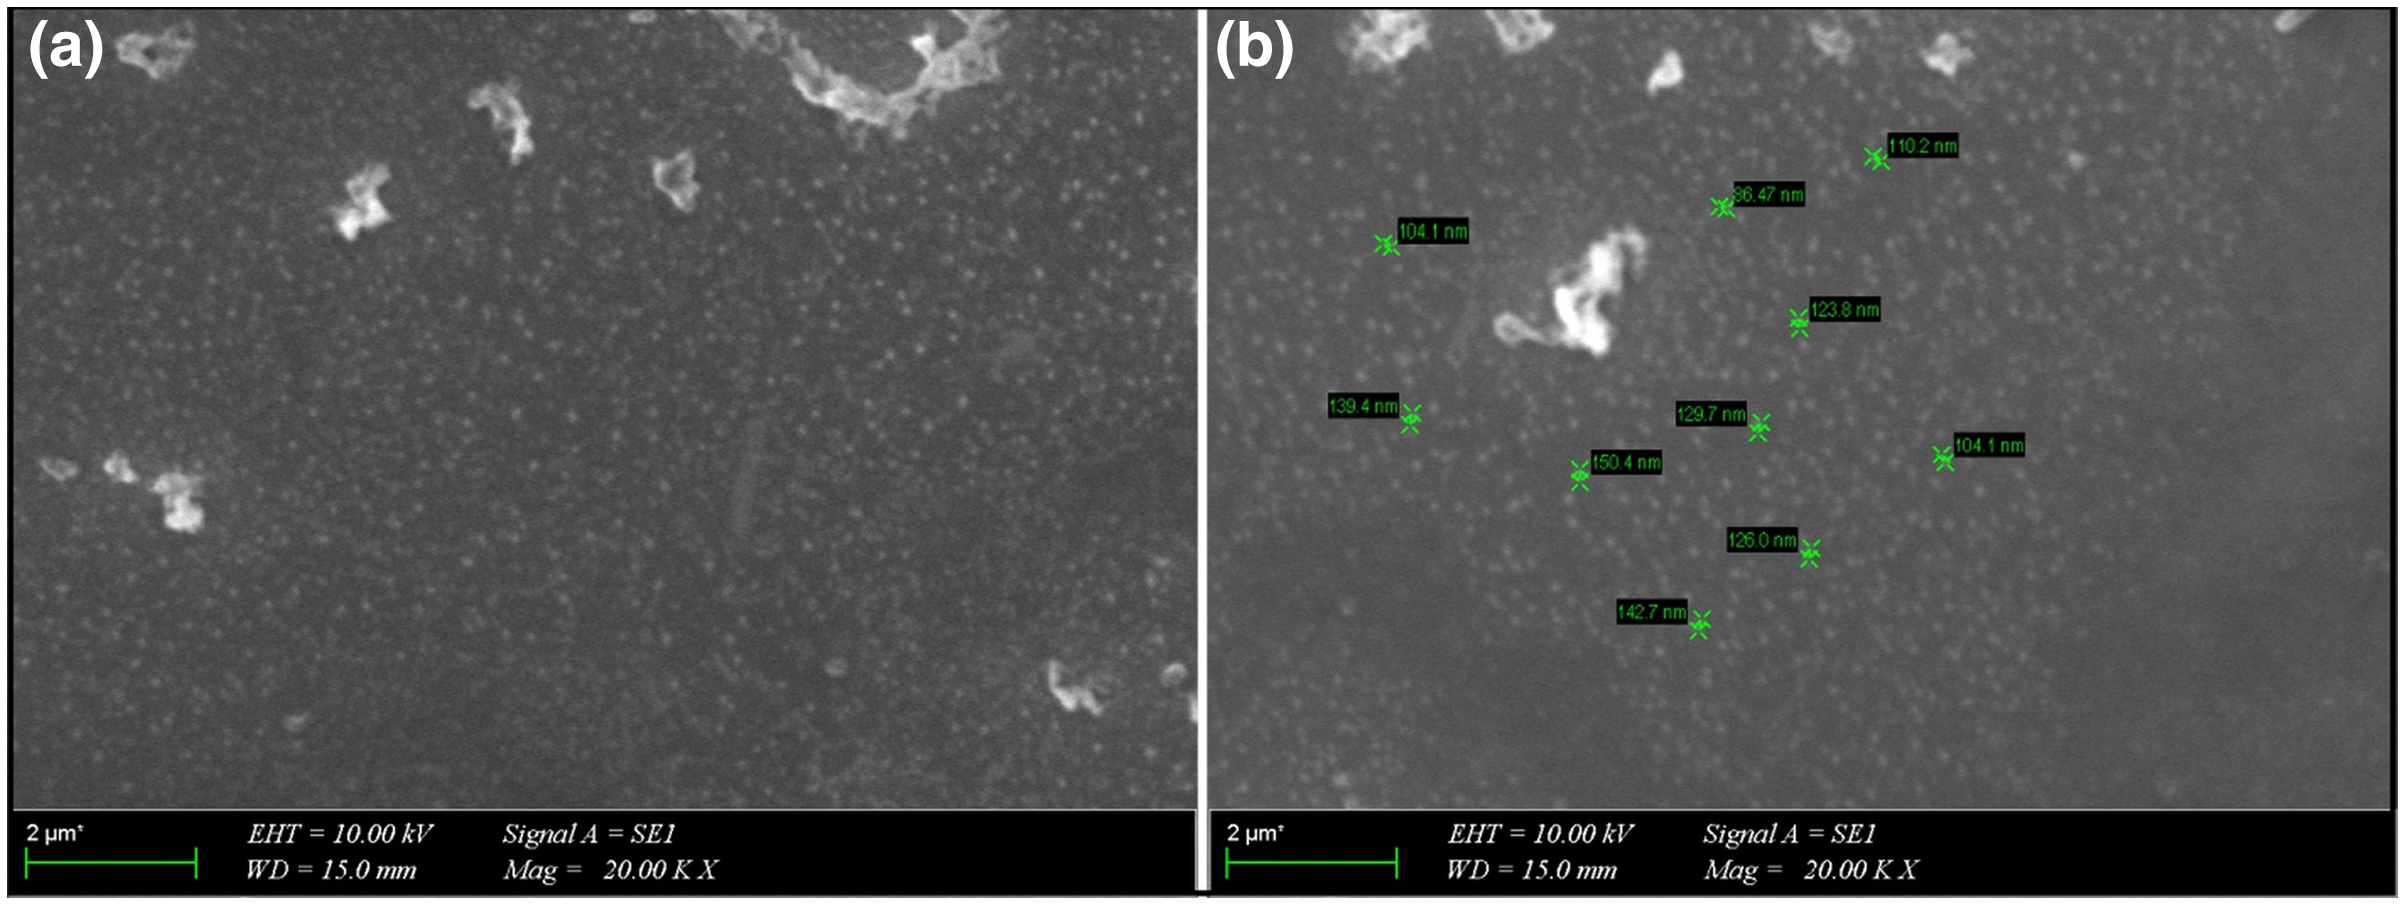
Encapsulation efficiency and loading capacity
Encapsulation efficiency and loading capacity are crucial parameters in the characterization of nanoparticles. The measurement of encapsulation efficiency gives information about the percentage of active substance trapped whilst loading capacity deals with nanoparticles after their separation from the medium to know their content (Anwer et al., 2019).
In the first step of the nanoparticle preparation, the concentration of the active substance is known. After the double emulsification process, whether an active substance is encapsulated or not can easily be determined from the supernatant of the solution with the calculation of the free active substance amount. The supernatant is removed after centrifugation of the active substance loaded nanoparticle solution, and the amount of free active substance is calculated. Afterwards, the encapsulation efficiency and the loading capacity for active substance loaded nanoparticles are determined, and these values are the evidence of the encapsulation.
In our study, the encapsulation efficiency was calculated as 81.0% (via Eq. (1)), and the loading capacity was calculated as 26.6% (via Eq. (2)), which are the parameters that prove that we placed one substance in another, successfully.
In the study, GA-PLGA NPs were prepared by double emulsion method. It was reported that the encapsulation efficiency was calculated as 67.7 ± 2.5% (Zeeshan et al., 2021). In the study of PLGA NPs prepared using two different anionic surfactants, it was calculated that the encapsulation efficiency ranged between 67 ± 2% and 26 ± 1%, while the loading capacities ranged between 0.1% and 0.7% (Santos et al., 2017). In another study on carotenoid, PLGA NPs were prepared with an emulsion solvent evaporation technique with a high encapsulation efficiency of 96.42 ± 0.73% and a loading capacity of 7.19 ± 0.12% (Hu et al., 2019). In this study, the GA molecule was successfully encapsulated with PLGA polymer. The encapsulation efficiency and loading capacity results were higher than in the literature.
In vitro release profile of GA-PLGA NPs
The in vitro release study results of GA-PLGA NPs were given in Fig. 3. According to the results, it was observed that 21.4% of GA was released within the first 5 h, 68.1% within 24 h and 96.4% within 48 h from PLGA NPs.
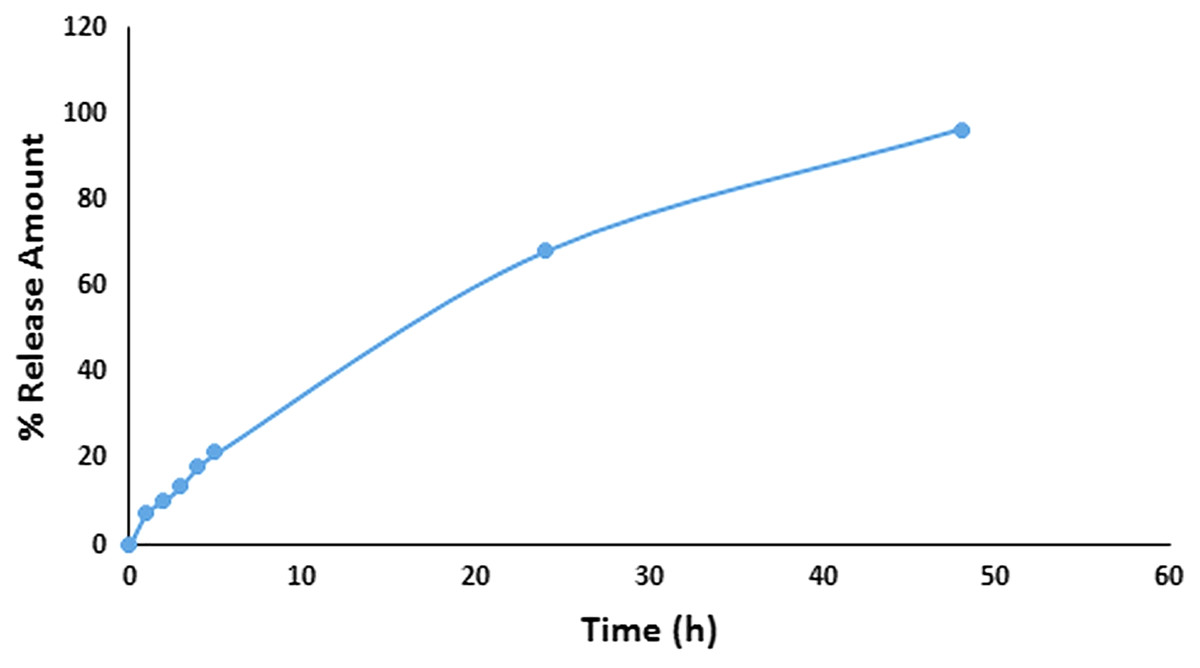
Figure 3: In vitro release study results.
In vitro release graphic of GA-PLGA NPs.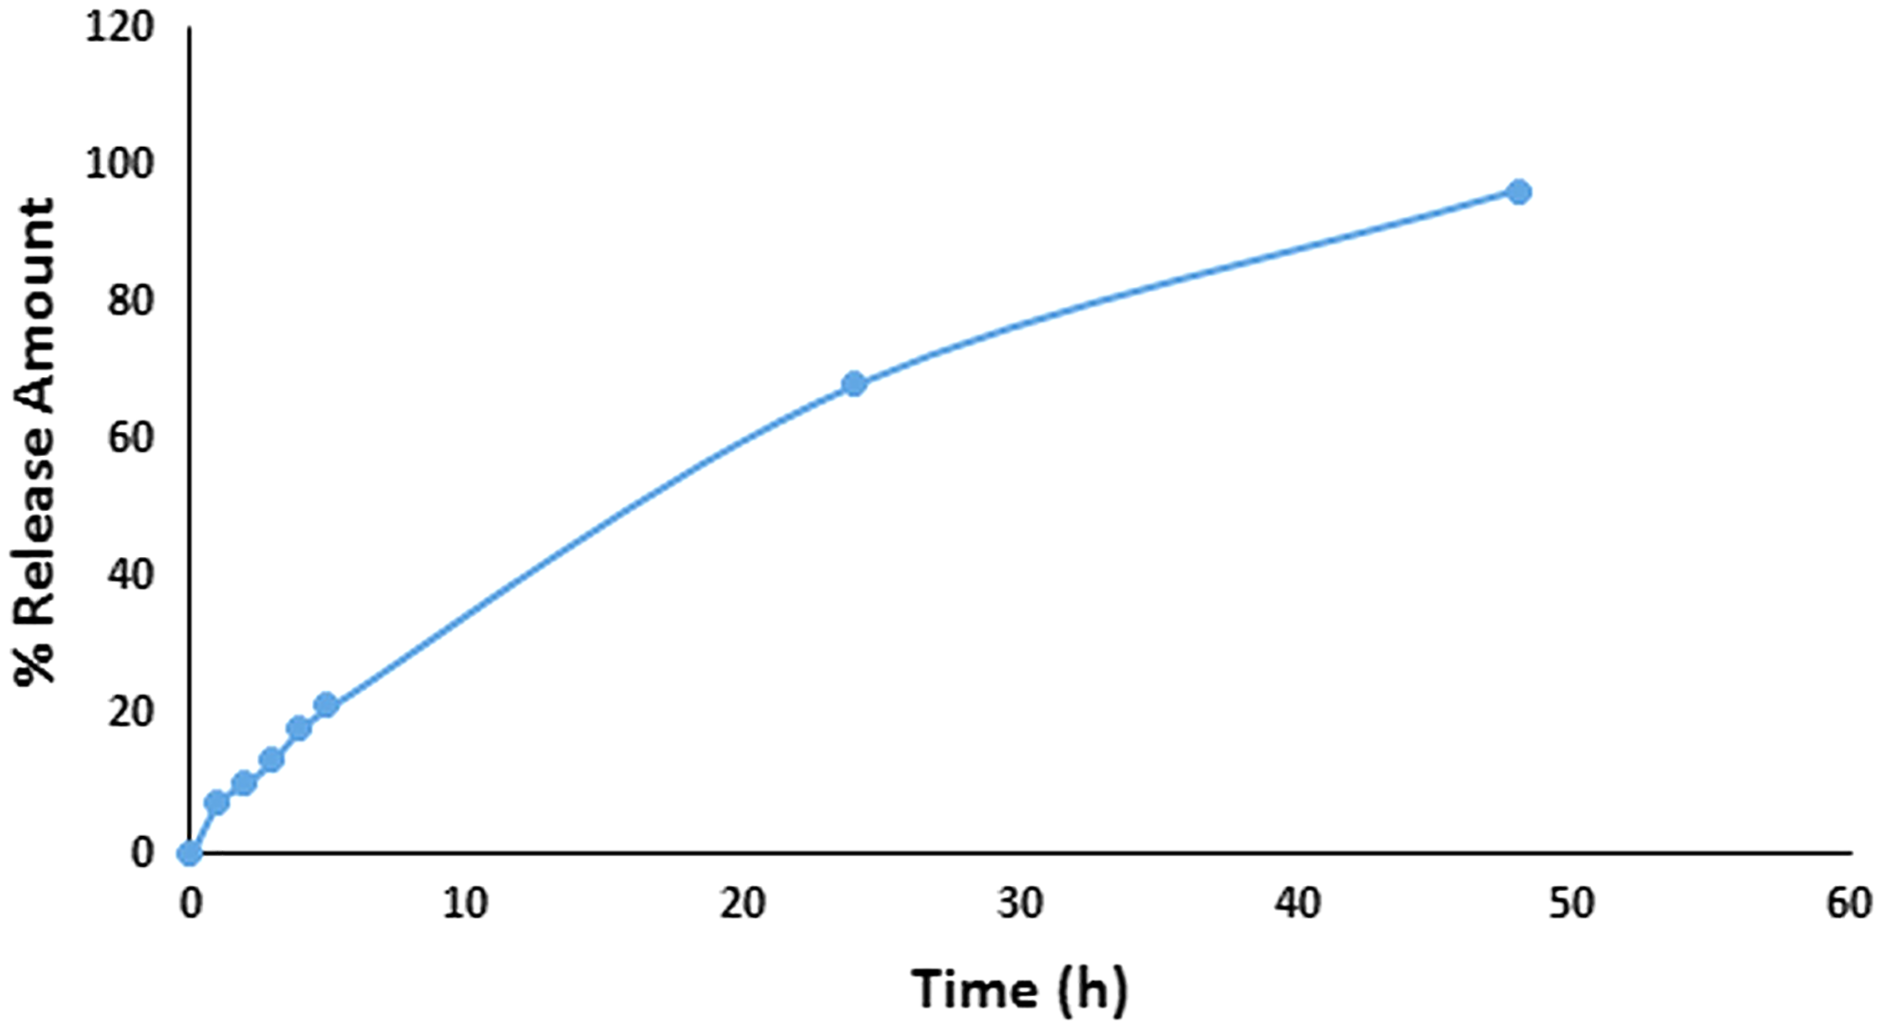
In a study, the cumulative release of quercetin PLGA NPs prepared as an alternative to skin cancer treatment, was measured to be a 77.87 ± 1.85%–79.23 ± 1.32% and 69.23 ± 1.54%–72.3 ± 1.72% for pH 5.6 and 5.5 respectively, at the end of 24 h (Gupta et al., 2016). In another study is piperine-loaded PLGA nanocomposites, specialized for targeted drug delivery for their potential use against cancer, the drug release occurred at a rate of approximately 91% at the end of 312 h at pH 5.5 (Kaur et al., 2021). The cumulative release of azelaic acid PLGA NPs prepared as an alternative to acne treatment was measured as 100% at 75 h for pH 5.5 (Reis et al., 2013). In our study, the release profile of the GA-PLGA NPs was evaluated as suitable for topical application.
Assessment of the genotoxic activity
A substance’s genotoxicity assessment is a crucial and necessary step in its development because it is related to human safety in terms of potential carcinogenesis and induction of genetic abnormalities (Ahmadi et al., 2021). The bacterial reverse mutation testing using Salmonella bacterial strain, known as the AMES test, is a rapid and simple procedure used in the chemical, cosmetic and pharmaceutical industries to identify genotoxic substances (Zeiger, 2019; Levy et al., 2019). In this study, the Ames test was performed to determine the genotoxic properties of GA-PLGA NPs using S. typhimurium TA98 and TA100 strains. AMES test was performed for GA-PLGA NPs at concentrations of 0.125, 0.25, 0.5, 1 mg/mL. The results showed that these concentrations were not genotoxic according to the method (Table S7) and the statistical analysis determined by Mortelmans & Zeiger (2000). Errico et al. (2012) developed retinyl palmitate loaded PLGA NPs for topical application and evaluated their genotoxicity with the AMES test. They reported that the nanoparticles they developed were not genotoxic (Errico et al., 2012). In another study where PLGA NPs were developed, the genotoxicity of NPs was evaluated and it was found that they were not genotoxic (Pandey et al., 2021). Huang et al. (2010) prepared poly(ε-caprolactone)-poly(ethylene glycol)-poly(ε-caprolactone) (PCL-PEG-PCL, PCEC) nanomaterials and investigated the genotoxic potentials of these nanomaterials in S. typhimurium TA97, TA98, TA100, TA102 and TA1535 strains were examined (Huang et al., 2010). The results showed that none of the strains of S. typhimurium were genotoxic. In another study where PLGA nanomaterials were developed, it was reported that the developed nanomaterial had no genotoxic effect against S. typhimurium TA 98, TA 100, TA 1535, TA 1537 strains (Krucińska et al., 2017). Our results were found to be consistent when compared with the literature.
MTT assay
The MTT test is a calorimetric test (Boncler et al., 2014), and determines the viability of cells when exposed to toxic substances. It serves as an indicator of cytotoxicity (Khasawneh et al., 2011; Sharif et al., 2017). Therefore, in our study, cytotoxicity study was performed with MTT test. In our study, the cytotoxic effects of GA and GA-PLGA NPs were evaluated in HaCaT cell line. It was given in the Fig. 4A, the cell viability value for GA-PLGA NPs started to decrease as the concentration increased. The same situation was observed in GA, whose concentrations were determined by the loading efficiency (Fig. 4B). Cell viability percentages above 80% in cytotoxicity studies are not cytotoxicity; 80–60% is considered weak cytotoxicity (Standardization, 2009). According to ISO 10993-5 evaluation, 0.5 mg/mL concentration of the GA-PLGA NPs was determined to be non-cytotoxic. Above 0.5 mg/mL concentrations of GA-PLGA NPs (1, 2, 3 and 4 mg/mL) were found to cause low toxicity (p < 0.05).
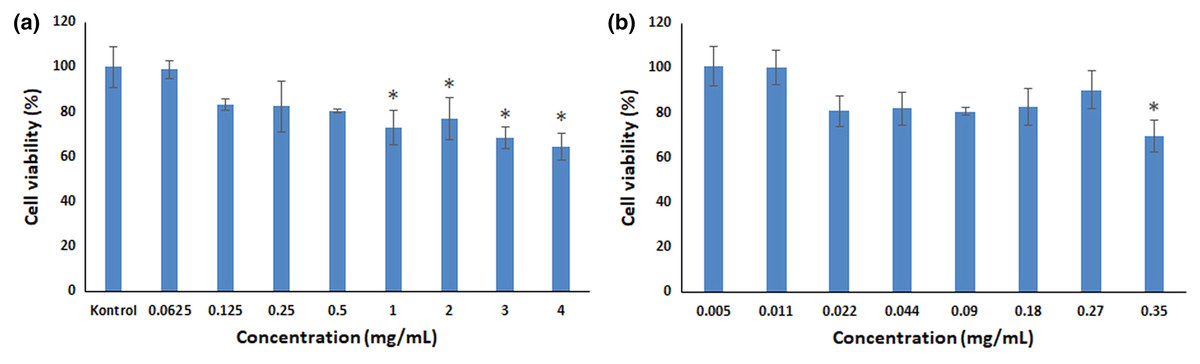
Figure 4: Cell viability results.
Cell viability analysis in HaCaT cell line (A) GA-PLGA NPs (B) GA (An asterisk (*) indicates a significant difference between control and treatment groups).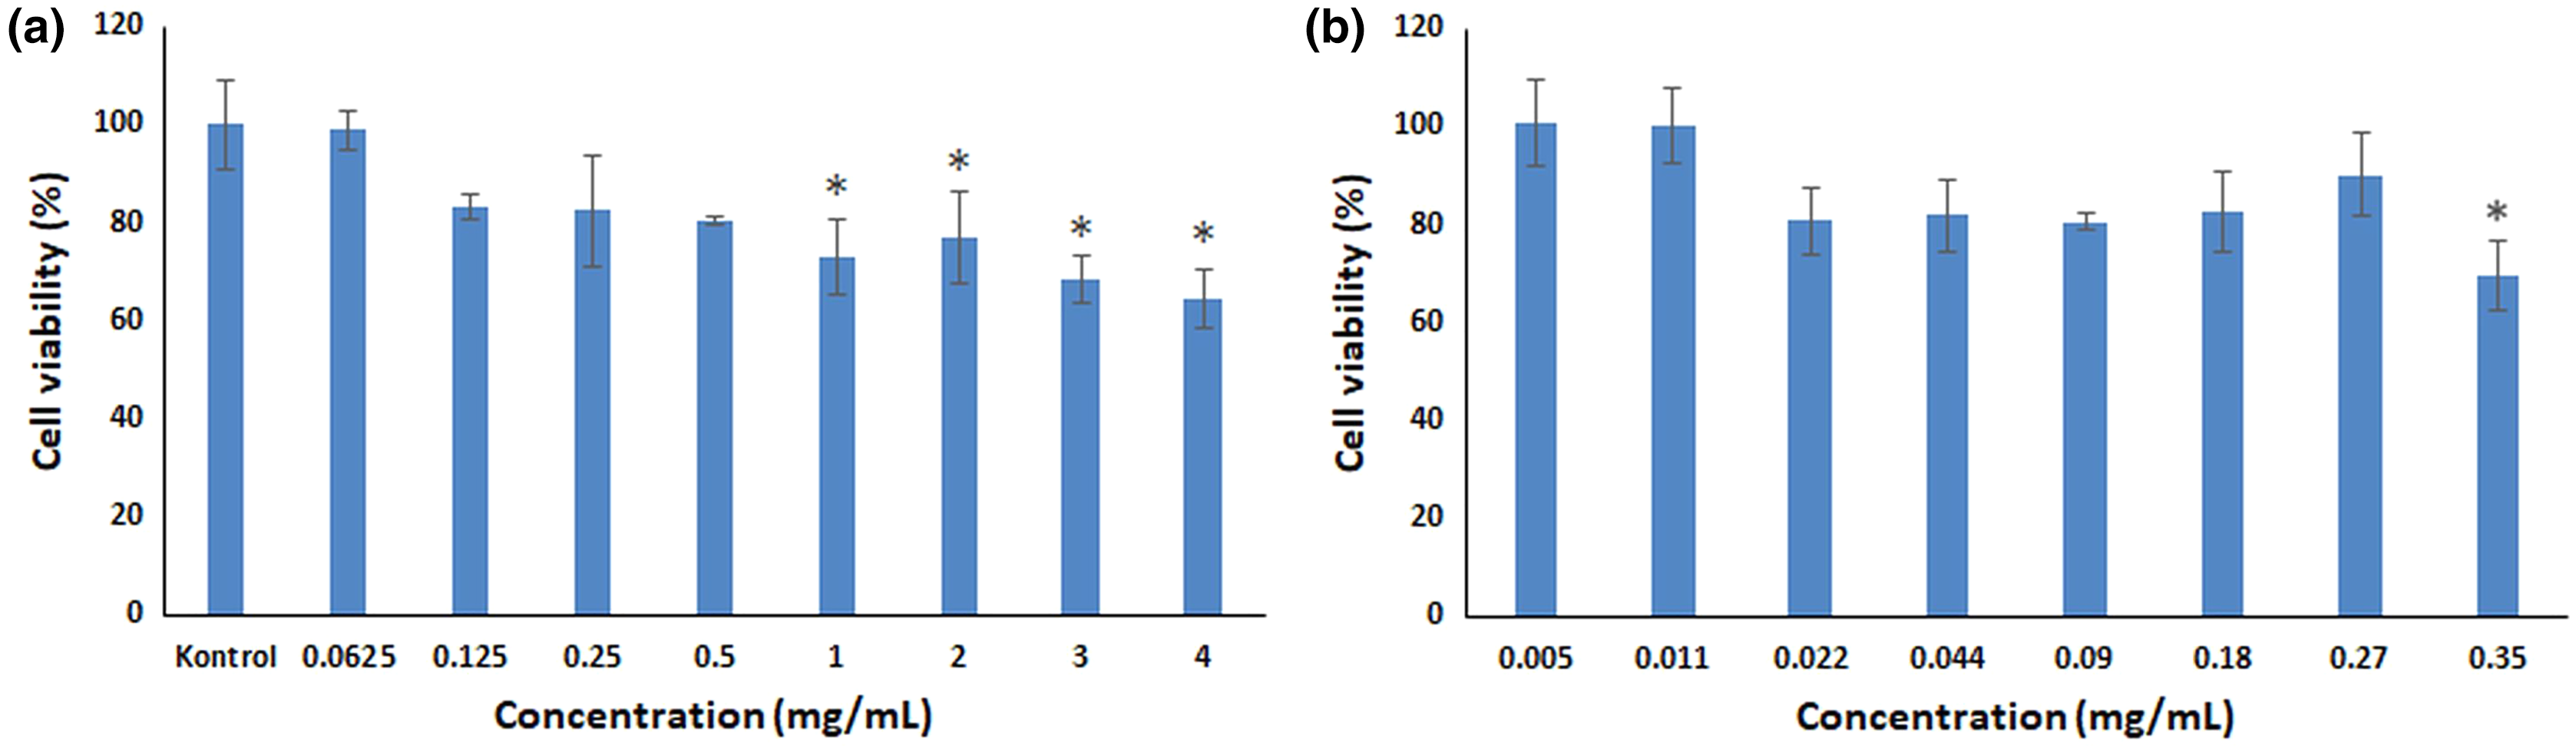
One mg/mL concentration of GA-PLGA NPs was not genotoxic for TA98 and TA100 strains (p > 0.05). However, 1 mg/mL concentration of GA-PLGA NPs had a low cytotoxic effect in MTT test compared to ISO standards and was statistically significant (p < 0.05). These differences may be due to exposure time (Ames test 48 h treatment; MTT test 24 h treatment) or Ames test prokaryotic; MTT testing may also be due to the fact that it is not a eukaryotic testing system (Sun et al., 2020).
Molecular docking, MD and ADMET results
Triggering UVB-induced excessive ROS production and increasing the number of MMPs (MMP-1, -3 and -9), which cause procollagen degradation in HaCaT cells, enabled us to accept MMPs as targets in molecular docking studies. Figure 5 and Table S8 represented docked pose of GA in the active binding sites of MMPs with probable interactions and docking score energies. The calculated docking score energy between GA and MMP-1, -3 and -9 are given −8.26, −4.57 and −8.64 kcal/mol, respectively (Table S8). All possible hydrogen bond interactions, salt bridge interactions, metal coordination interactions and aromatic hydrogen bond interactions between GA and MMP-1, -3 and -9 were tabulated in Table S8. The residues in the hydrogen bond interaction in MMP-1; ASN180 (2.04 Å), LEU181 (2.08 Å), GLU219 (1.62 Å) and TYR240 (2.41 Å). Both salt bridge interaction (2.06 Å) and metal coordination interactions (2.06 Å and 2.27 Å) occurred between the hydroxy group in GA and the O atom in the carboxyl group, and the Zn atom in MMP-1. It has been shown that there were hydrogen bond interactions between TRE and similar residues ASN180 and LEU181 located in the active binding site of MMP-1 (Krusinska et al., 2018). In another study (Chen et al., 2019a), it was revealed that the Abalone peptide performed hydrogen bond interactions with the amino acid residues such as ASN180, TYR237, THR241 and TYR240, in the binding site of MMP-1. The S1′ and S3′ pockets are crucial for MMP-1 inhibition (Yuan et al., 2013). Inhibition of MMP-1 can be achieved by docking GA into the S1′ pocket of MMP-1, including Tyr240, and S3′ pocket of MMP-1, including Asn180 residues.
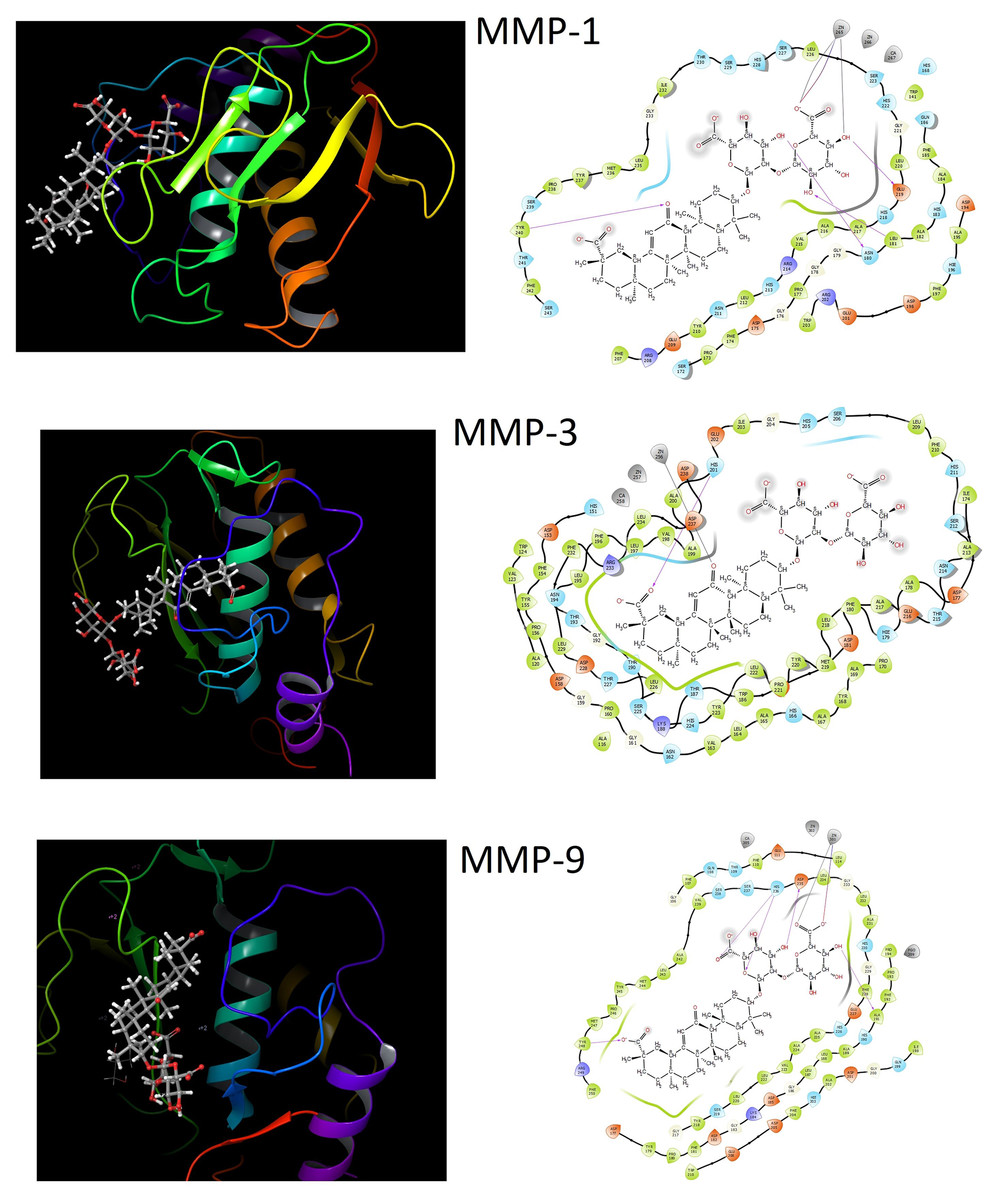
Figure 5: Molecular docking results of GA.
The molecular docking between GA and MMP-1, MMP-3 and MMP-9. The three-dimensional structure of GA and docking with MMP-1; MMP-3; MMP-9 with important amino acid residues. Purple arrow represents h.bonding, gray lines represents metal coordinations and red lines represent salt bridge interactions.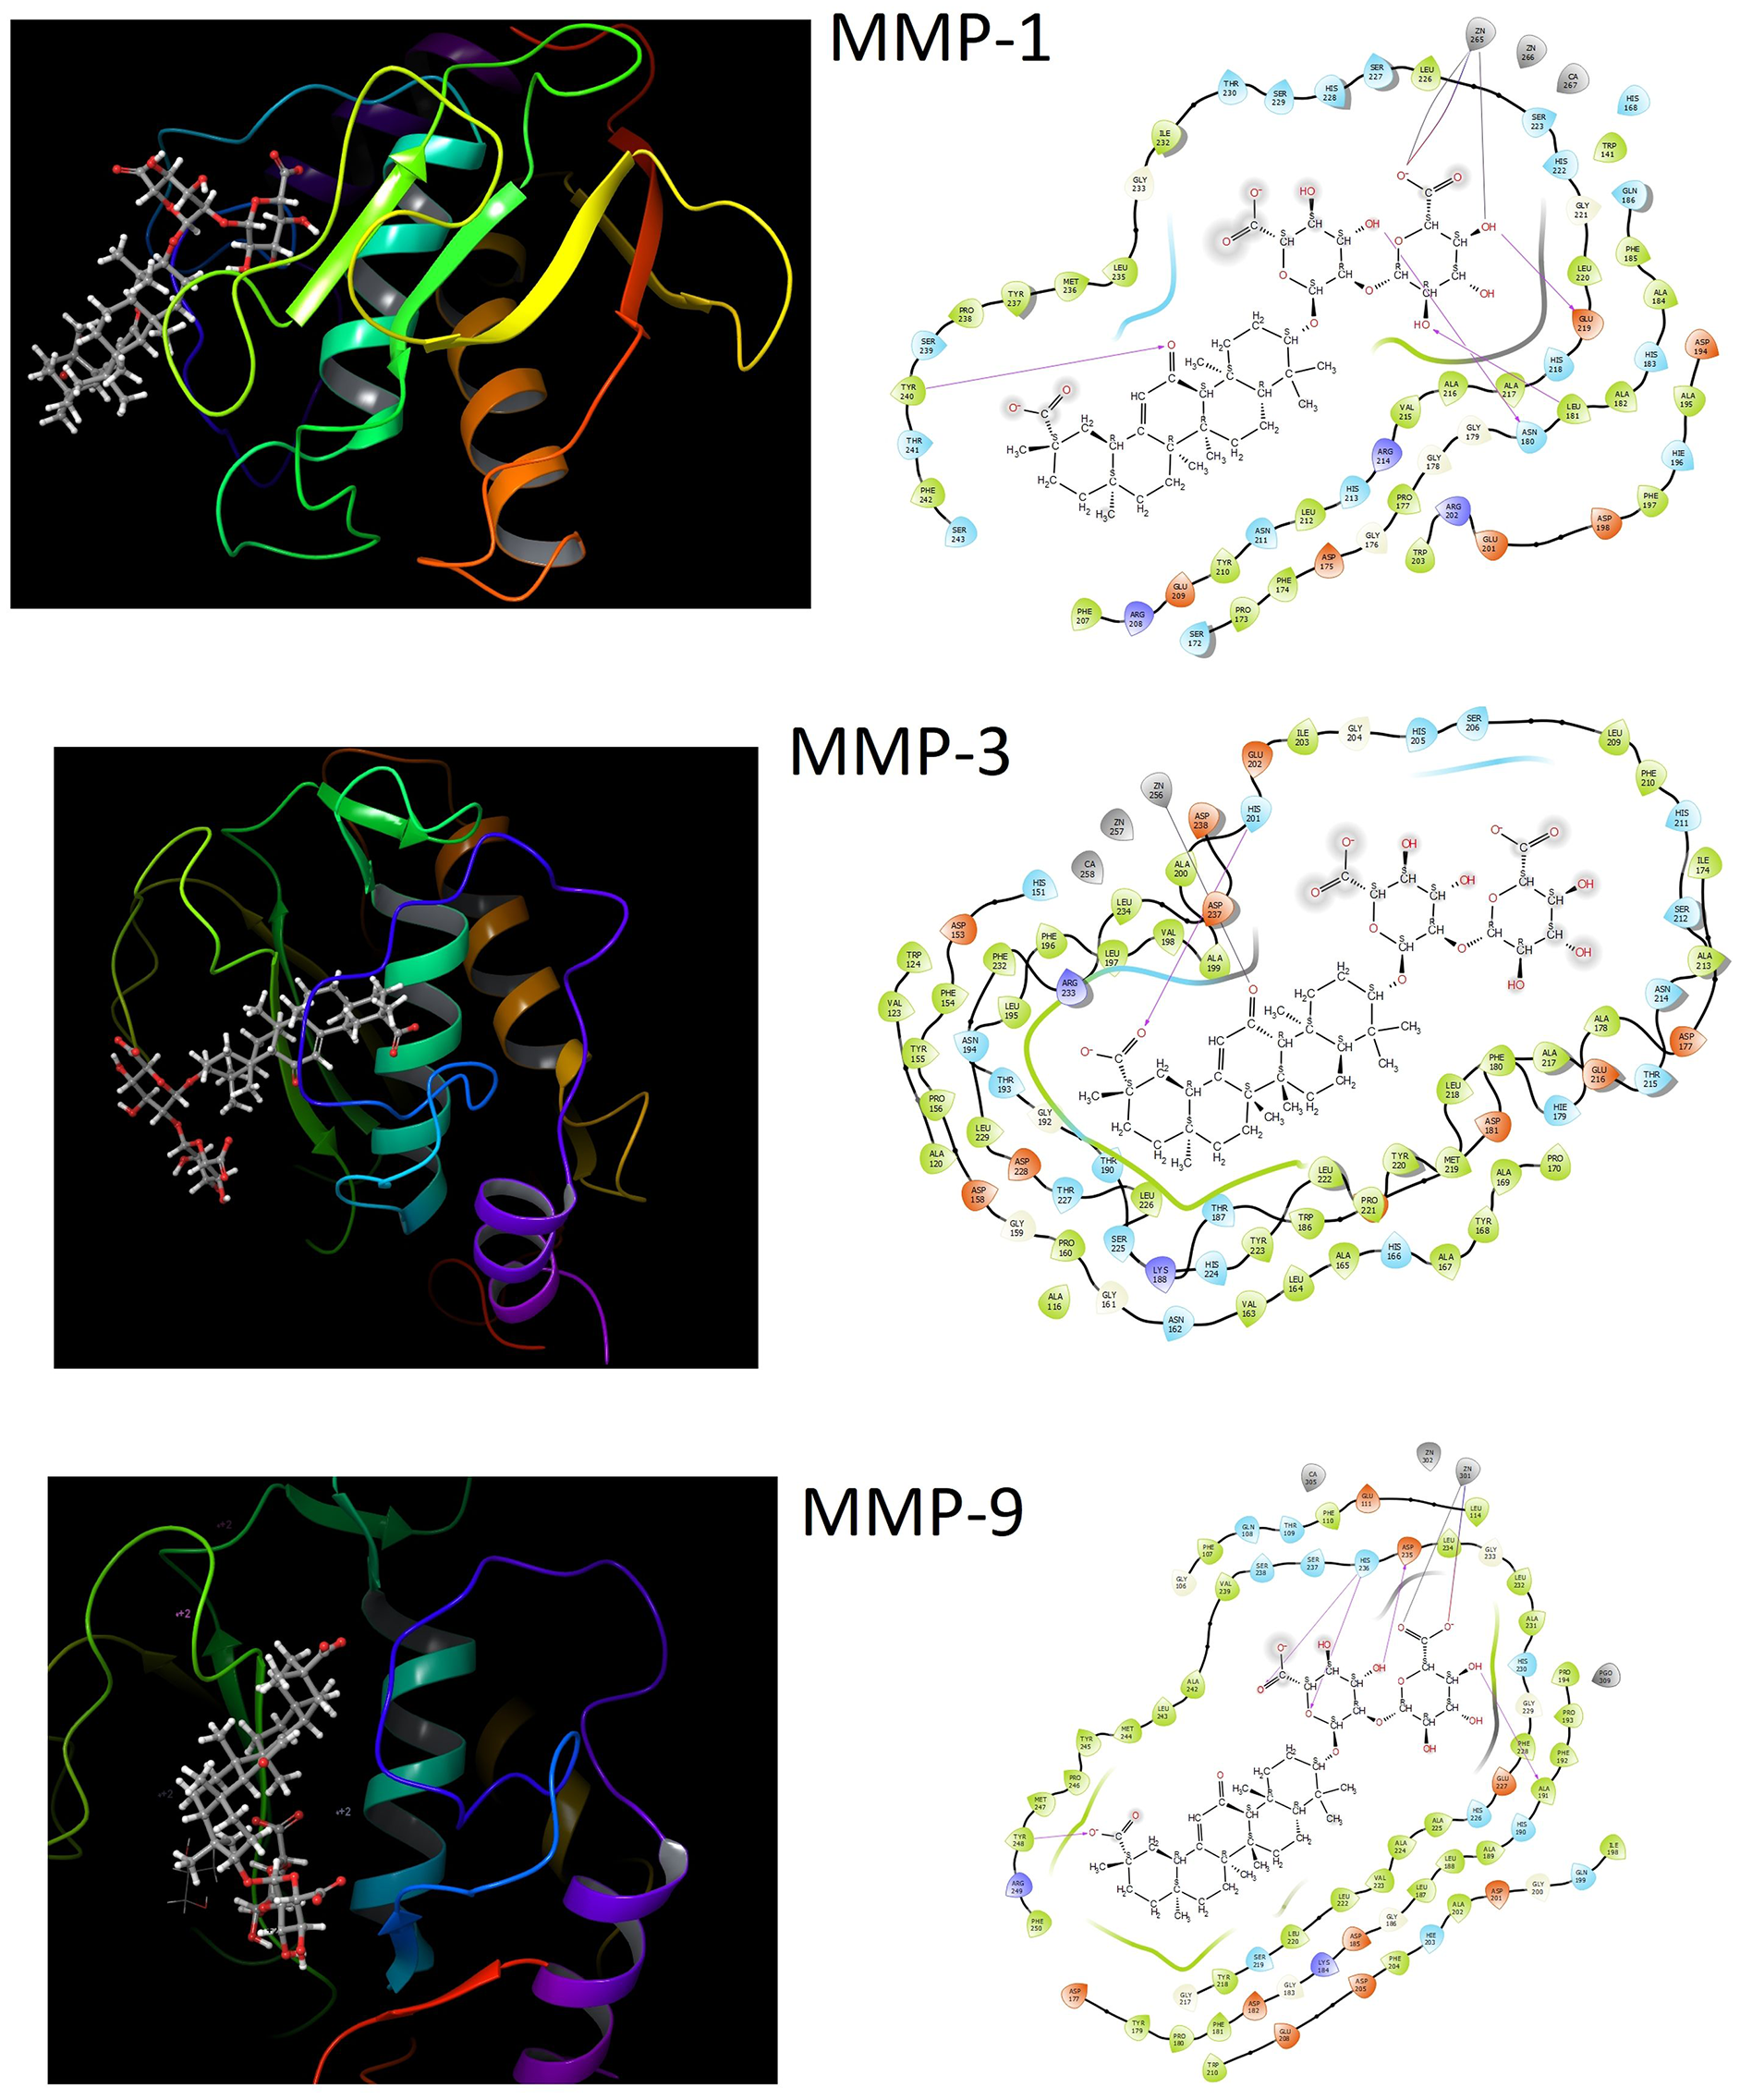
For MMP-3, GA only interacted with the HIS201 residue by hydrogen bond (2.33 Å) and also a metal coordination interaction (2.26 Å) also occurred between Zn256 and O atom. In addition to these interactions, two aromatic hydrogen bonds interactions (2.58 Å, 2.54 Å), which can be observed more clearly in Fig. 6, are established between HIS211 and PHE154 residues.
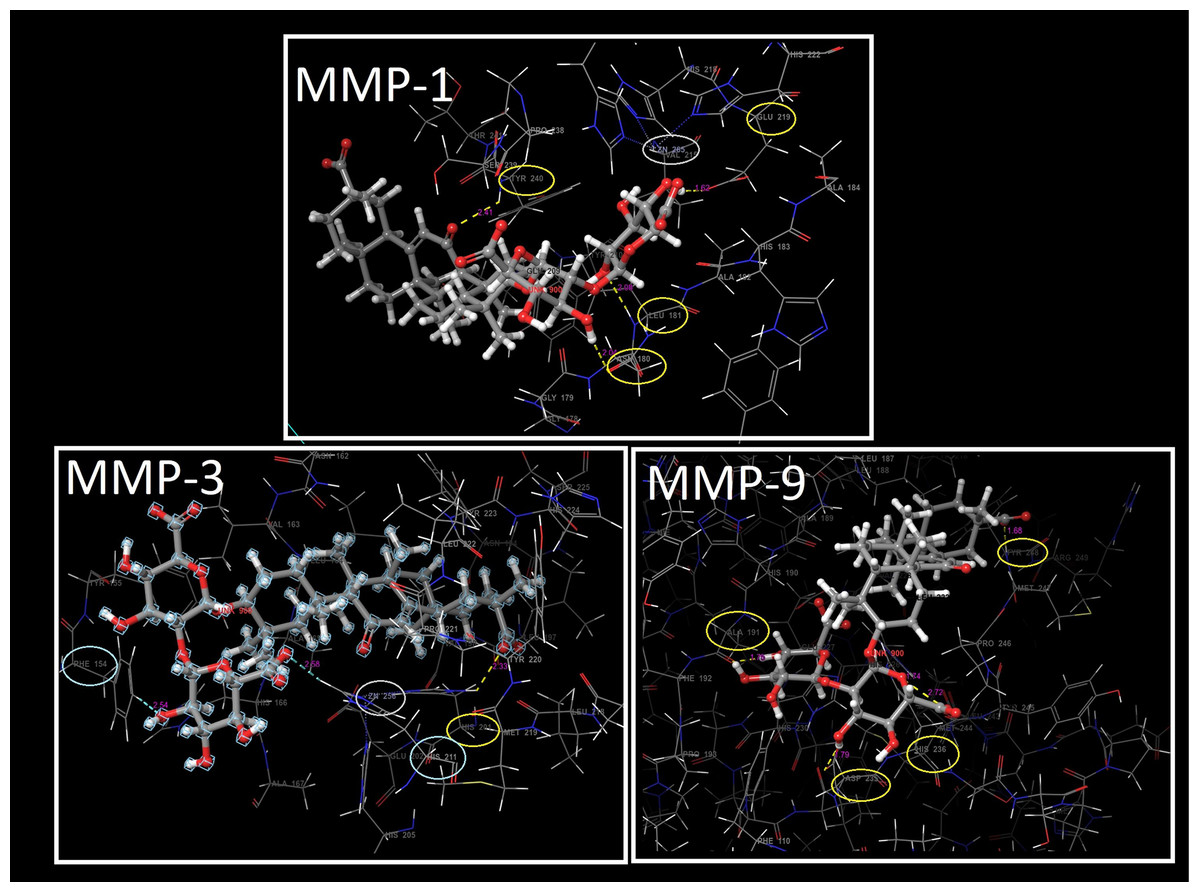
Figure 6: The interactions of GA.
The interactions between GA and docked with MMP-1, MMP-3 and MMP-9, respectively. Yellow circles represent the hydrogen bond interacted residues, blue circles indicate residues with aromatic hydrogen bond interactions and gray circles indicate metal coordination interaction of MMP-1, MMP-3 and MMP-9, respectively.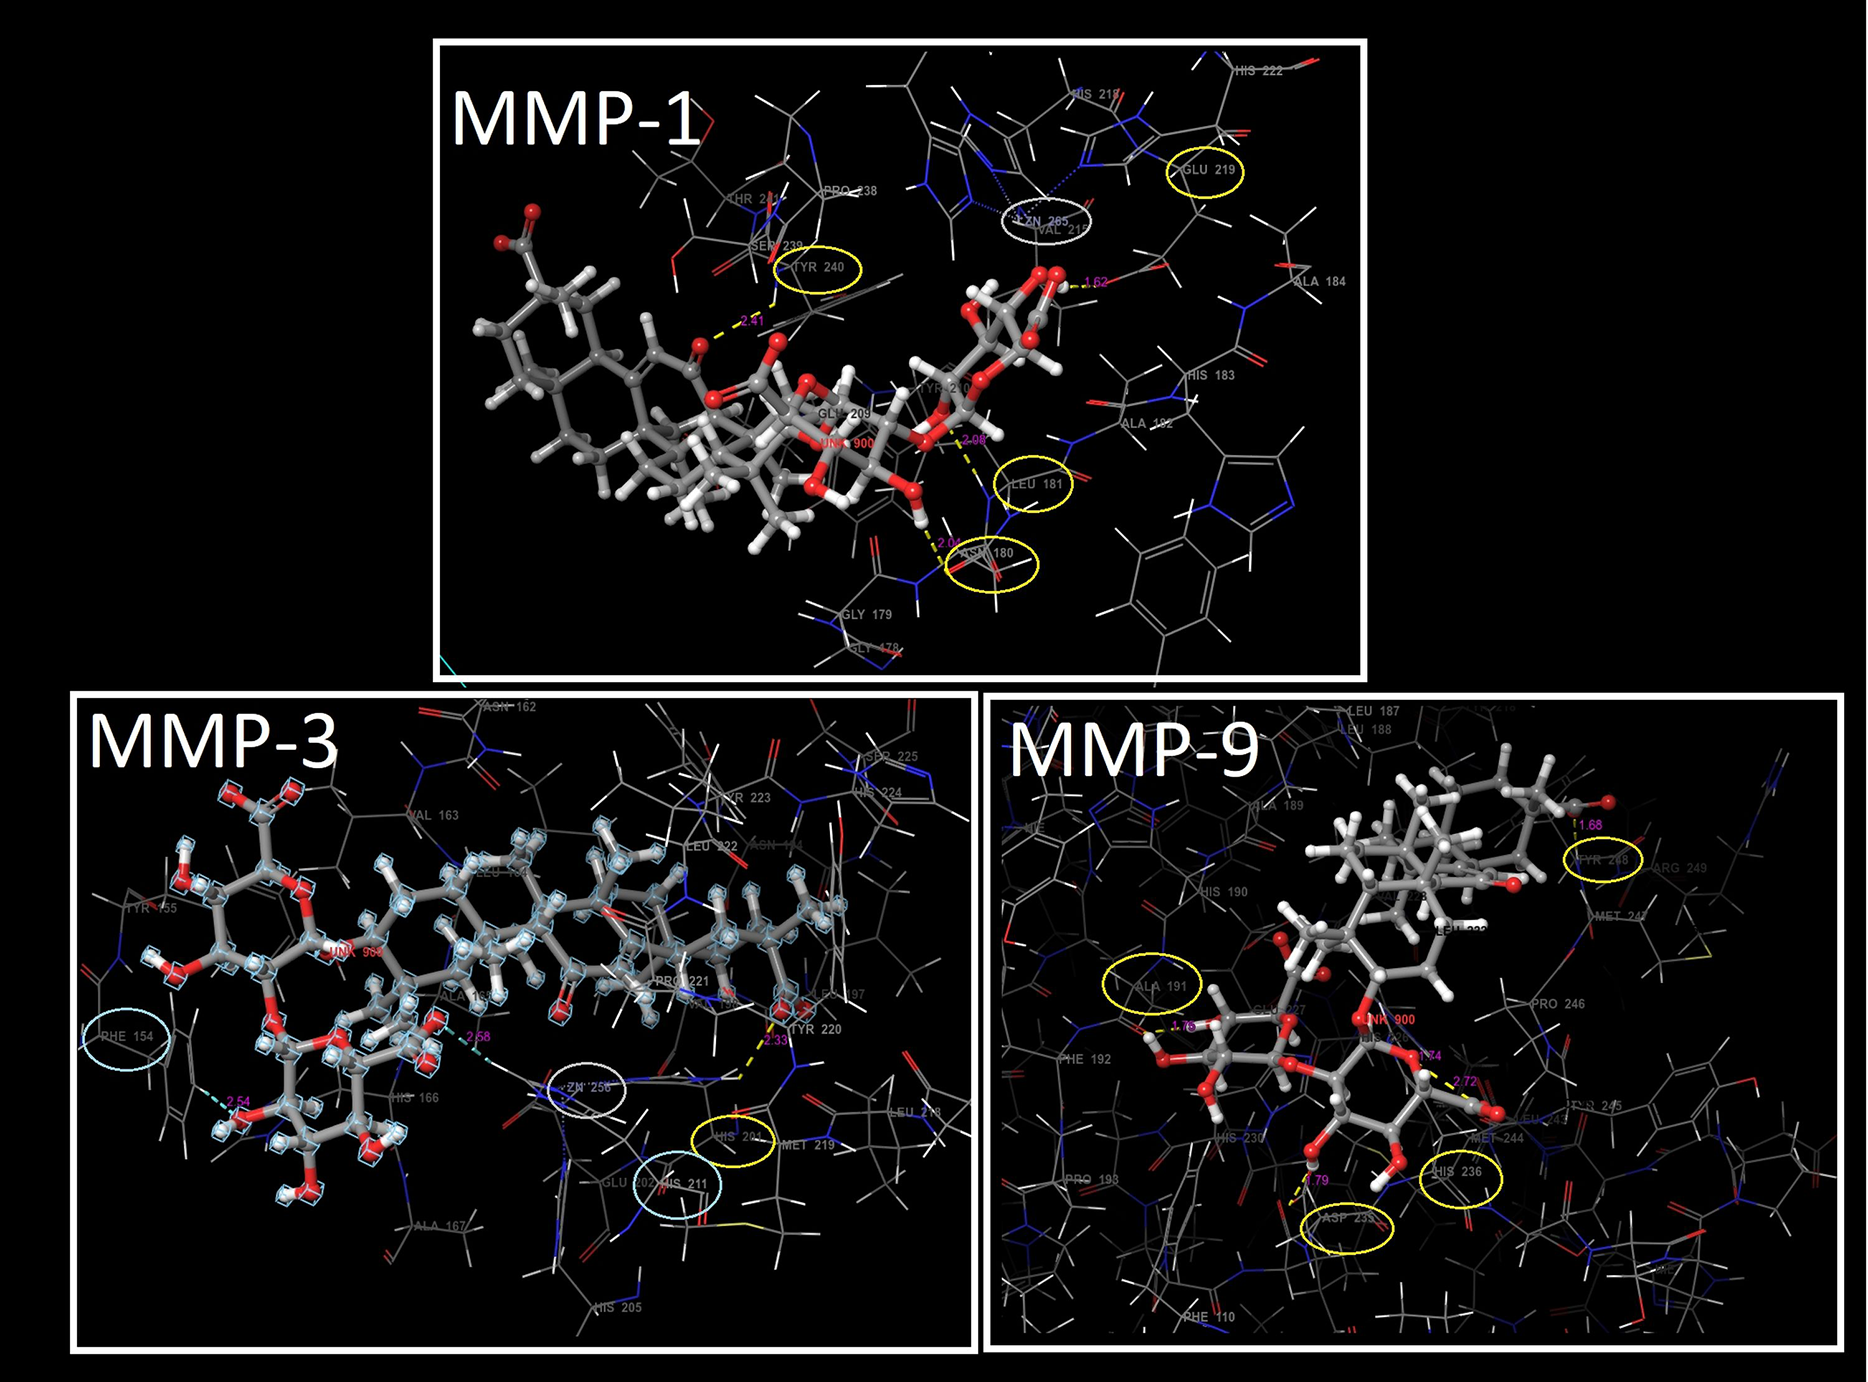
The five hydrogen bonds interactions between GA and MMP-9, TYR248 (1.68 Å), HIS236 (1.74 Å), HIS236 (2.72 Å), ASP235 (1.79 Å) and ALA191 (1.75 Å), caused the formation of the lowest binding energy (−8.64 kcal/mol). In addition to these interactions, the salt bridge interaction (4.19 Å) and metal coordination interaction (1.98 Å) with Zn301 atom also contributed to this stable binding. The present study also suggests that GA has the ability to inhibit MMP-9 similar to green tea extract inhibition with having interaction on Ala191 residue (Sarkar et al., 2016). The docking study allowed the understanding of the binding interactions of GA with MMPs as well as the identification of the activity profile on photo-aging of the skin based on inhibition of MMPs.
Molecular docking gives us instantaneous protein-ligand docking in a vacuum environment, the energy of this docking pose, hence its stability, and the effective interaction mechanisms for docking, but, it cannot provide detailed information about the natural flexibility of receptor systems and the nature of docking in the water system, which has a body-like structure. These situations can only be revealed by molecular dynamic analysis. The 50 ns MD simulations were carried out on GA based on docking scores, which had docking scores of −8.26 kcal/mol for MMP-1 (PDB ID: 966C), −4.57 kcal/mol for MMP-3 (PDB ID: 2JT6) and −8.64 kcal/mol for MMP-9 (PDB ID: 5CUH) protein, respectively. The RMSD, root-mean-square fluctuation (RMSF) and protein-ligand interactions were calculated using the MD trajectories generated as a result of 50 ns MD analysis. RMSD refers to the average deviation in the displacements of atoms in the protein-ligand complex compared to the initial state (reference) frame, and less RMSD variation means that the protein-ligand complex is more stable.
The fixed pose of GA-MMP-1 complex (seen in Fig. S2A) neutralized with 20 Na+ and 16 CI− ions in to the 5,821 water molecules system was first generated. The protein RMSD value was found to be around 1.2 Å depending on the Cα atoms of the MMP-1, and the RMSD value calculated for the side chain was a maximum 2.4 Å as a result of the MD analysis for 50 ns. If the observed ‘Lig fit Prot’ value is calculated to be significantly greater than the RMSD of the protein, it means that the ligand is likely to be dispersed away from the first binding site, however if the calculated RMSD values do not exceed the protein RMSD, it can be stays that ligand located around the first binding site. Since the observed ‘Lig fit Prot’ value did not exceed the RMSD of the protein, we can say that the GA remained around the first binding site, that is, no another binding took place away from the binding site seen in Fig. S3A. ‘Lig fit Lig’ showed internal fluctuations of GA atoms, i.e., the RMSD of a ligand aligned and measured in the reference conformation, where fluctuations in GA for the GA-MMP-1 complex was seen at 0.4 Å during 50 ns. The calculated RMSF parameter gives the local conformational changes in the protein chain during the simulation and the protein ligand contacts in the graph can also be observed. It was observed that the tails (N- and C-terminal) fluctuated more than any other part of the protein Fig. S3B. There are visible fluctuations in the residue index of 80 and 140, which are because of changes in the structure of beta-strands and alpha helices, respectively. According to the protein-ligand contacts diagram of the 50 ns simulation, TYR240, SER239, GLU219, ALA182, LEU181 and ASN180 residues made hydrogen bonding interactions with GA. HIS228, HIS222, GLU219 and HIS218 residues had ionic interactions. HIS218, HIS222 and HIS228 residues had ionic interactions at 100% of the simulation time in Fig. S3C. The timeline representation of the interactions and contacts was also given in Fig. S3D. The carbonyl group of GA made a prominent hydrogen bond interaction with GLU219 at 80% of the simulation trajectory. HIS218, HIS222 and HIS228 are polar residues that interacted with 100%, of the simulation time with ionic interactions.The OH group and O atom on the ring formed a water mediated hydrogen bond with ASN180, LEU181, ALA182 and TYR240 residues with 27%, 35%, 39% and 20%, respectively in Fig. S3E.
MD analysis was performed for 50 ns in the GA-MMP-3 system seen in Fig. S2B, whose total charge was neutralized by adding 23 Na+ and 17 CI− ions with 6,006 water molecules. MD analysis of the docked conformation of the GA-MMP3 complex showed that the RMSD of protein Cα atoms ranged from 1.5 to 2.5 Å, while the RMSD of GA fluctuated between 1.5 and 2 Å between 0 ns and 20 ns, then it appeared to be stable 1.5 Å up to 50 ns. In addition, the Lig fit Prot value did not exceed the protein RMSD value, that is, it did not go out of the ligand binding region seen Fig. S4A. The Root-Mean-Square-Fluctuation (RMSF) was used to characterize local changes along the MMP-3 protein chain, as can be seen from Fig. S4B, although the most fluctuations were observed in the N and C terminal, there was also a large fluctuation between the 90th and 100th residue index was monitored. When protein secondary structure elements (SSEs) such as alpha helices and beta strands were monitored throughout the simulation, these fluctuations appear to originate from beta strands. During the simulation, hydrogen bonds between MMP-3 and GA were formed between PHE154, HIS201, HIS211, TYR223 and ARG231 residues in Fig. S4C. The longest-lasting hydrogen bond interaction, in which the interaction continued throughout the simulation, was also achieved with HIS 201. The residues in the binding site of MMP3 and the interaction times during the simulation were shown in Fig. S4D. Examining the 2D interaction histogram of GA shown in Fig. S4E, it can be seen that polar HIS 211, HIS205 and HIS201 interacted 100% by hydrogen bonding together with ionic interactions with the O atom. PHE154, on the other hand, made over one specific contact with the ligand such as hydrogen bonding, hydrophobic and water bridge.
The GA-MMP-9 complex system, which was neutralized by adding 22 Na+ and 16 Cl− was created for MD calculation with 5,848 water molecules seen in Fig. S2C. The protein RMSD value, calculated as Cα, varies between 1 and 1.6 Å. The RMSD value calculated for Ligand for 50 ns was below 1 Å. Lig fit prot value didn’t exceed the calculated RMSD value for Cα, so it can be said that GA stayed within the ligand binding region of MMP-9 and formed a stable structure. Fluctuations in both ligand RMSD and protein RMSD were observed between 10 and 40 ns in Fig. S5A. According to the calculated RMSF value of MMP-9, RMSF values increased between 60 and 80 and 100 and 120 residue indexes in Fig. S5B. The changes between 60 and 80 are because of the changes in beta-strands, while the increase between 100 and 120 is due to the structure of both beta-strands and alpha-helices. When the protein-ligand contacts were revealed, it was seen that the hydrogen bonds formed with the ALA191 and GLU227 residues were effective. The effect of ALA191 and GLU227 on GA binding was seen almost throughout the simulation. Ionic interactions were occurred between HIS226, HIS230 and HIS236 residues and GA for 50 ns in Figs. S5C and S5D. The hydrogen bonding effect of TYR248 was observed during the first 20 ns of the simulation, then this interaction could not be observed because of the water bridge interaction. GLU227 demonstrated hydrogen bond contacts with the OH group of GA with 99%, ALA191 made two hydrogen bond contact with the OH group of GA with 92%, and 56% in the specified time frame, respectively. The ionic interaction of polar HIS226, HIS230 and HIS236 with the O atom occurred 100%. ALA189 was also demonstrated water mediated hydrogen bond contact with the O atom of GA with 79% in the 2D integration graph of GA in Fig. S5E.
The pharmacokinetic properties with ADMET values for GA were also evaluated in Tables S9–S11. It was seen that GA having C42H62O16 molecular formula with 822.93 g/mol molecular weight, which is greater than the recommended value for Lipinski’s five rules, the acceptor number is again greater than 10 and the donor number is greater than five. GA has also three violations of Lipinski rules and low bioavailability score value. There was no Ames toxicity and also hepatotoxicity value in Tables S10 and S11.
ProTox-II web server provides insights into the possible molecular mechanism behind toxic response such as oral toxicity, organ toxicity (hepatotoxicity), toxicological endpoints (such as mutagenicity, carcinotoxicity, cytotoxicity and immunotoxicity), toxicological pathways and toxicity targets. Acute toxicity models are constructed based on the chemical similarities between compounds with known toxic effects. For predicting toxicity targets, 15 different targets from protein targets related to adverse drug reactions from Novartis in vitro safety panels are used. Drug-induced hepatotoxicity is an important cause of acute liver failure and is among the main reasons for drug withdrawal from the market. Although drug-induced liver injury (DILI) is either a chronic process or a rare event, the prediction of DILI is essential for drug developers, regulators, and clinicians. The ProTox-II hepatotoxicity prediction model has an accuracy of 82% in cross validation and 86% in external validation. Chemicals that can induce tumors or increase the incidence of tumors are called carcinogens. The ProTox-II carcinogenicity prediction model has an accuracy of 81.24% in cross validation and 83.30% in external validation. Chemicals that cause abnormal genetic mutations, such as changes in a cell DNA, are called mutagens. Such changes can damage cells and cause diseases such as cancer. ProTox-II has an accuracy of 84.00% in cross validation and 85.00% in external validation, based on mutagenicity estimation with the Ames test and data from the CEBS database. The estimation of cytotoxicity is also crucial for screening compounds that can cause unwanted or desirable-cell damage. The ProTox-II cytotoxicity prediction model has an accuracy of 85.00% in cross validation and 83.60% in external validation. The negative effect of xenobiotics on the immune system is called immunotoxicity, and the ProTox-II immunotoxicity prediction model has an accuracy of 74.00% in cross validation and 70.00% in external validation (Banerjee et al., 2018). In our study, the hepatotoxicity, carcinogenicity, mutagenicity, cytotoxicity and immunotoxicity of GA were evaluated using ProTox-II web server (Table S11). ProTox-II mutagenicity estimation was calculated based on the Ames test and data from CEBS database. This value for GA was found to be inactive using this web server. According to in vitro AMES test results, it was found that GA had no genotoxic effect at low concentrations while all concentrations of GA-PLGA-NPs had no genotoxic effect.
Considering that GA does not comply with the Lipinski rules, its low bioavailability combined with its large molecular weight and unsuitable donor and recipient numbers seems to be weak to evaluate GA as a stand-alone drug candidate. For this reason, GA was encapsulated by PLGA in a nanoformulation that increases its bioavailability and efficiency.
Conclusion
Nano-sized drug delivery systems, especially polymer-based degradable NPs, have attracted great interest for use of the dermal application because they can provide an active substance with both enhanced penetration and prolonged/controlled release profile. In recent years, NPs have been widely used in the production of cosmetic products. With increasing consumer demand, they are added in most of the formulations developed for anti-aging products. PLGA polymeric NPs form a matrix structure containing the encapsulated active compound. Their nano-size and flexibility enable entry to host cells via endocytosis and thus allow intracellular release. The active ingredients encapsulated in PLGA-NPs improve the penetration of the skin when comparing the active ingredients in traditional applications.
In this study, to improve the penetration of GA into the skin, GA-PLGA NPs were successfully synthesized as an anti-aging product candidate with the controlled release feature. Average size, polydispersity index, zeta potential, GA loading and the encapsulation efficiency of NPs were determined. The results suggest that GA-PLGA NPs were stable, had a monodisperse structure and high quality of dispersion. In vitro toxicity tests are very important for the evaluation of the safety of chemicals. Therefore, genotoxicity and cytotoxicity tests were performed to evaluate the safety of GA-PLGA NPs and the safe concentration was determined. Finally, in silico molecular docking analysis was performed in order to reveal the direct interaction between GA and MMPs on a molecular basis. Inhibition of GA on MMP-1 was demonstrated by obtaining hydrogen bonding interactions with Tyr240 to the S1′ pocket of MMP-1 and hydrogen bonding interactions with the Asn180 residue to the S3′ pocket of MMP-1. These S1′ and S3′ pockets are very important binding sites for MMP-1 inhibition, and TRE and Abalone peptides found in the literature also provide MMP-1 inhibition by binding to these pockets. The most hydrogen bonds between GA and MMPs are five hydrogen bond interactions of MMP-9, which corresponds to the lowest binding energy (−8.64 kcal/mol). Similar to green tea extract inhibition, GA also had the ability to inhibit MMP-9 by binding over the Ala191 residue. The docking study allowed the understanding of the binding interactions of GA with MMPs, helping to define the profile of effects on photo-aging of the skin based on inhibition of MMPs. Intermolecular interactions of GA with MMPs target proteins and significant binding interaction scores were revealed by molecular docking analysis, and the stability of these interactions were evaluated using 50 ns dynamic simulation analysis. The stability of the GA-MMPs complexes under dynamic conditions were evaluated by the parameters obtained as a result of the MD simulation.
In conclusion, this study may help to gain alternative products to the cosmetic industry by contributing to anti-aging skin care topical formulations.
Supplemental Information
Raw data of calibration curve and %release study ghraphic.
Calibration curve of GA.% Release amount of GA.
Characterization and in silico results.
Table S1. UV scanning of GA in the 190–500 nm range.
Table S2. UV scanning of PBS in the 190–500 nm range.
Table S3. UV scanning of blank PLGA solution in the range of 190–500 nm.
Table S4. Intraday and interday precision results.
Table S5. Recovery study results.
Table S6. Recovery study results.
Table S7. Genotoxic effects of GA, and GA-PLGA NPs on S. typhimurium TA98 and TA100 mutant strains.
Table S8. The docking score energies and probable interactions between GA and MMP Targets.
Table S9. Virtual screening of GA showing drug-likeliness by Molinspiration and SwissADME servers.
Table S10. Pharmacokinetic properties of GA showing ADME and toxicity by pkCSM server.
Table S11. Oral toxicity prediction results for GA by proTOX-II server.
Characterization and in silico results.
Figure S1. The calibration curve of GA.
Figure S2. MD system ofGA in complex with MMP-1 (PDB ID: 966C) (a), MMP-3 (PDB ID: 2JT6) (b), MMP-9 (PDB ID: 5CUH) (c).
Figure S3. MD simulation analysis of GA in complex with MMP-1 (PDB ID: 966C) (A) RMSD of GA-966C complex (Protein Cα-atoms RMSD is shown in green while RMSD of GA with respect to protein are shown in purple (a), Protein amino acids RMSF (b), Protein-ligand contact diagram (c), timeline representation of the interactions and contacts (d) ligand 2D interaction histogram obtained from MD trajectory (e).
Figure S4. MD simulation analysis of GA in complex with MMP-3 (PDB ID: 2JT6) (A) RMSD of GA-2JT6 complex (Protein Cα-atoms RMSD is shown in green while RMSD of GA with respect to protein are shown in purple (a), Protein amino acids RMSF (b), Protein-ligand contact diagram (c), timeline representation of the interactions and contacts (d) ligand 2D interaction histogram obtained from MD trajectory (e).
Figure S5. MD simulation analysis of GA in complex with MMP-9 (PDB ID: 5CUH) (A) RMSD of GA-5CUH complex (Protein Cα-atoms RMSD is shown in green while RMSD of GA with respect to protein are shown in purple (a), Protein amino acids RMSF (b), Protein-ligand contact diagram (c), timeline representation of the interactions and contacts (d) ligand 2D interaction histogram obtained from MD trajectory (e).