
RNA sequencing-based identification of microRNAs in the antler cartilage of Gansu red deer (Cervus elaphus kansuensis)
- Published
- Accepted
- Received
- Academic Editor
- Mahendra Tomar
- Subject Areas
- Genetics, Genomics, Molecular Biology, Zoology
- Keywords
- Cervus elaphus kansuensis, Gansu red deer, Velvet antler, Rapid growth, microRNAs
- Copyright
- © 2022 Chen et al.
- Licence
- This is an open access article distributed under the terms of the Creative Commons Attribution License, which permits unrestricted use, distribution, reproduction and adaptation in any medium and for any purpose provided that it is properly attributed. For attribution, the original author(s), title, publication source (PeerJ) and either DOI or URL of the article must be cited.
- Cite this article
- 2022. RNA sequencing-based identification of microRNAs in the antler cartilage of Gansu red deer (Cervus elaphus kansuensis) PeerJ 10:e13947 https://doi.org/10.7717/peerj.13947
Abstract
Background
The velvet antler is a complex mammalian bone organ with unique biological characteristics, such as regeneration. The rapid growth stage (RGS) is a special period in the regeneration process of velvet antler.
Methods
To elucidate the functions of microRNAs (miRNAs) at the RGS of antler development in Gansu red deer (Cervus elaphus kansuensis), we used RNA sequencing (RNA-seq) to analyze miRNA expression profiles in cartilage tissues of deer antler tips at three different growth stages.
Results
The RNA-seq results revealed 1,073 known and 204 novel miRNAs, including 1,207, 1,242, and 1,204 from 30-, 60-, and 90-d antler cartilage tissues, respectively. To identify key miRNAs controlling rapid antler growth, we predicted target genes of screened 25 differentially expressed miRNAs (DEMs) and specifically expressed miRNAs (SEMs) in 60 d and annotated their functions. The KEGG results revealed that target genes of 25 DEMs and 30 SEMs were highly classified in the “Metabolic pathways”, “Pathways in cancer”, “Proteoglycans in cancer” and “PI3K-Akt signaling pathway”. In addition, a novel miRNA (CM008039.1_315920), highly enriched in “NF-kappa B signaling pathway”, may need further study.
Conclusions
The miRNAs identified in our study are potentially important in rapid antler growth. Our findings provide new insights to help elucidate the miRNA-mediated regulatory mechanisms involved during velvet antler development in C. elaphus kansuensis.
Introduction
Velvet antlers, the bone-free and furry horns in male deer, develop through a highly complicated and genetically programmed process facilitating the growth of bone, skin, blood vessels and nerves. The proliferation and differentiation of cells in growing antler tips are regulated by several intracellular and extracellular factors and signaling pathways (Hu et al., 2019). The growth process of velvet antlers is very similar to endochondral ossification of limbs, which drives cartilage formation through mesenchymal cell differentiation. Therefore, velvet antlers are often used as a model to study cartilage and bone tissue regeneration and injury repair (Price & Allen, 2004).
During their rapid growth phase, antlers can exceed 2 cm/day. This is a hot topic in the field of biology (Price, Faucheux & Allen, 2005; Chu et al., 2017). Combining data on growth rate, shedding time and age, the fastest growing period of velvet antlers was ∼60 days after shedding, indicating that this is a critical stage during antler development. However, the underlying mechanisms involved in the rapid growth stage (RGS) of antler development remains unknown. Deer antler growth is mainly controlled by the growth center located at antler tips, comprising velvet skin, mesenchyme and cartilage tissue (Li et al., 2002). The cartilage zone dominates a large part of the antler growth center, and hence, plays a key role during the RGS of antler development (Ba et al., 2019).
MicroRNAs (miRNAs) are a class of small non-coding RNAs (ncRNAs), usually 17–22 nucleotides long, which are critical in post-transcriptional gene regulation via target messenger RNA (mRNA) degradation or via translation inhibition. MicroRNAs function through pairing with complementary sequences in the 3′-untranslated region (3′-UTR) of their target mRNAs (Mohr & Mott, 2015). These small regulatory molecules are ubiquitous in the genomes of animals, plants and even some viruses (Lu & Rothenberg, 2018). Previous studies have provided a considerable amount of information on the miRNA-mediated regulation of various biological processes, including organ development (Zhang et al., 2016a; Zhang et al., 2016b), phase transition (Wójcik & Gaj, 2016; Zhang et al., 2016a; Zhang et al., 2016b) and stress response (Candar-Cakir, Arican & Zhang, 2016; Li et al., 2016). Furthermore, recent studies have reported that specific miRNAs participate in the regulation of cartilage development, degradation and integrity (Zhang et al., 2019; Liu et al., 2020; Tu et al., 2020).
Deep sequencing methods now provide a fast and convenient way to identify and profile small RNA populations in various tissues and at different developmental stages (Fahlgren et al., 2007). Recent advances in RNA sequencing (RNA-seq) have also provided new opportunities to integrate changes in protein-coding mRNAs with regulatory signals, such as those driven by ncRNAs and alternative RNA splicing events (Ackerman 4th et al., 2018). RNA-seq has been widely used to study miRNA expression in humans, other animals and plants (Chiba et al., 2021; Hao et al., 2021; Wang et al., 2021; Yang et al., 2021).
To elucidate miRNA function during the RGS of antler development, we investigated miRNA expression profiles in the cartilage of antler growth centers at three developmental stages, specifically at 30, 60, and 90 days (d). During the proliferation stage, antlers grow at an extremely rapid rate without any carcinogenesis, which is unique among mammals. This growth characteristic makes deer antlers an ideal medical model for studying cancer treatment. The longitudinal growth of velvet antler is achieved through osteogenesis in the cartilage of each branch, very similar to the cartilage formation process in mammals. Thus, the velvet antler is a model of cartilage damage repair. Our findings may contribute new insights into the roles of miRNAs and their target mRNAs in the complex regulatory networks affecting antler development.
Materials & Methods
Ethics approval statement
All experimental protocols were approved by the Institutional Animal Care and Use Committee of Qinghai University (Xining, China), and all methods were carried out in accordance with approved guidelines and regulations (code: SL-2022024). All procedures involving animals were conducted in accordance with the US National Institutes of Health Guide for the Care and Use of Laboratory Animals (National Academies Council, 2011). This study was carried out in compliance with the ARRIVE guidelines for reporting animal research (Percie du Sert et al., 2020).
Animals and samples collection
Samples were collected from a C. elaphus kansuensis population of 200 individuals, raised in a semi-wild setting and fed under the same conditions (Shandan County, Gansu Province, China). Cartilage tissues in the antler tips at different growth stages (30, 60, and 90 d) were collected from three healthy adult individuals (4–5 years old, male) for RNA extraction. Three antler samples from three different individuals were prepared for RNA-seq and qRT-PCR. Antlers were collected after anaesthetising deer with special Mian Naining (anaesthetic, No.9812, People’s Liberation Army (PLA) Military Supplies University Research Institute, China), and hemostasis measures were taken immediately after velvet cutting. After recovering from anaesthesia, deer were returned to the herd.
RNA extraction, library preparation, and sequencing
Total RNA was extracted using TRIzol™ Reagent (Thermo Fisher Scientific, Waltham, MA, USA) following the manufacturer’s protocol. Extracted RNA was treated with DNase I (Promega, Madison, WI, USA) to remove contamination. To ensure that the RNA samples were qualified for sequencing, concentration and integrity were assessed using a NanoDrop 2000 Spectrophotometer (Thermo Fisher Scientific, Waltham, MA, USA) and RNA Nano 6000 Assay Kit with the Bioanalyzer 2100 System (Agilent Technologies, Santa Clara, CA, USA), respectively.
In this study, sample collection, high-throughput sequencing and data collection were conducted as previously described in Chen et al. (2022). Specifically, a total of 2.5 ng RNA per sample was used as input material for library preparation. Sequencing libraries were generated using NEBNext® Ultra™ RNA Library Prep Kit for Illumina® (New England Biolab, Ipswich, MA, USA) following manufacturer’s protocol, and index codes were added to attribute sequences. Library quality was assessed using Bioanalyzer 2100 (Agilent Technologies, Santa Clara, CA, USA).
Pooled miRNA libraries were sequenced for 50 cycles using HiSeq® Rapid SBS Kit v2 and HiSeq® 2500 platform (Illumina, San Diego, CA, USA). Sequencing data are available at the National Center for Biotechnology Information (NCBI) Sequence Read Archive (SRA) (BioProject: PRJNA731682).
Data analysis
Raw reads in FASTQ format were preprocessed using in-house Perl scripts. In this step, clean reads were obtained via trimming adapters and removing reads containing poly(A) tails, low-quality bases, and sequences <18 or >30 nucleotides long. Additionally, Q20 and Q30 scores, GC content (%), and sequence duplication level of cleaned data were determined.
Second, cleaned reads were aligned against the Silva (Quast et al., 2013) (https://www.arb-silva.de/), Genomic tRNA (Chan & Lowe, 2016) (GtRNAdb; http://lowelab.ucsc.edu/GtRNAdb/), Rfam (Kalvari et al., 2018) (http://rfam.xfam.org/), and Repbase (Bao, Kojima & Kohany, 2015) (http://www.girinst.org/repbase) databases using Bowtie (Langmead et al., 2009) to remove sequences that matched to rRNAs, tRNAs, snRNAs, snoRNAs, other ncRNAs, and repeats. Then clean small RNAs with a length range from 18 to 35 nucleotides were further analyzed. Third, Randfold tools (Bonnet et al., 2004) (http://www.aquafold.com) was used for predicting novel miRNA secondary structure. Fourth, the miRBase v21.0 database (Kozomara & Griffiths-Jones, 2014) (http://www.mirbase.org/) with 0 or 1 mismatch and miRDeep2 (Friedländer et al., 2012) with default parameters were used to identify known miRNAs and predict novel miRNAs. The miRNA expression profiles were determined based on TPM values using the normalized formula (Zhao, Ye & Stanton, 2020): TPM = 106 ∗ [Reads mapped to transcript/Transcript length]/[Sum (Reads mapped to transcript/Transcript length)]. (Note: “Reads mapped to the transcript” refers to read number of one miRNA, “Transcript length” refers to length of that one miRNA).
Based on the normalization counts, the significantly differentially expressed miRNAs in three stages were determined by their fold change. Based on a power analysis using the IDEG6 (Romualdi et al., 2003), we determined that our design had over 99% power to detect differentially expressed miRNAs (DEMs) at | log2(FC) | > = 1 and FDR < = 0.01 (Hou et al., 2019). We then screened for DEMs in the 30 d vs. 60 d and 60 d vs. 90 d pairwise comparisons.
MiRNA target prediction and functional analysis of candidate target genes
We put more focus on the 25 selected DEMs and the 30 specifically expressed miRNAs in 60 d library. Potential target genes of novel miRNAs and specifically expressed miRNAs were predicted using Miranda v3.3a (https://anaconda.org/bioconda/miranda) and TargetScan 7.2 (http://www.targetscan.org/vert_72/) with default parameters. Genes simultaneously predicted by both methods were considered as candidate targets of selected miRNAs. Functional annotation of these candidates were performed using GO enrichment (Ashburner et al., 2000) and KEGG pathway (Kanehisa & Goto, 2000) analyses.
Verification of miRNA expression using qRT-PCR
Stem-loop qRT-PCR was used to verify the accuracy of the sequencing data. Twelve of the selected 25 DEMs had similar names (except species), sequences and expression levels, and the remaining 13 DEMs were used for qRT-PCR. Total RNA was extracted as previously described. Approximately 1 µg of total RNA was reverse transcribed using Revert Aid First Strand cDNA Synthesis Kit (Fermentas, Thermo Fisher Scientific, Waltham, MA, USA). Reactions were incubated at 42 °C for 15 min and then terminated at 80 °C for 5 s. The qRT-PCR assay was performed using TB Green® Premix Ex Taq™ II (Tli RNaseH Plus) Kit (Takara Bio, Shiga, Japan) and CFX96 Real-time PCR Detection System (Bio-Rad Laboratories, Hercules, CA, USA). The miRNA expression level was detected using stem-loop qRT-PCR and miRNA-specific stem-loop primers. Gene-specific forward primers and universal reverse primers (Sangon Biotech, Shanghai, China) were used for qRT-PCR, with U6 RNA as internal control. Cycling profiles were as follows: 95 °C for 30 s, followed by 40 cycles at 95 °C for 5 s, and 60 °C for 30 s. Table 1 lists all primers used in this study. Melting curve analysis was also performed to determine product specificity. All statistical analyses were performed in triplicate. All data are presented as the mean ± standard deviation. Relative gene expression was subsequently analyzed using the comparative 2−ΔΔCt method (Livak & Schmittgen, 2001; Rao et al., 2013).
| Gene ID | miRNA sequence | Primers | Sequence |
|---|---|---|---|
| U6 RNA | RTP | AACGCTTCACGAATTTGCGT | |
| Forward primer | CTCGCTTCGGCAGCACA | ||
| Reverse primer | AACGCTTCACGAATTTGCG | ||
| aga-miR-184 | TGGACGGAGAACTGATAAGGG | RTP | GGCCAAGCAGTGGTATCAACGCAGAGTGGCCCCCTTA |
| Forward primer | CTTATCAGTTCTCCGTCCATGCGTG | ||
| Reverse primer | AAGCAGTGGTATCAACGCAGAGT | ||
| bta-miR-146b | TGAGAACTGAATTCCATAGGCTGT | RTP | GGCCAAGCAGTGGTATCAACGCAGAGTGGCCACAGCC |
| Forward primer | GCCTATGGAATTCAGTTCTCAGCGTG | ||
| Reverse primer | AAGCAGTGGTATCAACGCAGAGT | ||
| bta-miR-187 | TCGTGTCTTGTGTTGCAGCCGG | RTP | GGCCAAGCAGTGGTATCAACGCAGAGTGGCCCCGGCT |
| Forward primer | TGCAACACAAGACACGAGCGTG | ||
| Reverse primer | AAGCAGTGGTATCAACGCAGAGT | ||
| bta-miR-27a-5p | AGGGCTTAGCTGCTTGTGAGCA | RTP | GGCCAAGCAGTGGTATCAACGCAGAGTGGCCTGCTCA |
| Forward primer | CAAGCAGCTAAGCCCTTGCGTG | ||
| Reverse primer | AAGCAGTGGTATCAACGCAGAGT | ||
| bta-miR-504 | AGACCCTGGTCTGCACTCTGTC | RTP | GGCCAAGCAGTGGTATCAACGCAGAGTGGCCGACAGA |
| Forward primer | CAGAGTGCAGACCAGGGTCTTCATG | ||
| Reverse primer | AAGCAGTGGTATCAACGCAGAGT | ||
| cfa-miR-10a | TACCCTGTAGATCCGAATTTGT | RTP | GGCCAAGCAGTGGTATCAACGCAGAGTGGCCACAAAT |
| Forward primer | ACAAATTCGGATCTACAGGGTATGCGTG | ||
| Reverse primer | AAGCAGTGGTATCAACGCAGAGT | ||
| chi-miR-411b-3p | TATGTCACATGGTCCACTAAT | RTP | GGCCAAGCAGTGGTATCAACGCAGAGTGGCCATTAGT |
| Forward primer | ATTAGTGGACCATGTGACATAGGCGTG | ||
| Reverse primer | AAGCAGTGGTATCAACGCAGAGT | ||
| efu-miR-181a | AACCATCGACCGTTGATTGTACC | RTP | GGCCAAGCAGTGGTATCAACGCAGAGTGGCCGGTACA |
| Forward primer | ATCAACGGTCGATGGTTTGCGTG | ||
| Reverse primer | AAGCAGTGGTATCAACGCAGAGT | ||
| oar-miR-10a | TACCCTGTAGATCCGAATTTG | RTP | GGCCAAGCAGTGGTATCAACGCAGAGTGGCCCAAATT |
| Forward primer | CAAATTCGGATCTACAGGGTATGCGTG | ||
| Reverse primer | AAGCAGTGGTATCAACGCAGAGT | ||
| ssa-miR-144-5p | GGATATCATCATATACTGTAAGTT | RTP | GGCCAAGCAGTGGTATCAACGCAGAGTGGCCAACTTA |
| Forward primer | CAGTATATGATGATATCCGGCAACGCG | ||
| Reverse primer | AAGCAGTGGTATCAACGCAGAGT | ||
| unconservative_CM008019.1_137729 | CCCAGGGATGTAGCTCCTAGTGC | RTP | GGCCAAGCAGTGGTATCAACGCAGAGTGGCCGCACTA |
| Forward primer | AGCTACATCCCTGGGTTATGCGTG | ||
| Reverse primer | AAGCAGTGGTATCAACGCAGAGT | ||
| unconservative_CM008022.1_159134 | CAAATTCGTGAAGCGTTCCATATTT | RTP | GGCCAAGCAGTGGTATCAACGCAGAGTGGCCAAATAT |
| Forward primer | GAACGCTTCACGAATTTGTGCGTG | ||
| Reverse primer | AAGCAGTGGTATCAACGCAGAGT | ||
| unconservative_CM008039.1_315920 | CGGATCAGCTCAGTGCCGGGC | RTP | GGCCAAGCAGTGGTATCAACGCAGAGTGGCCGCCCGG |
| Forward primer | CACTGAGCTGATCCGAATTGCGTG | ||
| Reverse primer | AAGCAGTGGTATCAACGCAGAGT |
Notes:
- RTP
-
Primer used in reverse transcription
Results
MiRNA sequencing
To determine miRNA function during velvet antler RGS, we constructed three small RNA libraries for antler growth centers at 30, 60, and 90 d, generating 14,971,388, 16,985,192, and 15,732,412 raw reads, respectively.
After data preprocessing, we obtained 9,836,383, 13,092,918, and 10,769,127 clean reads for 30-, 60-, and 90-d antler tips, respectively. We then aligned clean reads with Silva, GtRNAdb, Rfam, and Repbase databases using Bowtie (Langmead et al., 2009), a comparison software for short sequences, especially reads generated from highlight sequencing. After filtering out sequences that matched ribosomal RNAs (rRNAs), transfer RNAs (tRNAs), small nuclear RNAs (snRNAs), small nucleolar RNAs (snoRNAs), other ncRNAs, and repeats, we obtained 8,646,311 (30 d), 11,699,869 (60 d), and 9,461,208 (90 d) unannotated reads that only contained miRNAs.
For miRNA prediction, the remaining reads were aligned to the deer genome (https://www.ncbi.nlm.nih.gov/genome/?term=red+deer), with no mismatch allowed between unannotated reads and the reference sequence. Respectively, 5,430,521 (62.81%), 7,081,757 (60.52%), and 5,621,148 (59.41%) reads from 30-, 60-, and 90-d antler cartilage tissues were successfully mapped and annotated (Table 2).
| 30 d | 60 d | 90 d | |
|---|---|---|---|
| Raw_reads | 14971388 | 16985192 | 15732412 |
| Clean_reads | 9836383 | 13092918 | 10769127 |
| rRNA | 854250 | 996335 | 932966 |
| scRNA | 0 | 0 | 0 |
| snRNA | 3 | 4 | 4 |
| snoRNA | 21446 | 18939 | 15955 |
| tRNA | 188055 | 239173 | 237900 |
| Repbase | 126318 | 138598 | 121094 |
| Unannotated Reads | 8646311 | 11699869 | 9461208 |
| Mapped_Reads | 5430521 | 7081757 | 5621148 |
| Known miRNAs | 1003 | 1052 | 1021 |
| Novel miRNAs | 184 | 190 | 183 |
Identification of known and novel miRNAs in velvet antler
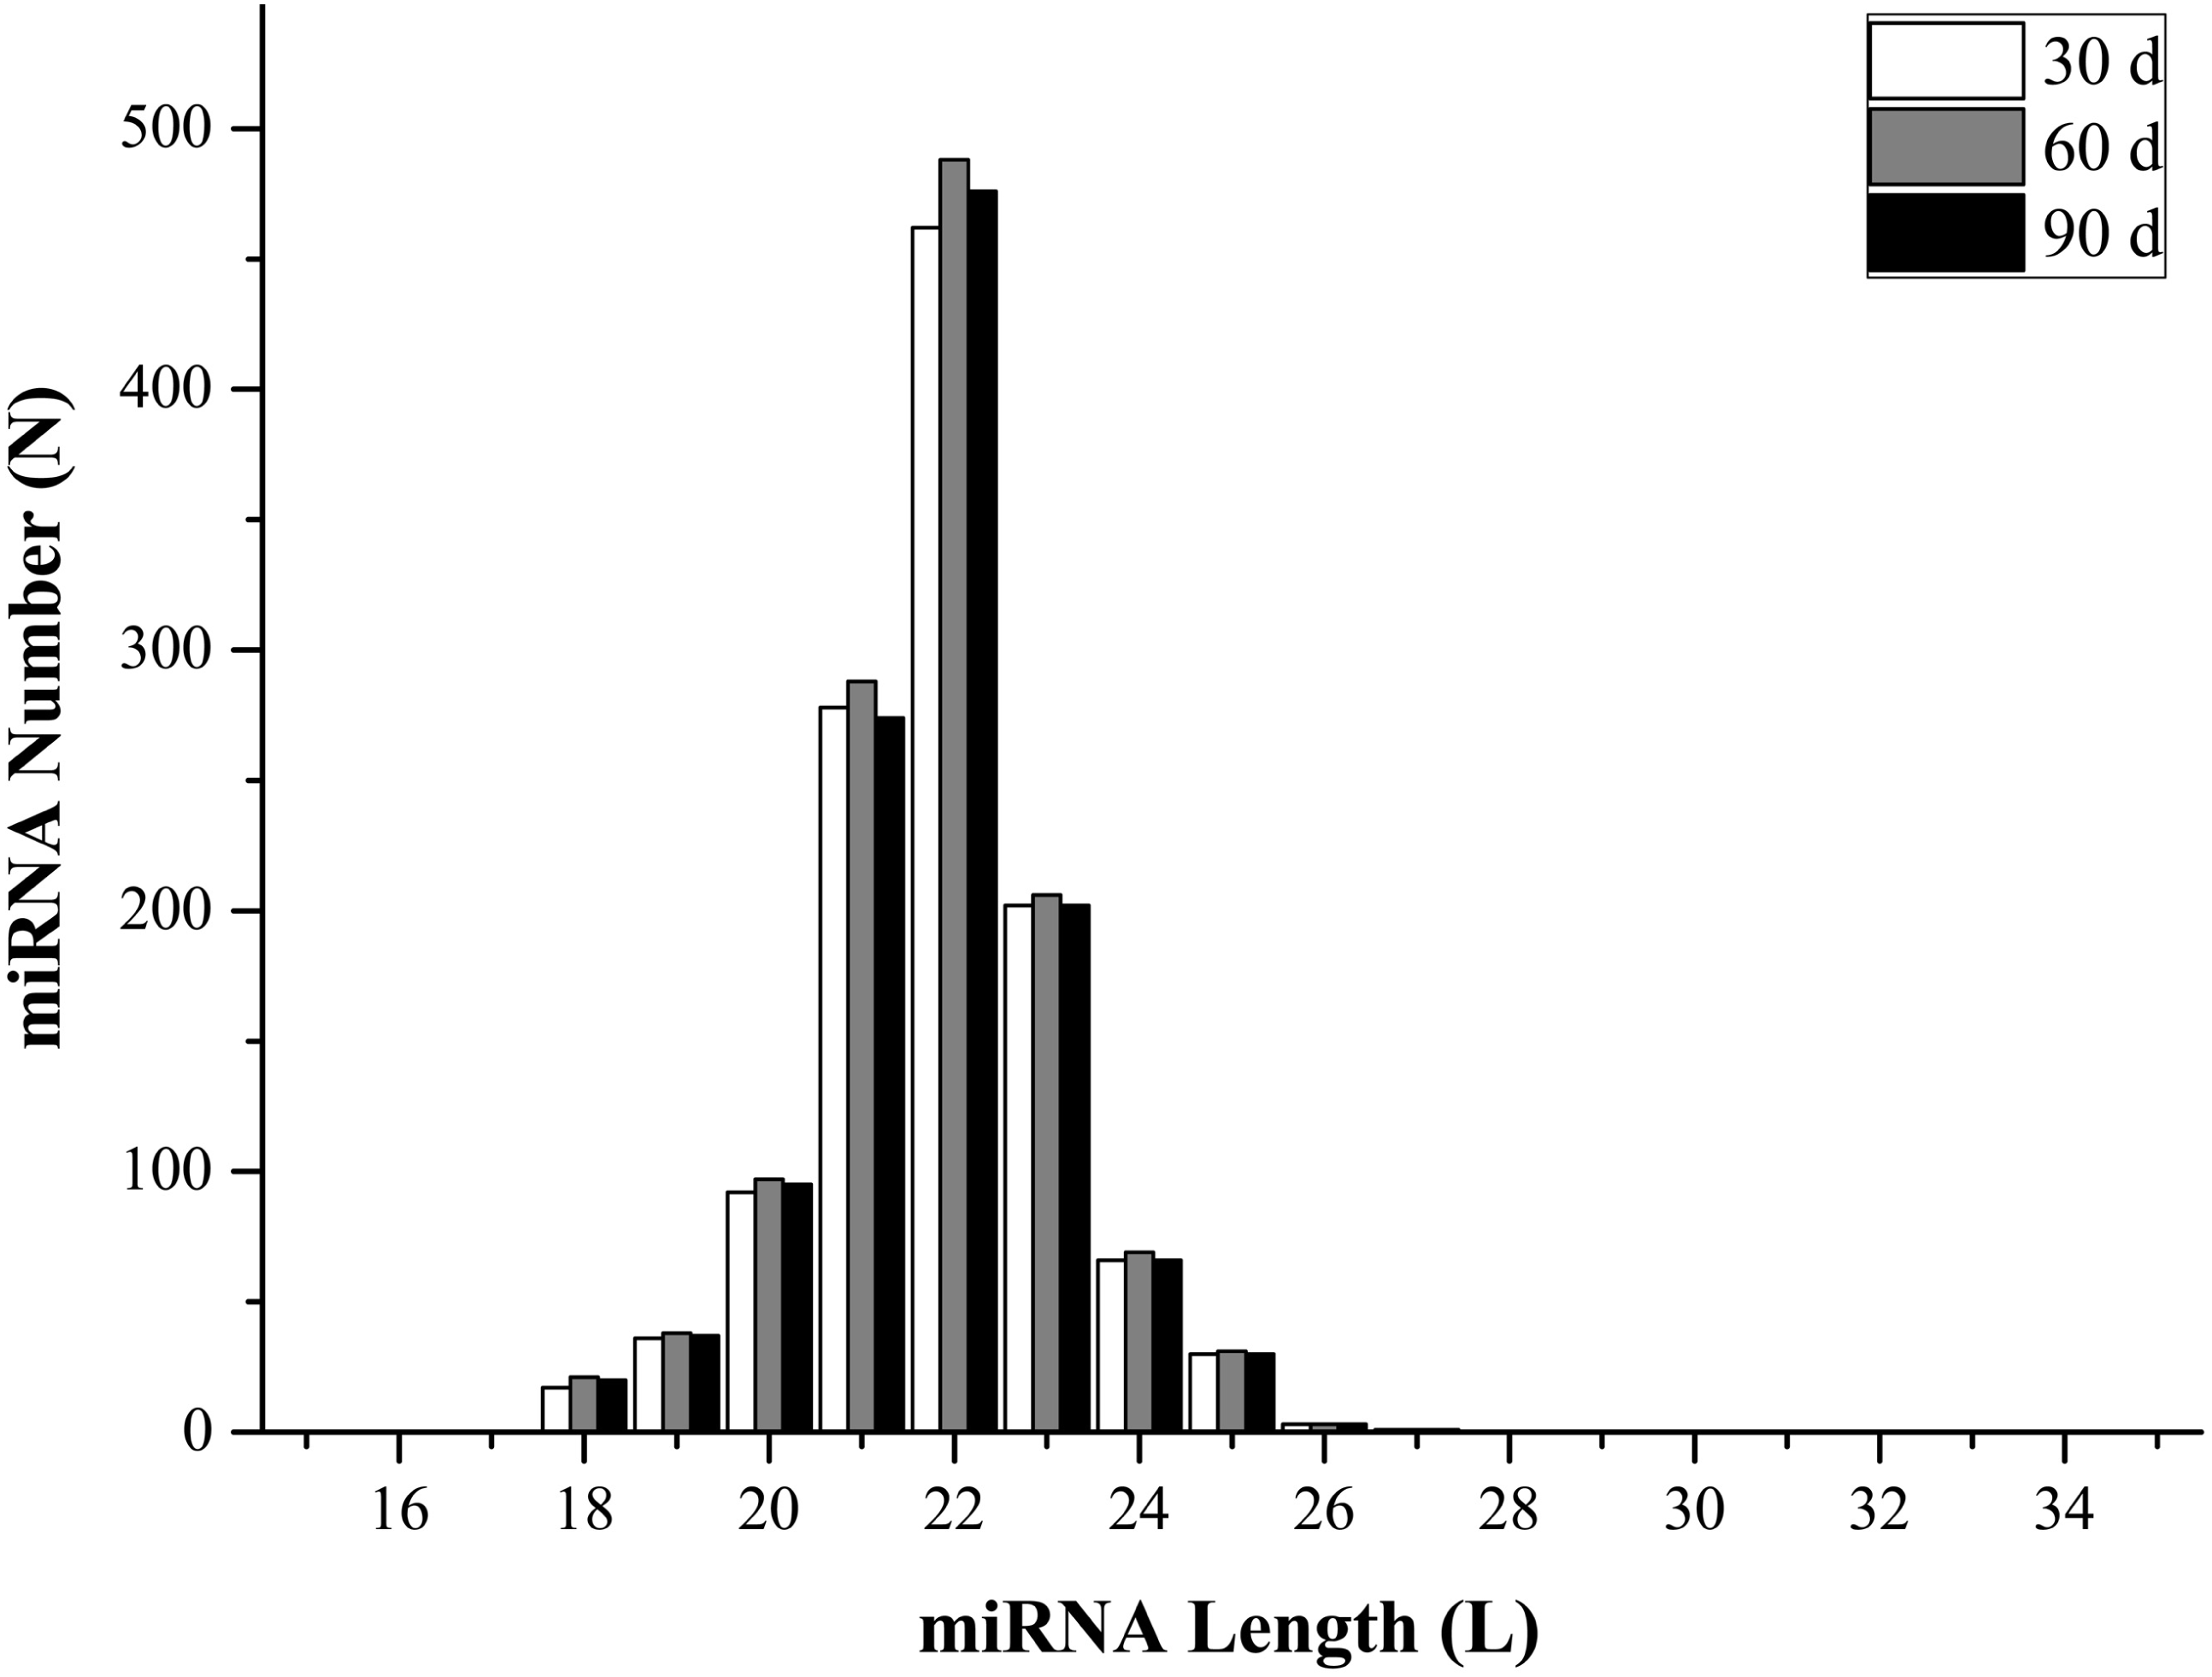
To identify miRNAs in the three libraries, all mapped reads that were 18–35 nucleotides long were compared with mature animal miRNAs in the miRBase (v21.0) database. Perfectly matched sequences were considered as known miRNAs, while the remaining sequences were designated as novel miRNAs. The analysis identified 1,073 known miRNAs (1,003, 1,052, and 1,021 from 30-, 60-, and 90-d antler tips) and 204 novel miRNAs (184, 190, and 183 from 30-, 60-, and 90-d antler tips). The size distribution of identified miRNAs was similar in all samples, and most of them changed from 20 to 24 nt, which was consistent with the typical size range of miRNAs (Fig. 1; Table S1). The most abundant size class was 22 nt, which accounted for approximately 38.92%, 39.29% and 39.53% in the three libraries. All miRNAs were classified into 188 miRNA families, with the mir-2284 family being the most represented (Table S2).
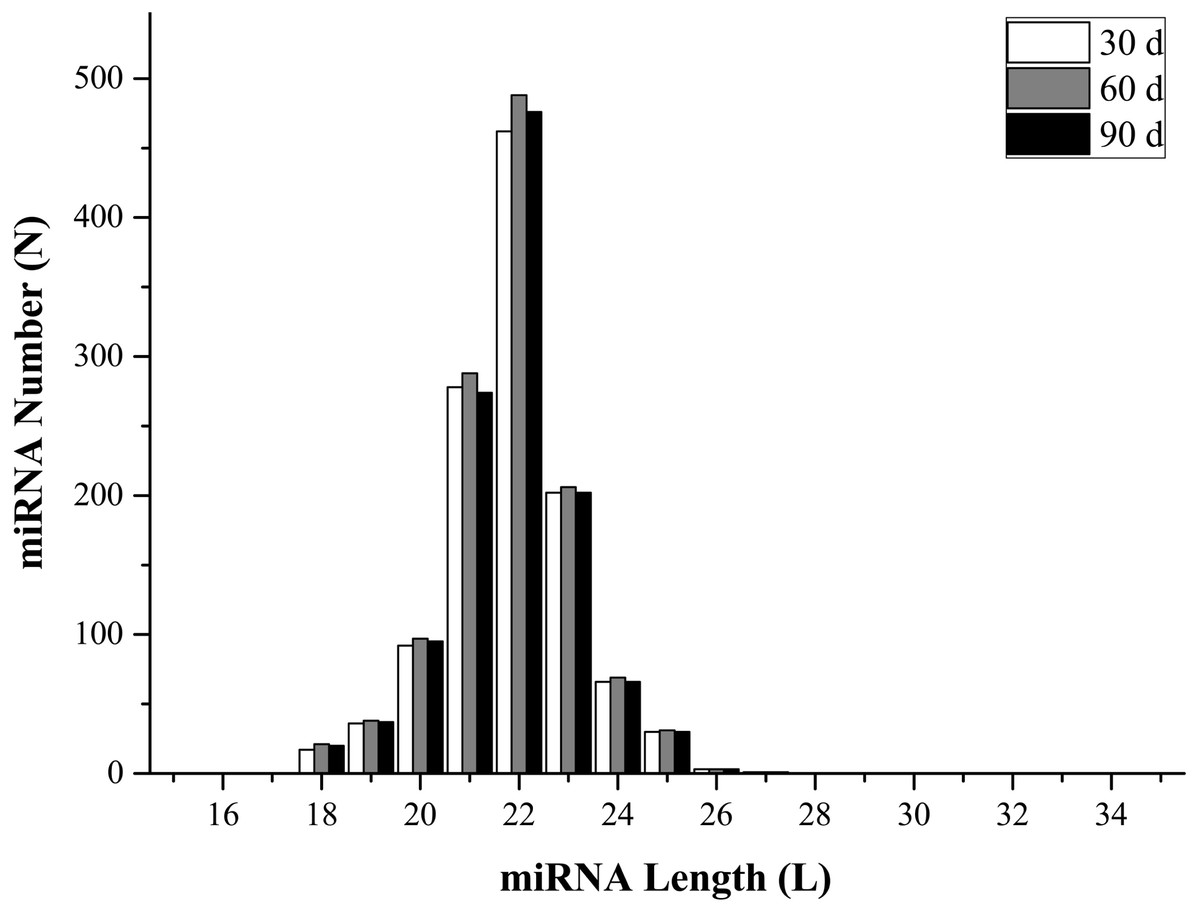
Figure 1: miRNAs length distribution.
The expression levels of each miRNA were normalized to the expression of tags per million (TPM) (Table S3). The top 20 known miRNAs with the highest number of reads (Table 3) accounted for 82.36%, 74.23%, and 76.69% of total reads from 30-, 60-, and 90-d antler cartilage tissues, respectively. The top 20 novel miRNAs also gathered the most reads (Table 4), accounting for 69.36%, 70.27%, and 79.65% of total reads from 30-, 60-, and 90-d antler cartilage tissues, respectively. Novel miRNAs had considerably lower sequencing frequencies than known miRNAs (Table S3). The same pattern has also been reported in other species, suggesting that novel miRNAs are typically weakly expressed and known miRNAs are highly expressed in different organisms.
| 30 d | 60 d | 90 d | ||||||
|---|---|---|---|---|---|---|---|---|
| miRNA | Count | TPM | miRNA | Count | TPM | miRNA | Count | TPM |
| ggo-miR-148a | 755406 | 220514.4 | ggo-miR-148a | 781385 | 181034.9 | ggo-miR-148a | 704227 | 206292 |
| aca-miR-148a-3p | 750540 | 219093.9 | aca-miR-148a-3p | 778239 | 180306 | aca-miR-148a-3p | 700427 | 205178.9 |
| bta-miR-21-5p | 215228 | 62828.29 | bta-miR-21-5p | 198752 | 46047.78 | bta-miR-21-5p | 164868 | 48295.45 |
| chi-miR-21-5p | 215227 | 62828 | chi-miR-21-5p | 198752 | 46047.78 | chi-miR-21-5p | 164866 | 48294.86 |
| sha-miR-21 | 215110 | 62793.85 | sha-miR-21 | 198623 | 46017.9 | sha-miR-21 | 164771 | 48267.03 |
| aca-miR-21-5p | 215106 | 62792.68 | aca-miR-21-5p | 198623 | 46017.9 | aca-miR-21-5p | 164766 | 48265.57 |
| ccr-let-7i | 65670 | 19170.06 | ccr-let-7i | 114404 | 26505.65 | ccr-let-7i | 74011 | 21680.34 |
| aca-let-7i-5p | 65670 | 19170.06 | aca-let-7i-5p | 114404 | 26505.65 | aca-let-7i-5p | 74011 | 21680.34 |
| ssc-let-7i | 65670 | 19170.06 | ssc-let-7i | 114404 | 26505.65 | ssc-let-7i | 74010 | 21680.05 |
| gga-let-7g-5p | 38050 | 11107.37 | gga-let-7g-5p | 55889 | 12948.62 | aca-miR-27b-3p | 41660 | 12203.63 |
| aca-let-7g | 37827 | 11042.27 | aca-let-7g | 55593 | 12880.04 | bta-miR-27b | 41660 | 12203.63 |
| aca-let-7f-5p | 26320 | 7683.204 | aca-miR-27b-3p | 53525 | 12400.92 | gga-let-7g-5p | 39633 | 11609.85 |
| ggo-let-7f | 26320 | 7683.204 | bta-miR-27b | 53525 | 12400.92 | aca-let-7g | 39451 | 11556.54 |
| aca-miR-27b-3p | 25840 | 7543.085 | aca-miR-99a-5p | 49497 | 11467.69 | aca-let-7f-5p | 28763 | 8425.661 |
| bta-miR-27b | 25840 | 7543.085 | bta-miR-99a-5p | 49497 | 11467.69 | ggo-let-7f | 28762 | 8425.368 |
| aca-let-7a-5p | 16504 | 4817.766 | oar-miR-99a | 49497 | 11467.69 | aca-miR-99a-5p | 22479 | 6584.864 |
| prd-let-7-5p | 16495 | 4815.139 | aca-let-7f-5p | 39435 | 9136.484 | bta-miR-99a-5p | 22479 | 6584.864 |
| bta-miR-199b | 15746 | 4596.495 | ggo-let-7f | 39435 | 9136.484 | oar-miR-99a | 22479 | 6584.864 |
| ssc-miR-199b-5p | 15745 | 4596.203 | aca-let-7a-5p | 30258 | 7010.314 | aca-let-7a-5p | 22389 | 6558.5 |
| aca-miR-99a-5p | 13211 | 3856.49 | prd-let-7-5p | 30254 | 7009.387 | prd-let-7-5p | 22382 | 6556.449 |
| 30 d | 60 d | 90 d | ||||||
|---|---|---|---|---|---|---|---|---|
| miRNA | Count | TPM | miRNA | Count | TPM | miRNA | Count | TPM |
| CM008037.1_299589 | 1225 | 357.596 | CM008037.1_299589 | 1537 | 356.0993 | CM008037.1_299589 | 1135 | 332.4801 |
| CM008025.1_188962 | 504 | 147.1252 | CM008025.1_188962 | 597 | 138.3157 | CM008012.1_55433 | 632 | 185.1343 |
| CM008041.1_334512 | 326 | 95.16431 | CM008022.1_160011 | 417 | 96.61249 | CM008041.1_329491 | 631 | 184.8414 |
| CM008022.1_160011 | 220 | 64.22131 | CM008027.1_215935 | 283 | 65.56675 | CM008037.1_302513 | 631 | 184.8414 |
| CM008008.1_9244 | 137 | 39.99236 | CM008041.1_334512 | 275 | 63.71327 | CM008025.1_188962 | 541 | 158.4773 |
| CM008021.1_154122 | 121 | 35.32172 | CM008021.1_154122 | 265 | 61.39643 | CM008022.1_160011 | 316 | 92.56715 |
| CM008029.1_241215 | 118 | 34.44598 | CM008021.1_149700 | 182 | 42.1666 | CM008034.1_284828 | 287 | 84.07206 |
| CM008021.1_149700 | 113 | 32.9864 | CM008029.1_241215 | 164 | 37.99628 | CM008041.1_334512 | 264 | 77.33458 |
| CM008027.1_215935 | 104 | 30.35917 | CM008008.1_9244 | 120 | 27.80216 | CM008027.1_215935 | 154 | 45.11184 |
| CM008020.1_143075 | 93 | 27.1481 | CM008026.1_198184 | 97 | 22.47341 | CM008029.1_241215 | 139 | 40.71783 |
| CM008027.1_214244 | 86 | 25.1047 | CM008041.1_329491 | 85 | 19.69319 | CM008008.1_9244 | 125 | 36.61675 |
| CM008041.1_332283 | 82 | 23.93704 | CM008037.1_302513 | 85 | 19.69319 | CM008021.1_149700 | 119 | 34.85915 |
| CM008022.1_159134 | 71 | 20.72597 | CM008012.1_55433 | 85 | 19.69319 | CM008021.1_154122 | 84 | 24.60646 |
| CM008025.1_184228 | 71 | 20.72597 | CM008041.1_332283 | 82 | 18.99814 | CM008021.1_147678 | 66 | 19.33365 |
| CM008012.1_63603 | 60 | 17.5149 | CM008019.1_131447 | 77 | 17.83972 | CM008020.1_143075 | 65 | 19.04071 |
| CM008026.1_198184 | 53 | 15.4715 | CM008027.1_214244 | 71 | 16.44961 | CM008018.1_117444 | 63 | 18.45484 |
| CM008020.1_147456 | 51 | 14.88767 | CM008012.1_63603 | 66 | 15.29119 | CM008012.1_63603 | 60 | 17.57604 |
| CM008016.1_98716 | 50 | 14.59575 | CM008016.1_98716 | 65 | 15.0595 | CM008025.1_184228 | 58 | 16.99017 |
| CM008021.1_151843 | 43 | 12.55235 | CM008036.1_292916 | 60 | 13.90108 | CM008022.1_159134 | 57 | 16.69724 |
| CM008021.1_150571 | 43 | 12.55235 | CM008020.1_147456 | 58 | 13.43771 | CM008027.1_214244 | 51 | 14.93964 |
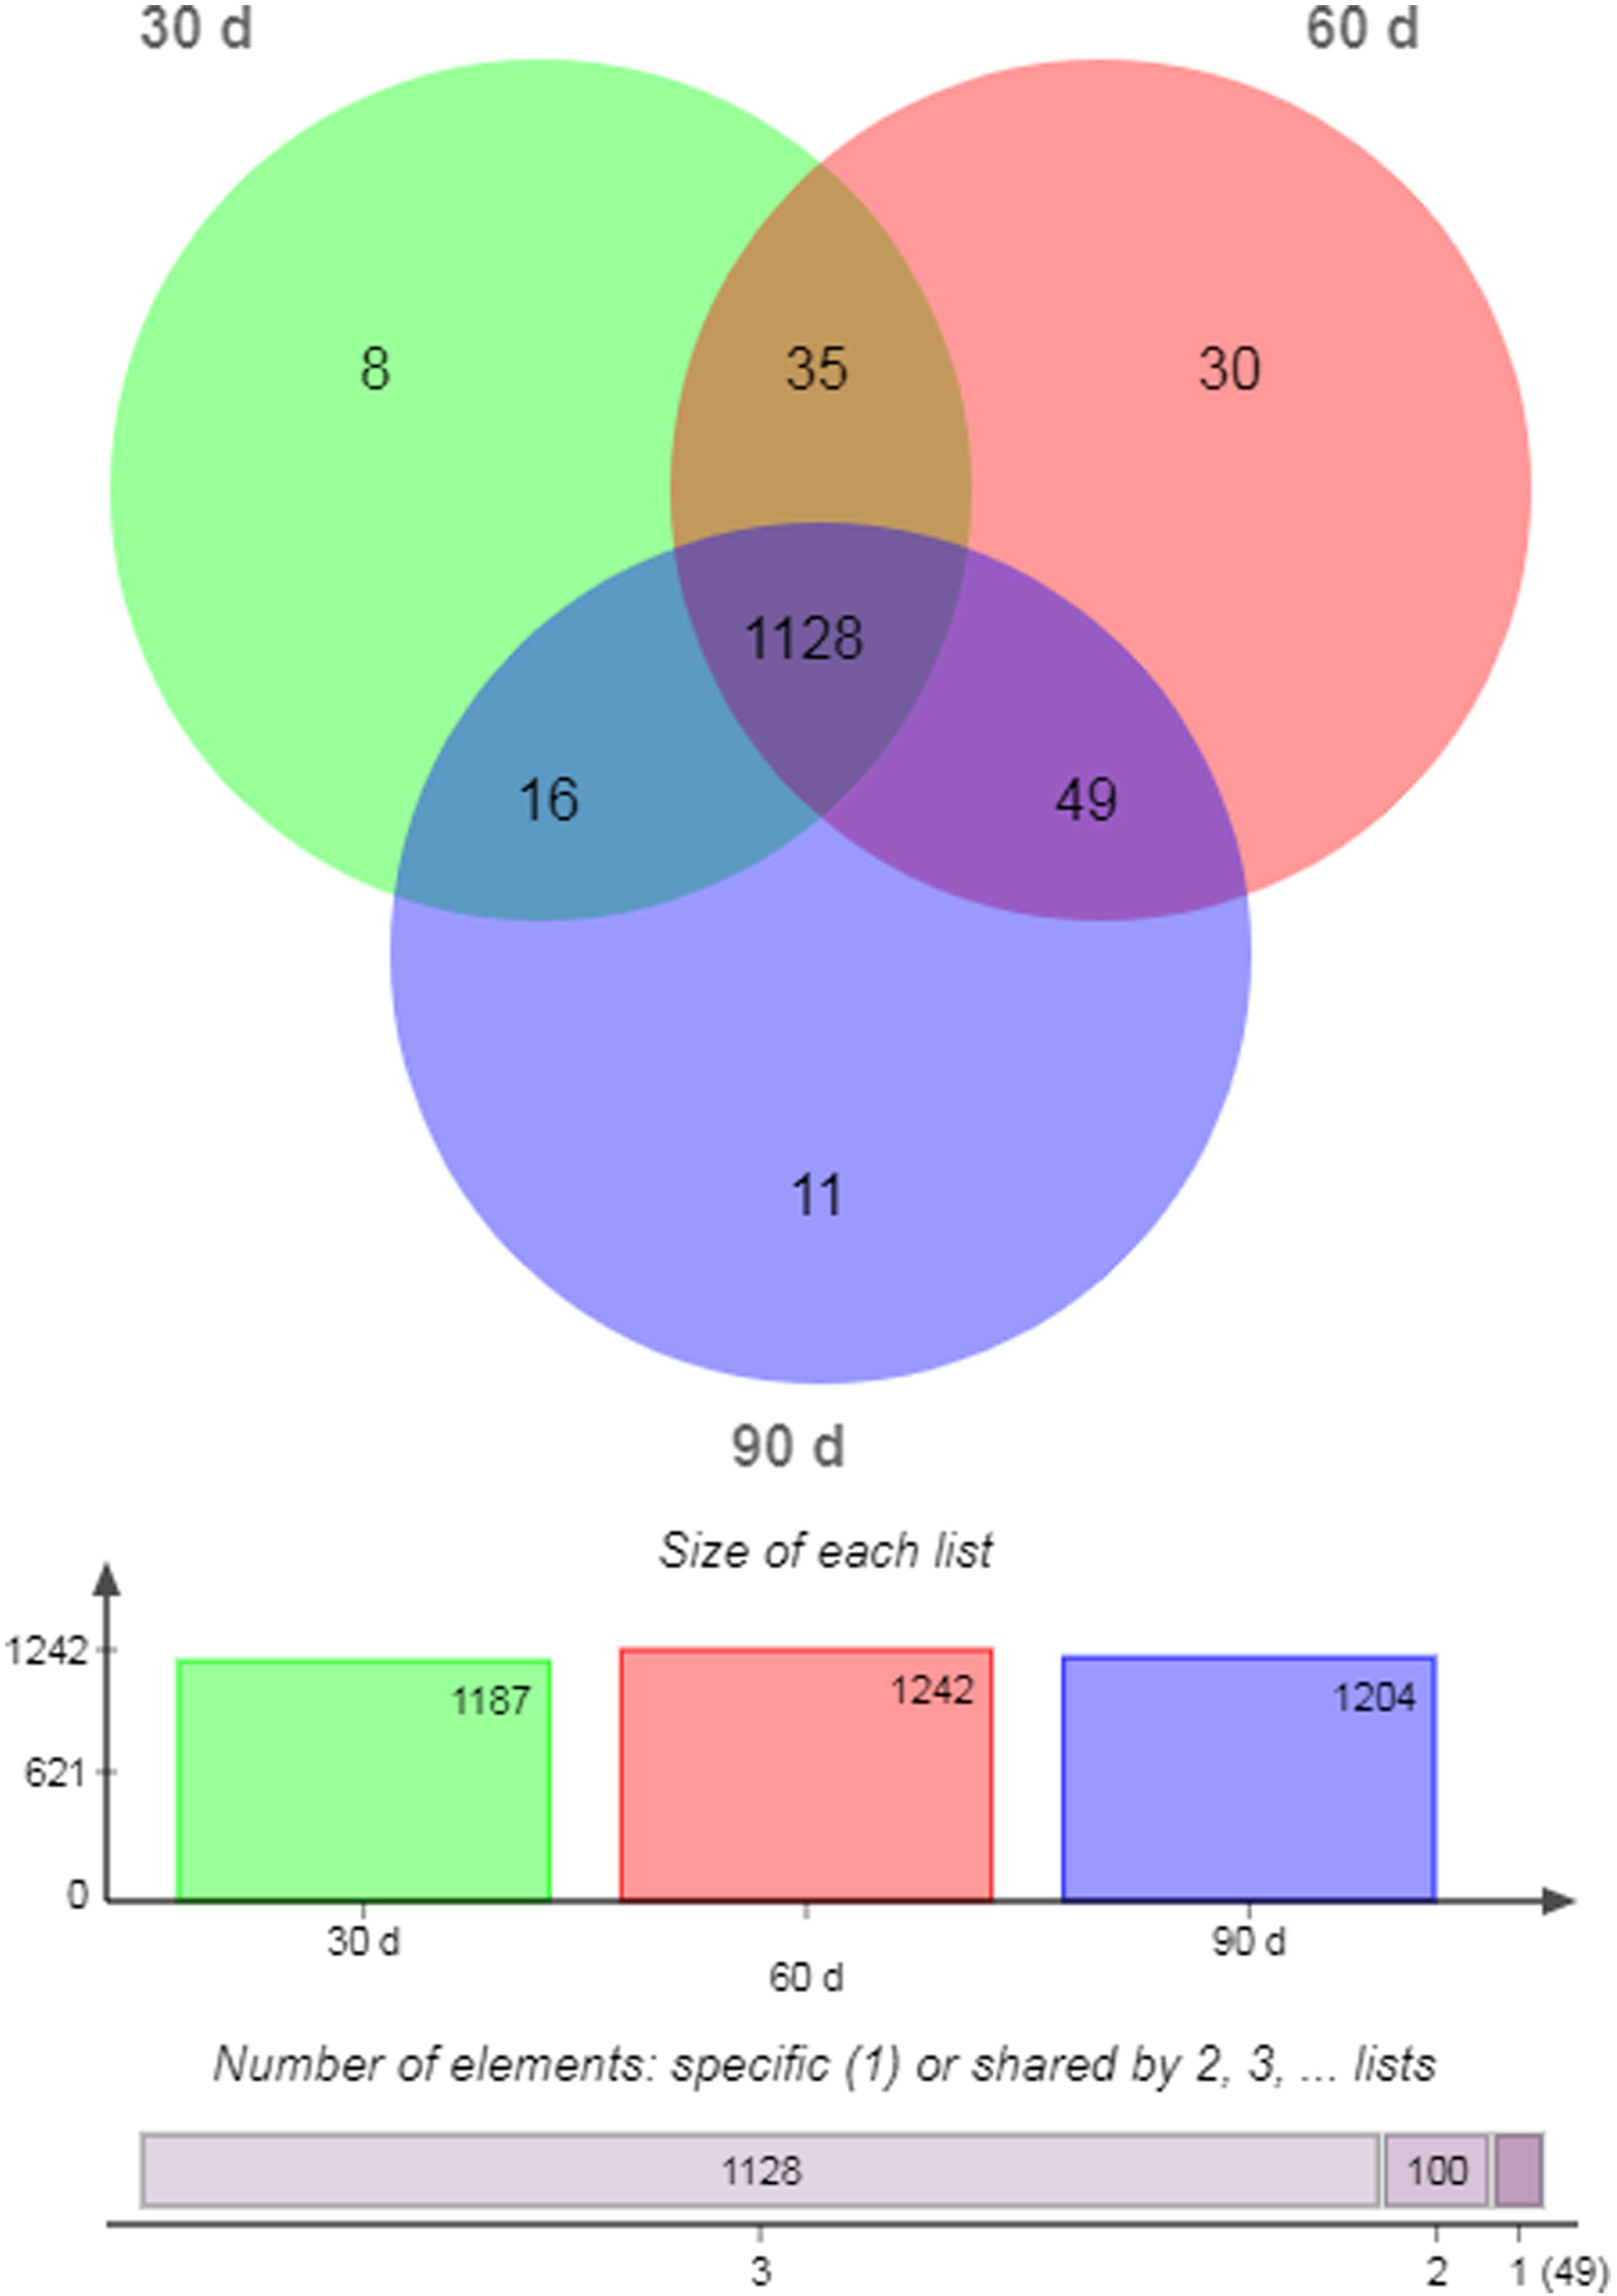
There were 1,128 unique miRNAs co-expressed in 30- (95.03%), 60- (90.82%), and 90-d (93.69%) antler cartilage tissues (Fig. 2). The most abundant miRNA was ggo-miR-148a, then aca-miR-148a-3p, bta-miR-21-5p, chi-miR-21-5p, and sha-miR-21 (Table 3). In addition, eight (0.67%), 30 (2.42%), and 11 (0.91%) miRNAs were specifically expressed (SEMs) in each sample (Fig. 2; Table 5).
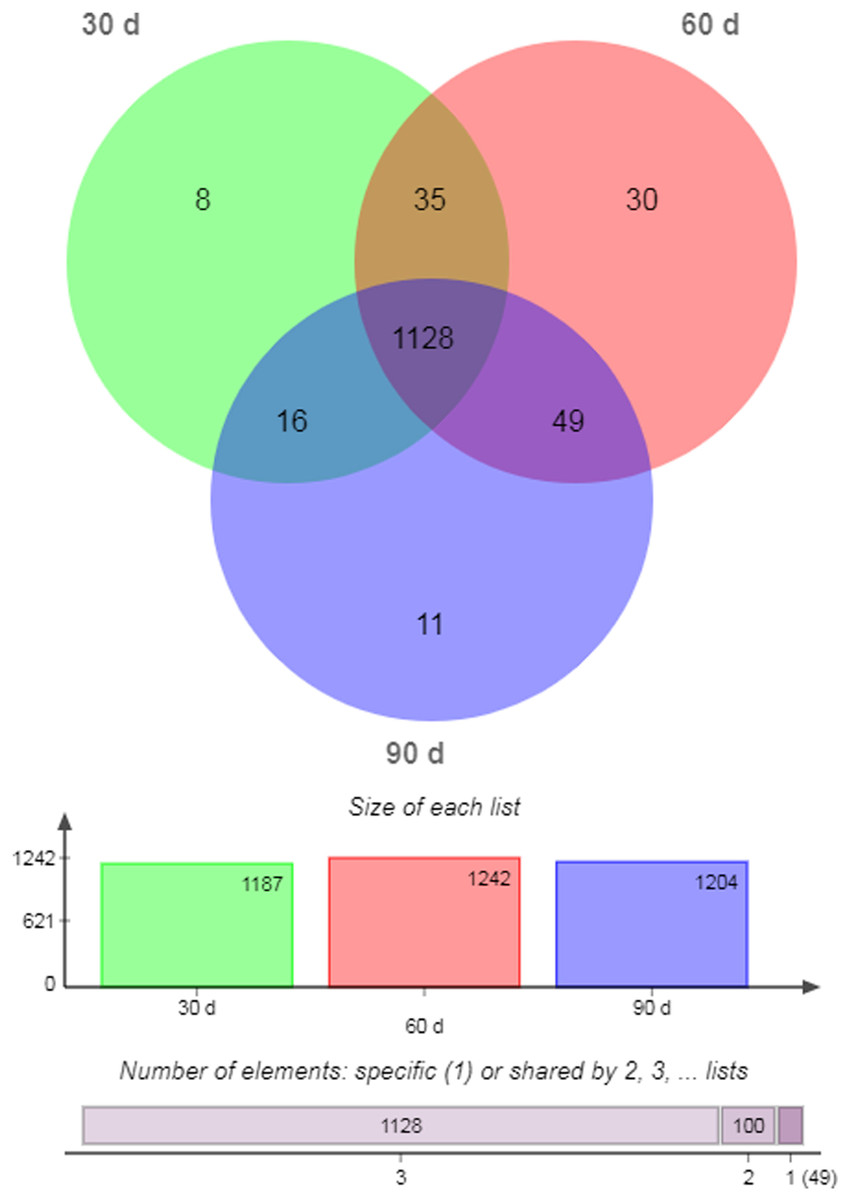
Figure 2: Venn diagram of all miRNAs.
| 30 d | 60 d | 90 d | ||||||
|---|---|---|---|---|---|---|---|---|
| miRNA | Count | TPM | miRNA | Count | TPM | miRNA | Count | TPM |
| aja-miR-3120 | 2 | 0.6102 | aga-miR-10 | 3 | 0.7211 | bta-miR-105a | 1 | 0.2779 |
| bta-miR-3154 | 1 | 0.3051 | bma-miR-92 | 1 | 0.2524 | cgr-miR-128-5p | 1 | 0.2779 |
| cgr-miR-23a-5p | 1 | 0.2912 | bta-miR-154a | 1 | 0.2294 | dre-miR-181b-3p | 1 | 0.2906 |
| cgr-miR-29b-5p | 2 | 0.5339 | bta-miR-202 | 1 | 0.2404 | eca-miR-302d | 1 | 0.2779 |
| eca-miR-421 | 1 | 0.3051 | bta-miR-2366 | 1 | 0.2294 | hsa-miR-181b-2-3p | 1 | 0.3196 |
| CM008010.1_21055 | 6 | 1.8306 | bta-miR-490 | 3 | 0.6883 | mdo-miR-218-2-3p | 1 | 0.3044 |
| CM008025.1_186565 | 2 | 0.5825 | bta-miR-544a | 1 | 0.2294 | mml-miR-7178-5p | 1 | 0.2906 |
| CM008038.1_307839 | 8 | 2.2285 | bta-miR-767 | 1 | 0.2195 | mmu-miR-128-1-5p | 1 | 0.3044 |
| bta-miR-885 | 5 | 1.1472 | CM008015.1_78022 | 10 | 3.1962 | |||
| cfa-miR-377 | 1 | 0.2294 | CM008020.1_145882 | 4 | 1.1117 | |||
| cgr-miR-103-5p | 1 | 0.2103 | CM008027.1_215433 | 5 | 1.4528 | |||
| cgr-miR-505-5p | 2 | 0.4389 | ||||||
| chi-miR-324-3p | 1 | 0.2404 | ||||||
| chi-miR-33b-3p | 1 | 0.2404 | ||||||
| chi-miR-411b-3p | 9 | 2.1633 | ||||||
| chi-miR-491-3p | 1 | 0.2294 | ||||||
| gga-miR-103-2-5p | 1 | 0.2195 | ||||||
| hsa-miR-324-3p | 1 | 0.2524 | ||||||
| hsa-miR-34a-3p | 1 | 0.2294 | ||||||
| mdo-miR-34a-3p | 1 | 0.2294 | ||||||
| mml-miR-3059-5p | 1 | 0.2294 | ||||||
| mmu-miR-324-3p | 1 | 0.2524 | ||||||
| oan-miR-145-5p | 1 | 0.2657 | ||||||
| oar-miR-544-3p | 1 | 0.2404 | ||||||
| ssa-miR-144-3p | 2 | 0.5048 | ||||||
| CM008012.1_49180 | 2 | 0.4807 | ||||||
| CM008012.1_53957 | 2 | 0.4589 | ||||||
| CM008022.1_167031 | 2 | 0.4807 | ||||||
| CM008025.1_186278 | 2 | 0.4807 | ||||||
| CM008039.1_315920 | 13 | 3.1248 | ||||||
Differential expression analysis of miRNAs
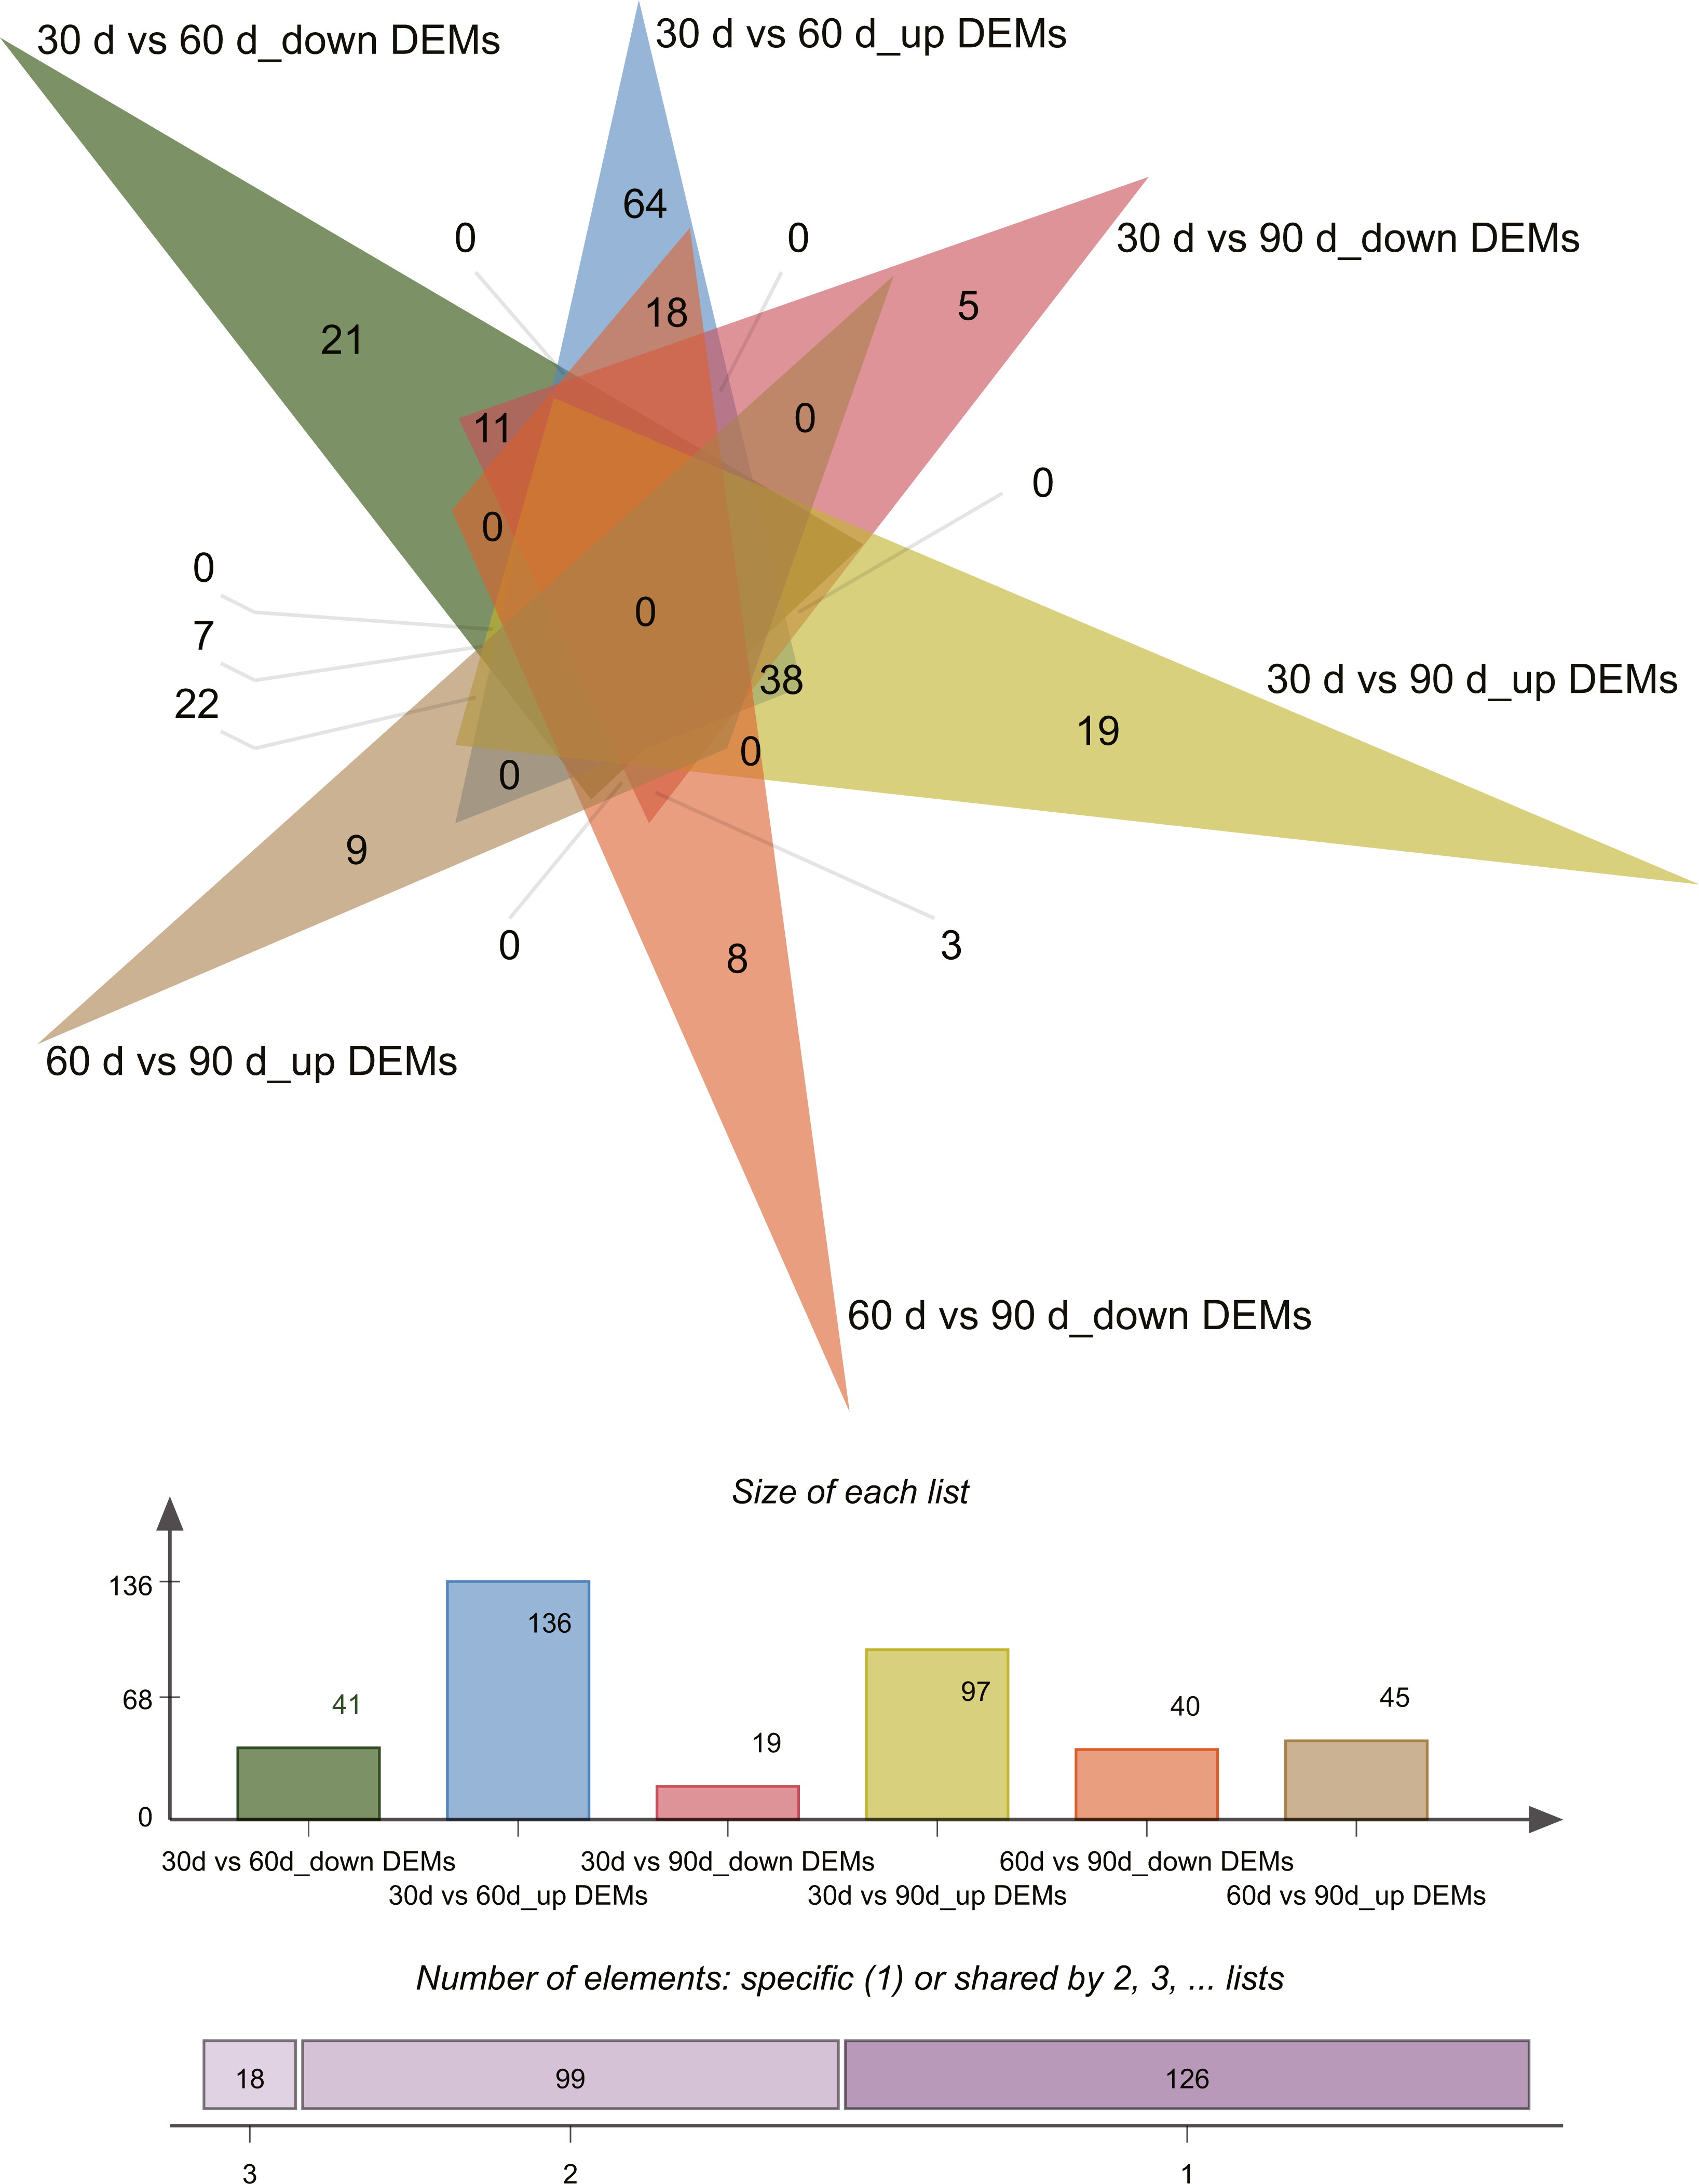
Differential expression analysis (| log2 fold change [FC] values | ≥ 1 and P ≤ 0.05) revealed 243 differentially expressed miRNAs (DEMs) across the three growth stages in this study (Tables S4–S5). Pairwise comparisons of 30 d vs. 60 d, 30 d vs. 90 d, and 60 d vs. 90 d revealed 177 (136 upregulated and 41 downregulated), 116 (97 upregulated and 19 downregulated), and 85 (45 upregulated and 40 downregulated) DEMs, respectively. Venn diagrams of DEMs in the three pairwise comparisons are presented in Fig. 3.

Figure 3: Venn diagram of differentially expressed miRNAs.
To identify key miRNAs controlling rapid antler growth, we selected 25 DEMs that had different expression patterns in the 30 d vs. 60 d and 60 d vs. 90 d comparisons only (Table 6). These are the miRNAs that likely play important roles in antler development during RGS at day 60. Among the 25 DEMs, cfa-miR-146b has the highest expression in 60 d, followed by cgr-miR-146b-5p, and bta-miR-146b, bta-miR-27a-5p, and cgr-miR-181a-3p. Two DEMs were specifically expressed in 60 d antler cartilage tissue, namely chi-miR-411b-3p and CM008039.1_315920. We were more interested in the potential biological function of novel miRNA CM008039.1_315920.
MiRNA target prediction and functional annotation of candidate target genes
MiRNAs usually act via translational repression and/or mRNA cleavage, but some evidence shows that they can also upregulate translation through diverse mechanisms. The rapid growth stage is a special period in the growth process of antler velvet; thus, we pay more attention to miRNAs in 60d. In this study, the target genes of 25 DEMs, 30 miRNAs specifically expressed in 60 d and novel miRNA CM008039.1_315920 were predicted. In particular, 726, 1,759 and 139 targets were predicted for 25 selected DEMs, specifically expressed miRNAs in 60 d and CM008039.1_315920, respectively. We then functionally annotated candidate target genes by using Gene Ontology (GO) and Kyoto Encyclopedia of Genes and Genomes (KEGG) analyses.
The GO analysis showed that 726 target genes of the 25 DEMs were classified into 52 functional subcategories. “cellular process” (431 genes), “cell part” (487 genes) and “cell” (486 genes), and “binding” (397 genes) were the top enriched GO terms under the biological process (BP), cellular component (CC), and molecular function (MF) categories, respectively (Fig. 4A). For the specifically expressed miRNAs in 60 d, 1,759 target genes were classified into 53 functional subcategories. Similarly, “cellular process” (1,028 genes) “cell” (1,169 genes) and “binding” (943 genes) were the top enriched GO terms under BP, CC, and MF (Fig. 4B). For novel miRNA CM008039.1_315920, 139 target genes were classified into 44 functional subcategories. “cellular process” (89 genes), “cell part” (98 genes) and “binding” (81 genes) were also the top enriched GO terms under BP, CC, and MF (Fig. 4C).
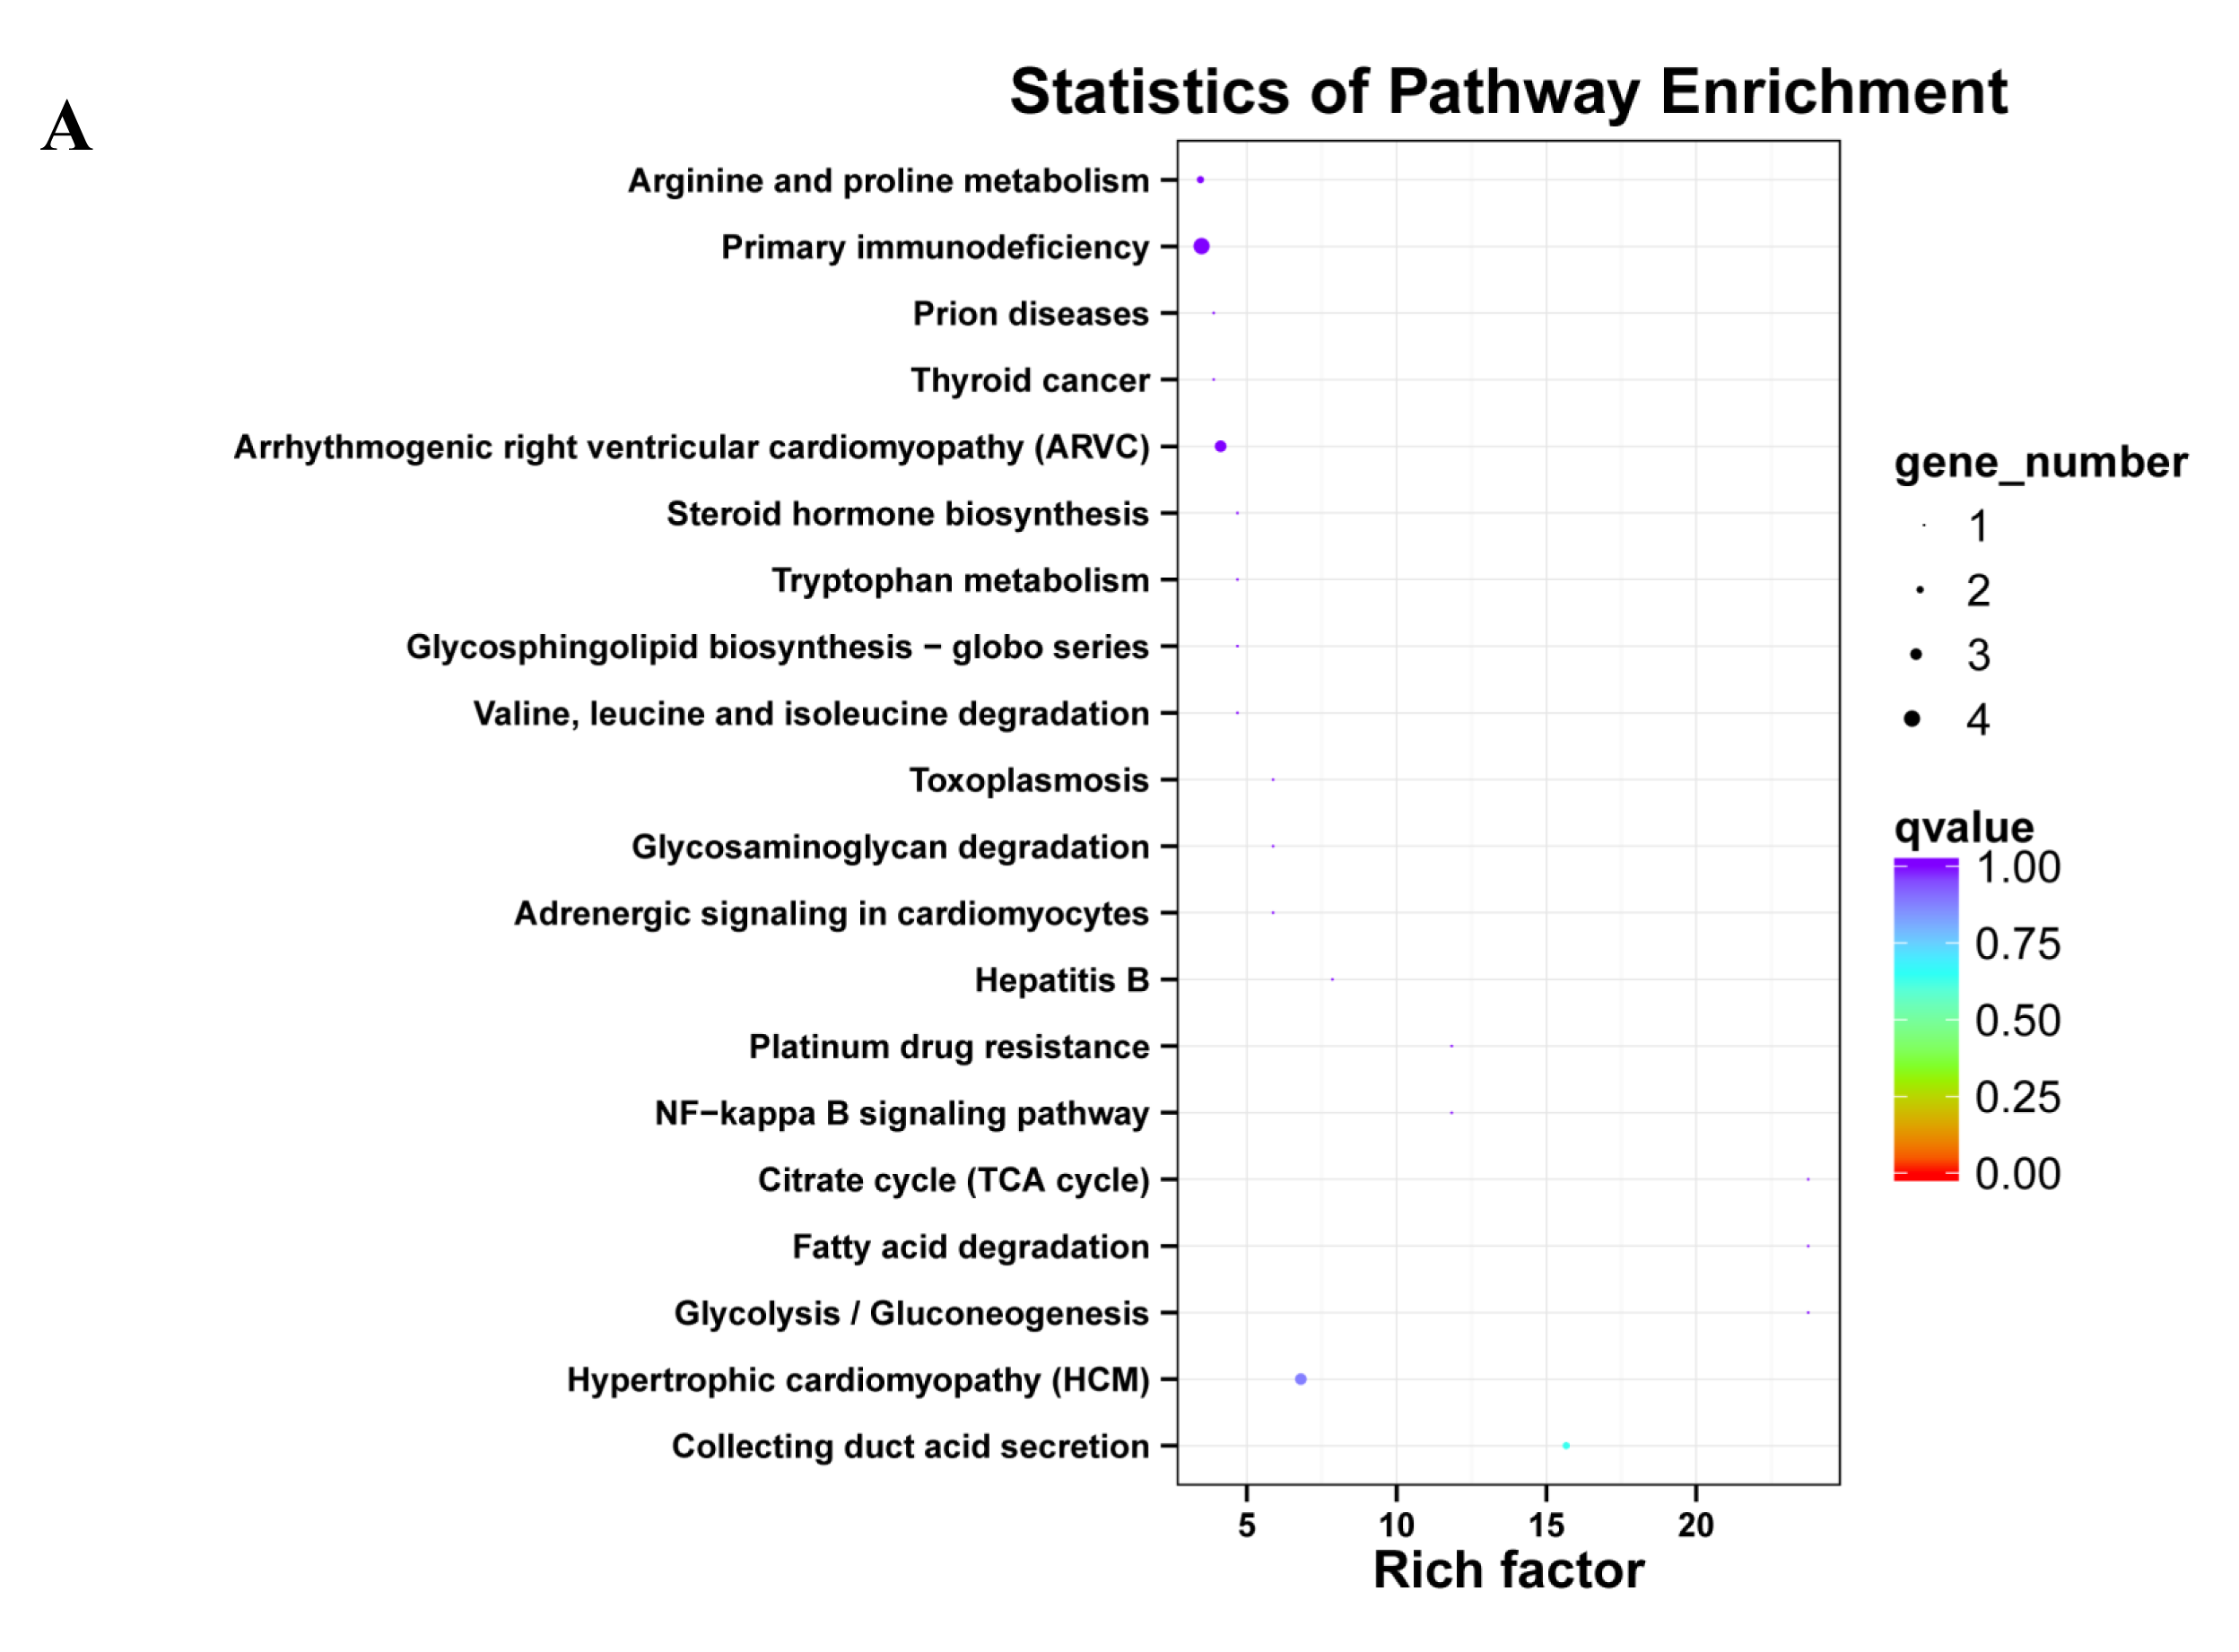
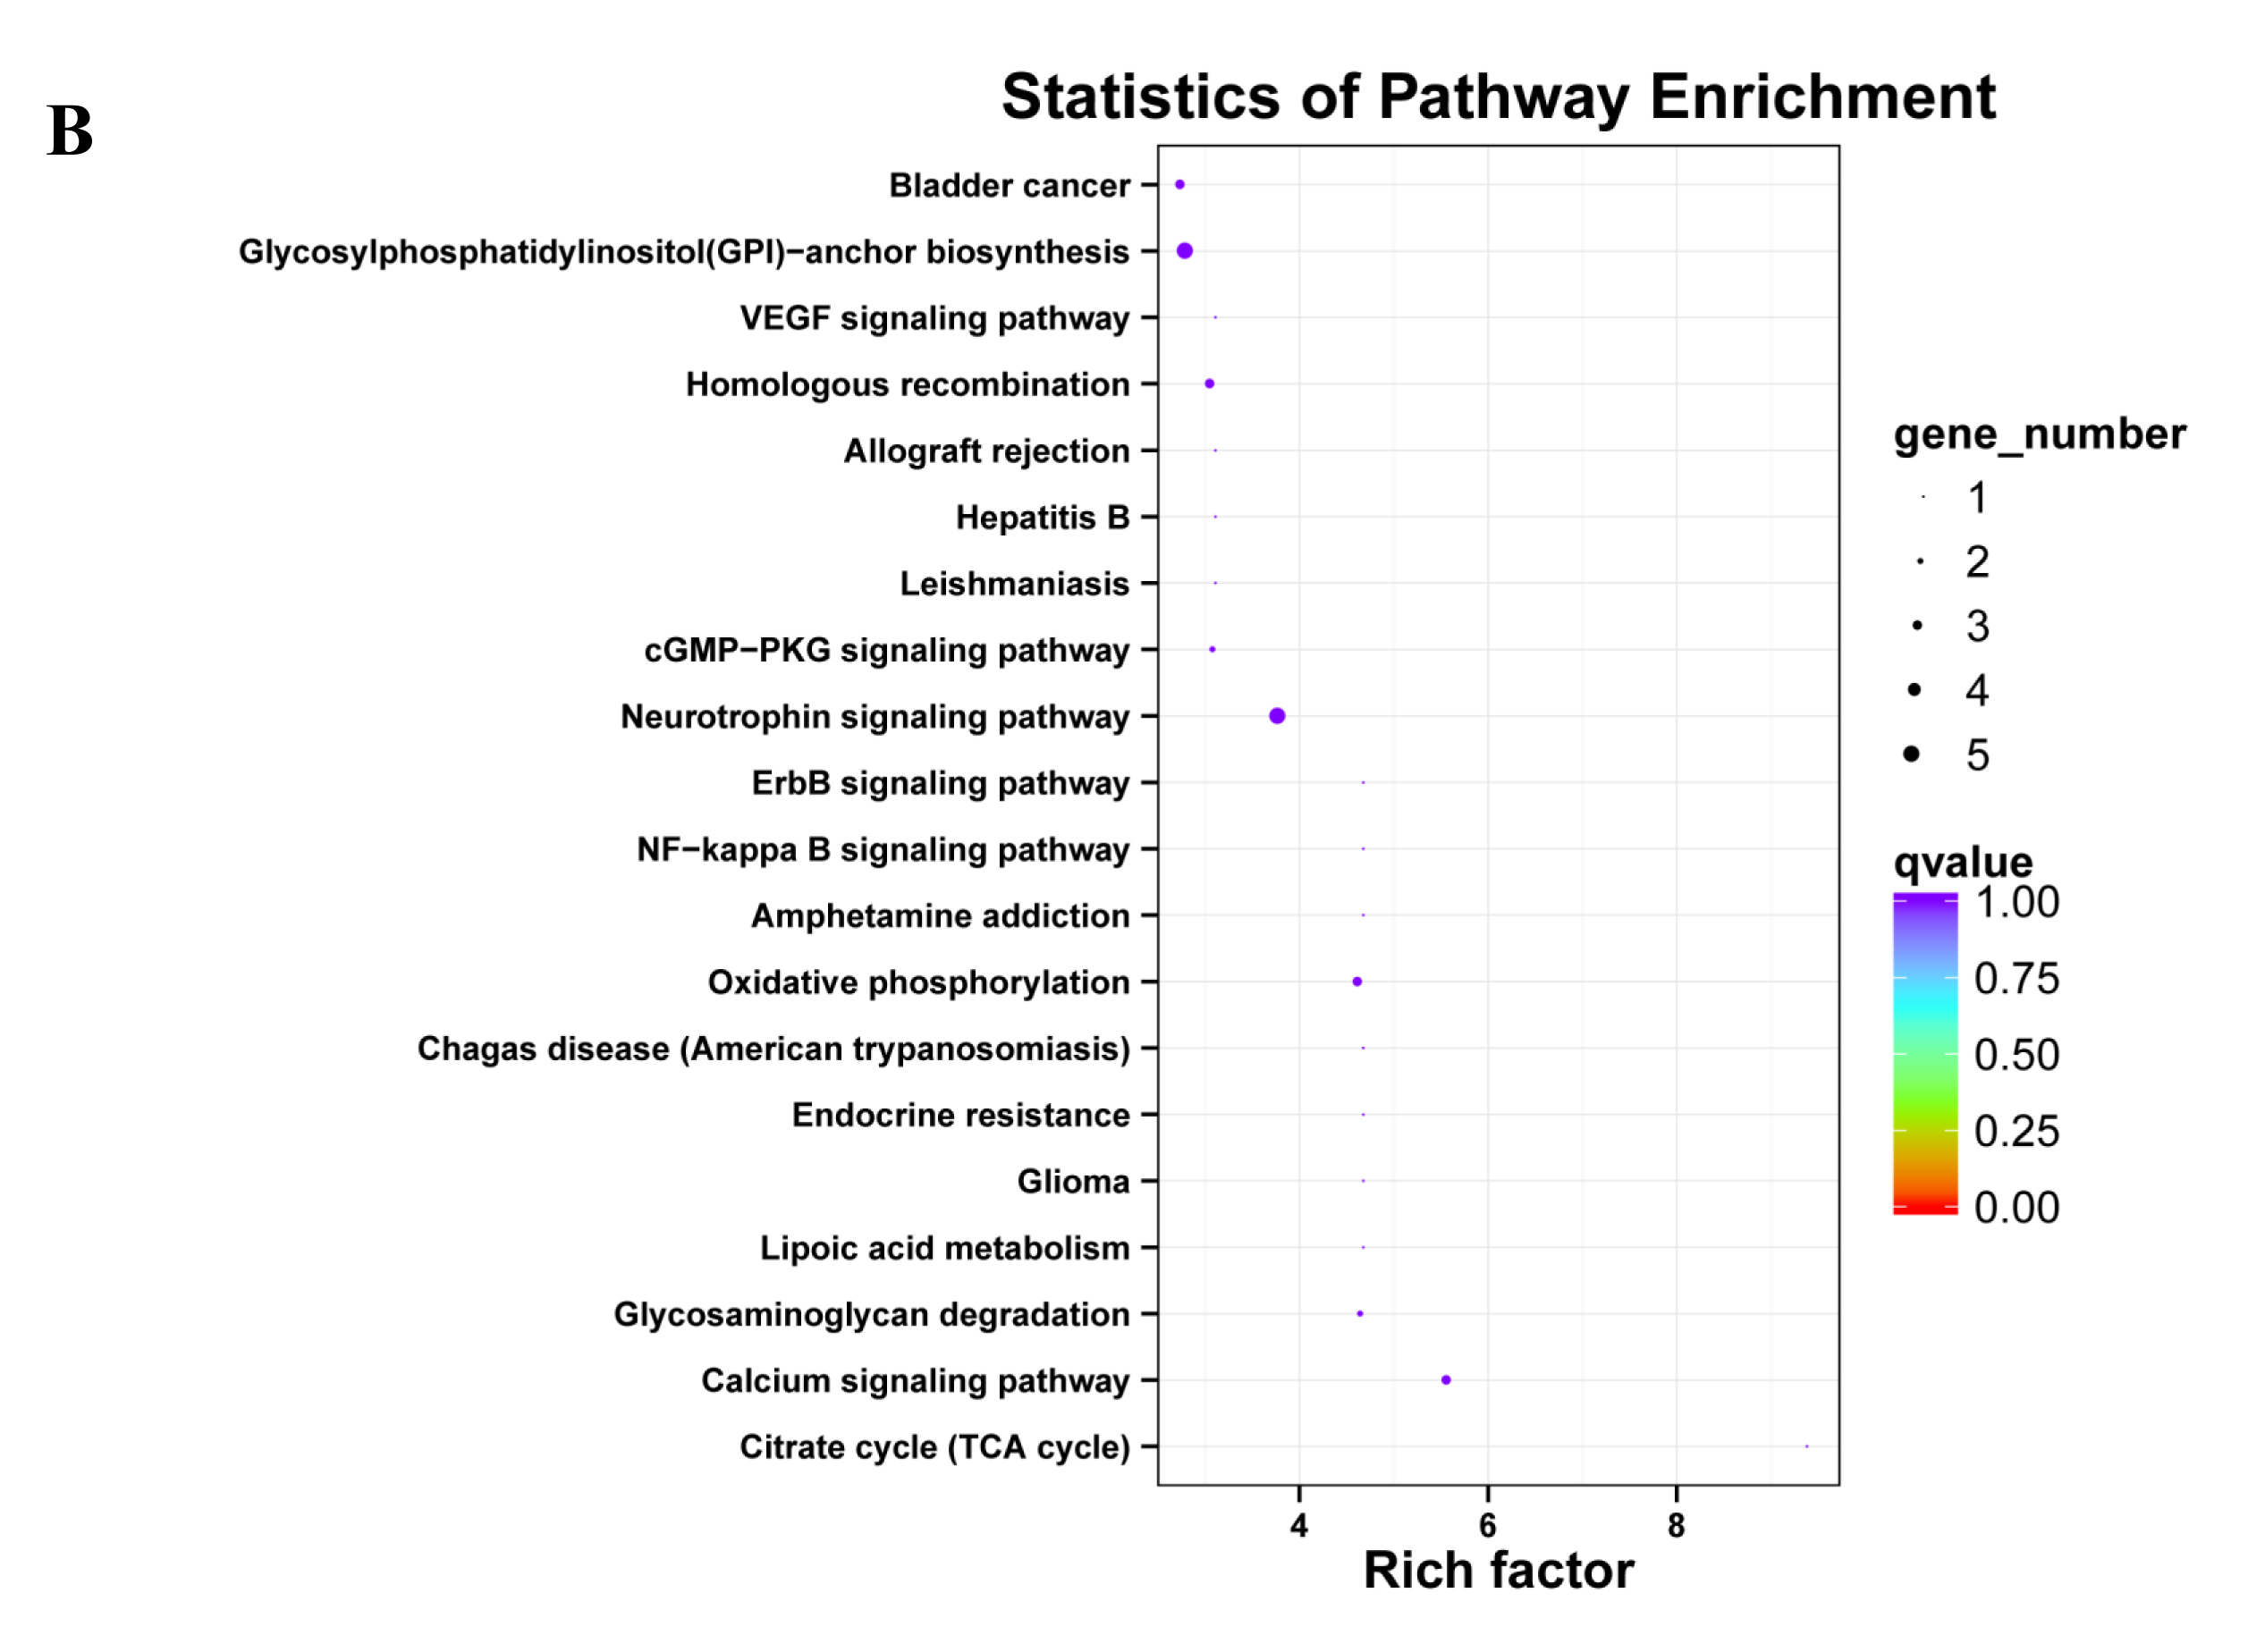
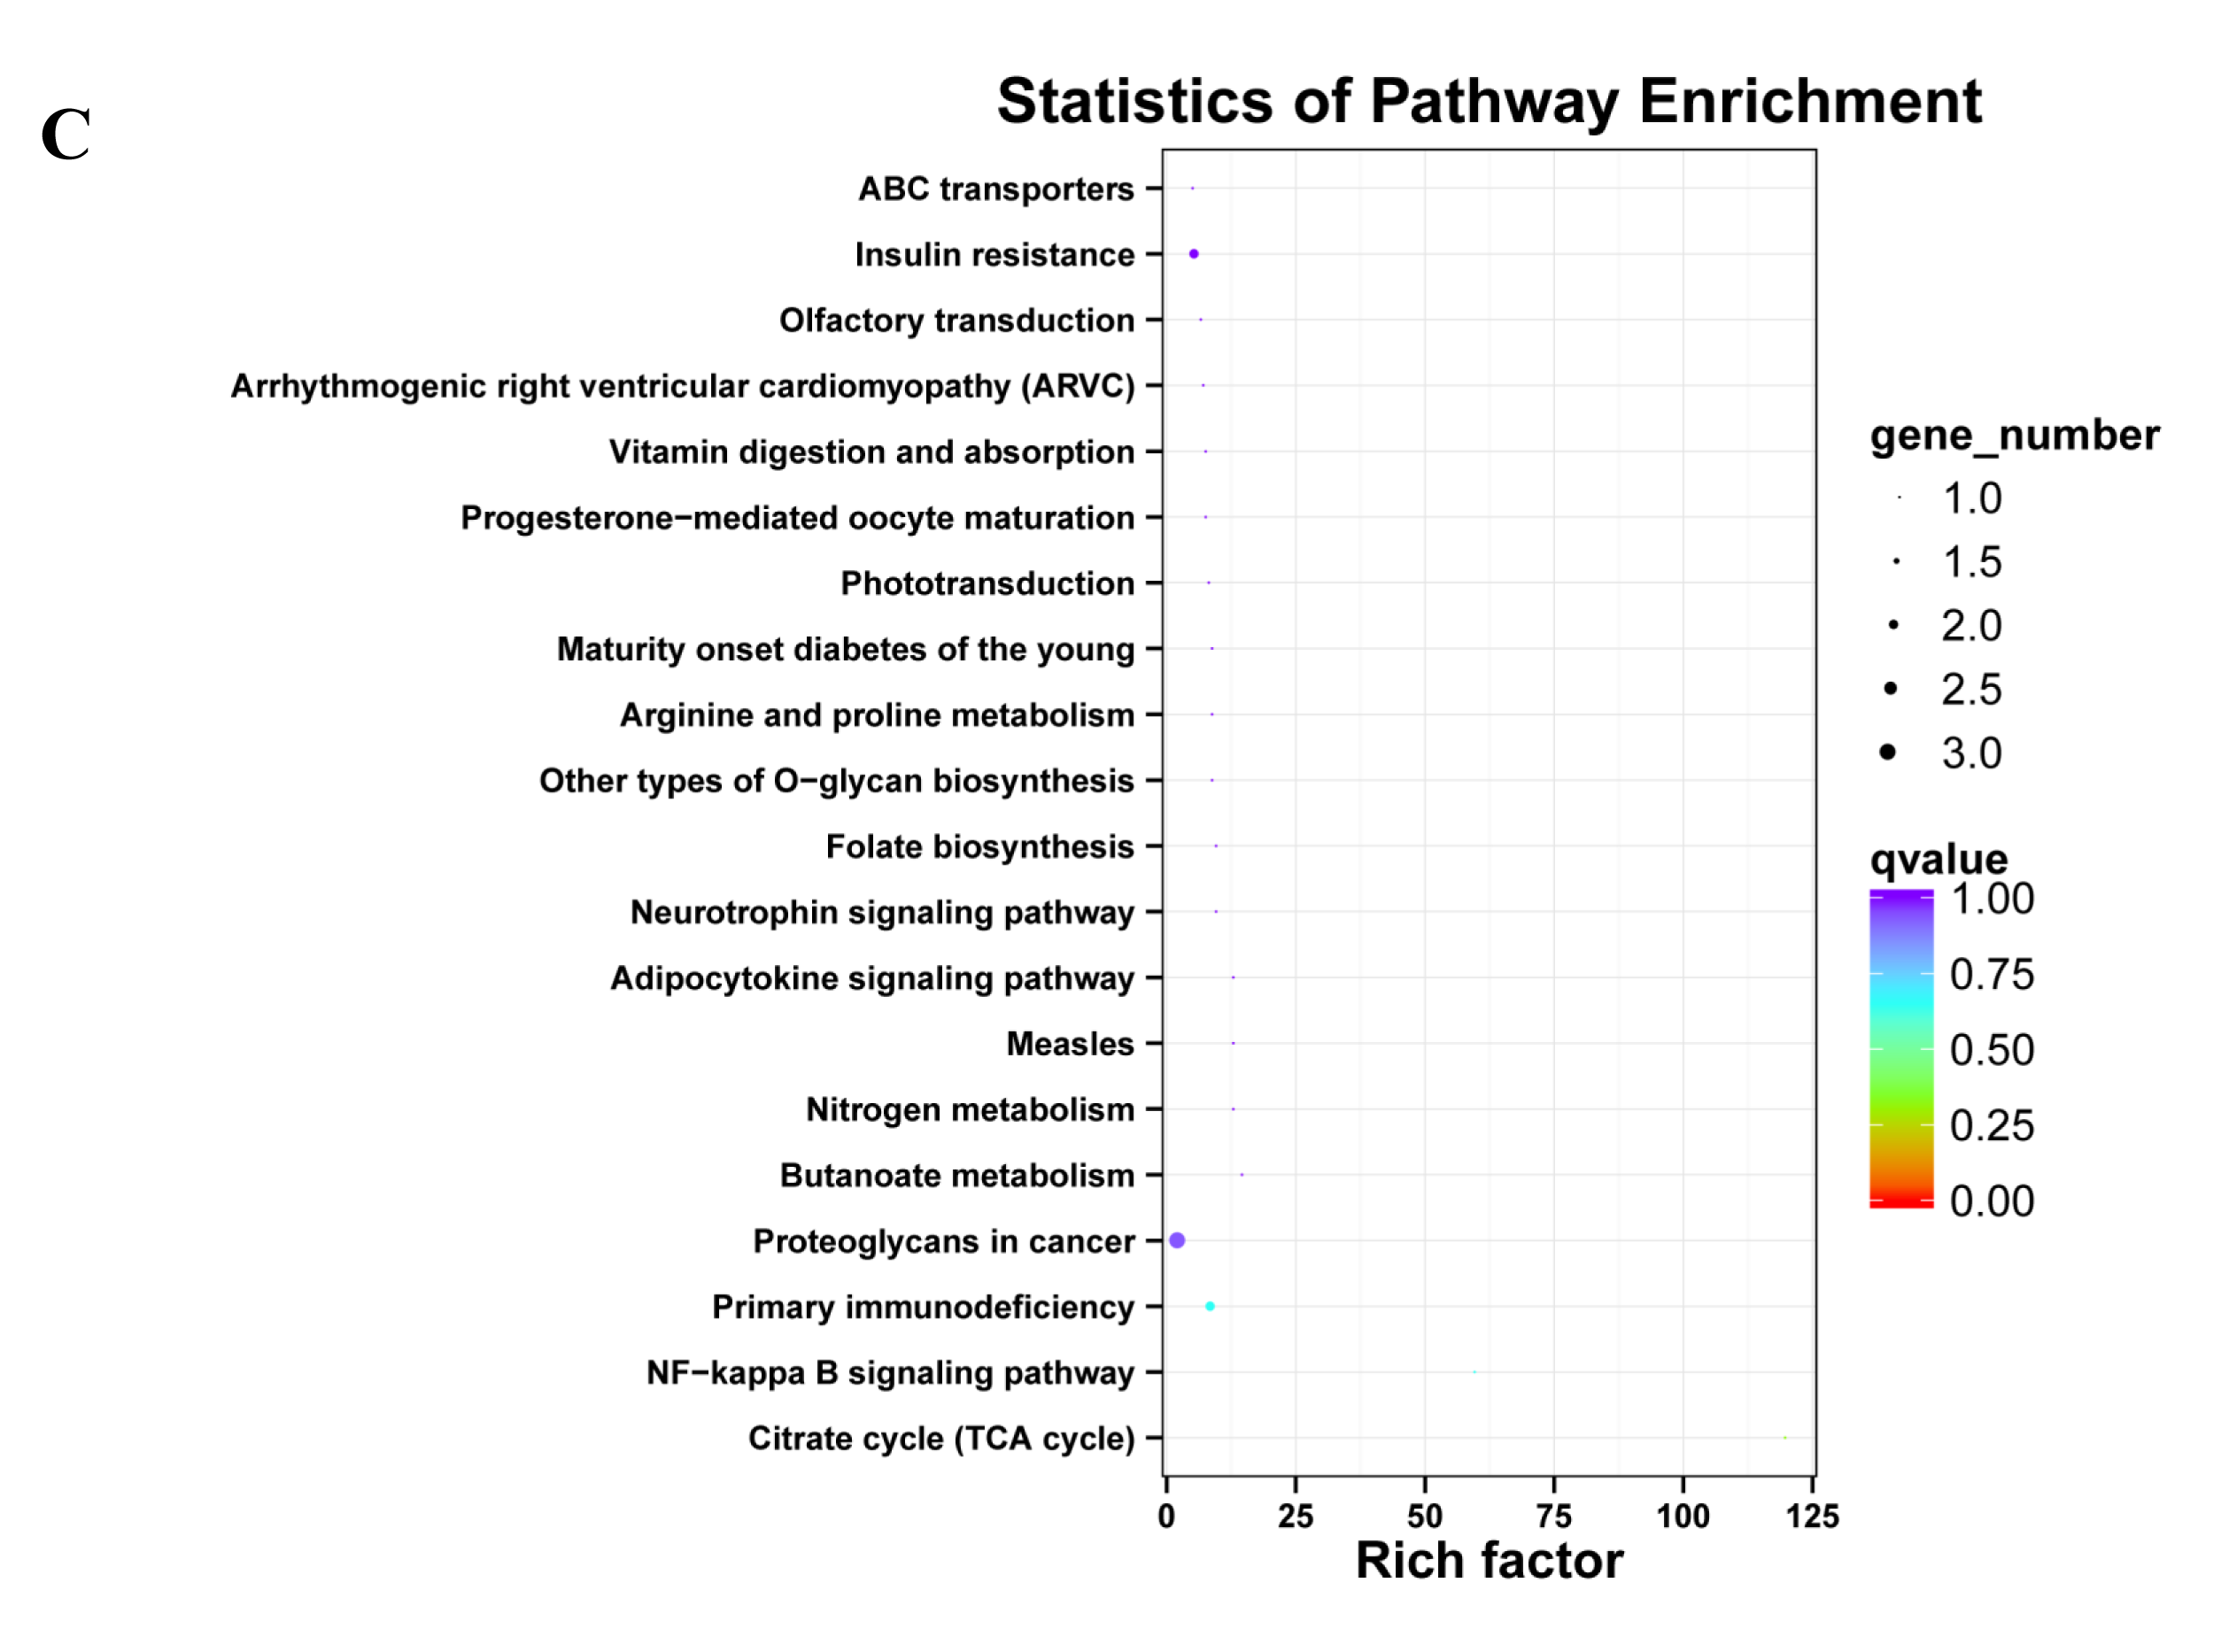
The KEGG classification showed that target genes of the 25 DEMs were mainly associated with the “Metabolic pathways”, followed by pathways for “Pathways in cancer”, and “PI3K-Akt signaling pathway” (Fig. 5A). Similarly, most target genes of the specifically expressed miRNAs in 60 d were related to the “Metabolic pathways”, followed by pathways for “PI3K-Akt signaling pathway” and “Pathways in cancer” (Fig. 5B). For novel miRNA CM008039.1_315920, most targets were classified to “Metabolic pathways”, as well as pathways of “Gap junction”, “Oocyte meiosis”, “PI3K-Akt signaling pathway”, “Rap1 signaling pathway”, “Ras signaling pathway”, “Proteoglycans in cancer” and “Progesterone-mediated oocyte maturation” (Fig. 5C). KEGG enrichment of miRNA target genes was also analyzed (Fig. S1). Notably, among predicted targets of the 25 DEMs, we discovered that CM008039.1_315920 miRNA was highly enriched in “NF-kappa B signaling pathway” (Fig. S1C), which was mainly associated with apoptosis and cell proliferation.
| #ID | miRNA_Seq | Length | 30 d | 60 d | 90 d | 30 d_vs_60 d | 30 d_vs_90 d | 60 d_vs_90 d | |
|---|---|---|---|---|---|---|---|---|---|
| 1 | aca-miR-10a-5p | UACCCUGUAGAUCCGAAUUUGUG | 23 | 6.12849554 | 17.99627 | 4.724809 | Up | Normal | Down |
| 2 | aca-miR-144-5p | GGAUAUCAUCAUAUACUGUAA | 21 | 1.83058958 | 12.97989 | 5.174791 | Up | Normal | Down |
| 3 | aca-miR-146a-5p | UGAGAACUGAAUUCCAUAGGC | 21 | 1.52549131 | 7.932154 | 1.521997 | Up | Normal | Down |
| 4 | aga-miR-184 | UGGACGGAGAACUGAUAAGGG | 21 | 0.30509826 | 5.047734 | 0.608799 | Up | Normal | Down |
| 5 | bta-miR-146b | UGAGAACUGAAUUCCAUAGGCUGU | 24 | 17.8863856 | 41.85413 | 12.78478 | Up | Normal | Down |
| 6 | bta-miR-187 | UCGUGUCUUGUGUUGCAGCCGG | 22 | 1.4561508 | 5.277177 | 1.452816 | Up | Normal | Down |
| 7 | bta-miR-27a-5p | AGGGCUUAGCUGCUUGUGAGCA | 22 | 54.75127 | 26.15644 | 68.5729 | Down | Normal | Up |
| 8 | bta-miR-504 | AGACCCUGGUCUGCACUCUGUC | 22 | 0.29123016 | 3.67108 | 0.581126 | Up | Normal | Down |
| 9 | cfa-miR-10a | UACCCUGUAGAUCCGAAUUUGU | 22 | 6.40706351 | 18.81428 | 4.939573 | Up | Normal | Down |
| 10 | cfa-miR-146b | UGAGAACUGAAUUCCAUAGGCU | 22 | 19.5124207 | 45.65905 | 13.94703 | Up | Normal | Down |
| 11 | cgr-miR-146b-5p | UGAGAACUGAAUUCCAUAGGCUG | 23 | 18.6640546 | 43.67388 | 13.34064 | Up | Normal | Down |
| 12 | cgr-miR-181a-3p | ACCAUCGACCGUUGAUUGUACC | 22 | 41.0634525 | 20.19094 | 42.13165 | Down | Normal | Up |
| 13 | cgr-miR-187 | UCGUGUCUUGUGUUGCAGCCG | 21 | 1.52549131 | 5.528471 | 1.521997 | Up | Normal | Down |
| 14 | chi-miR-187 | UCGUGUCUUGUGUUGCAGCC | 20 | 1.60176588 | 5.804894 | 1.598097 | Up | Normal | Down |
| 15 | chi-miR-411b-3p | UAUGUCACAUGGUCCACUAAU | 21 | 0 | 2.163315 | 0 | Up | – | Down |
| 16 | chi-miR-504 | AGACCCUGGUCUGCACUCUGU | 21 | 0.30509826 | 3.845893 | 0.608799 | Up | Normal | Down |
| 17 | efu-miR-181a | AACCAUCGACCGUUGAUUGUACC | 23 | 39.278085 | 19.31307 | 40.29984 | Down | Normal | Up |
| 18 | mdo-miR-181a-1-3p | CCAUCGACCGUUGAUUGUACC | 21 | 42.7137568 | 20.67167 | 43.22472 | Down | Normal | Up |
| 19 | oar-miR-10a | UACCCUGUAGAUCCGAAUUUG | 21 | 7.01726004 | 19.95057 | 5.174791 | Up | Normal | Down |
| 20 | sha-miR-181a-3p | ACCAUCGACCGUUGAUUGU | 19 | 47.5471556 | 23.37898 | 48.78402 | Down | Normal | Up |
| 21 | ssa-miR-144-5p | GGAUAUCAUCAUAUACUGUAAGUU | 24 | 1.60176588 | 11.3574 | 4.527942 | Up | Normal | Down |
| 22 | CM008019.1_137729 | CCCAGGGAUGUAGCUCCUAGUGC | 23 | 1.39283989 | 4.389334 | 1.11172 | Up | Normal | Down |
| 23 | CM008022.1_159134 | CAAAUUCGUGAAGCGUUCCAUAUUU | 25 | 18.1960604 | 6.259191 | 14.57465 | Down | Normal | Up |
| 24 | CM008025.1_184228 | CAAAUUCGUGAAGCGUUCCAUAUUU | 25 | 18.1960604 | 6.259191 | 14.83034 | Down | Normal | Up |
| 25 | CM008039.1_315920 | CGGAUCAGCUCAGUGCCGGGC | 21 | 0 | 3.124788 | 0 | Up | – | Down |
Quantitative real-time PCR (qRT-PCR) verification
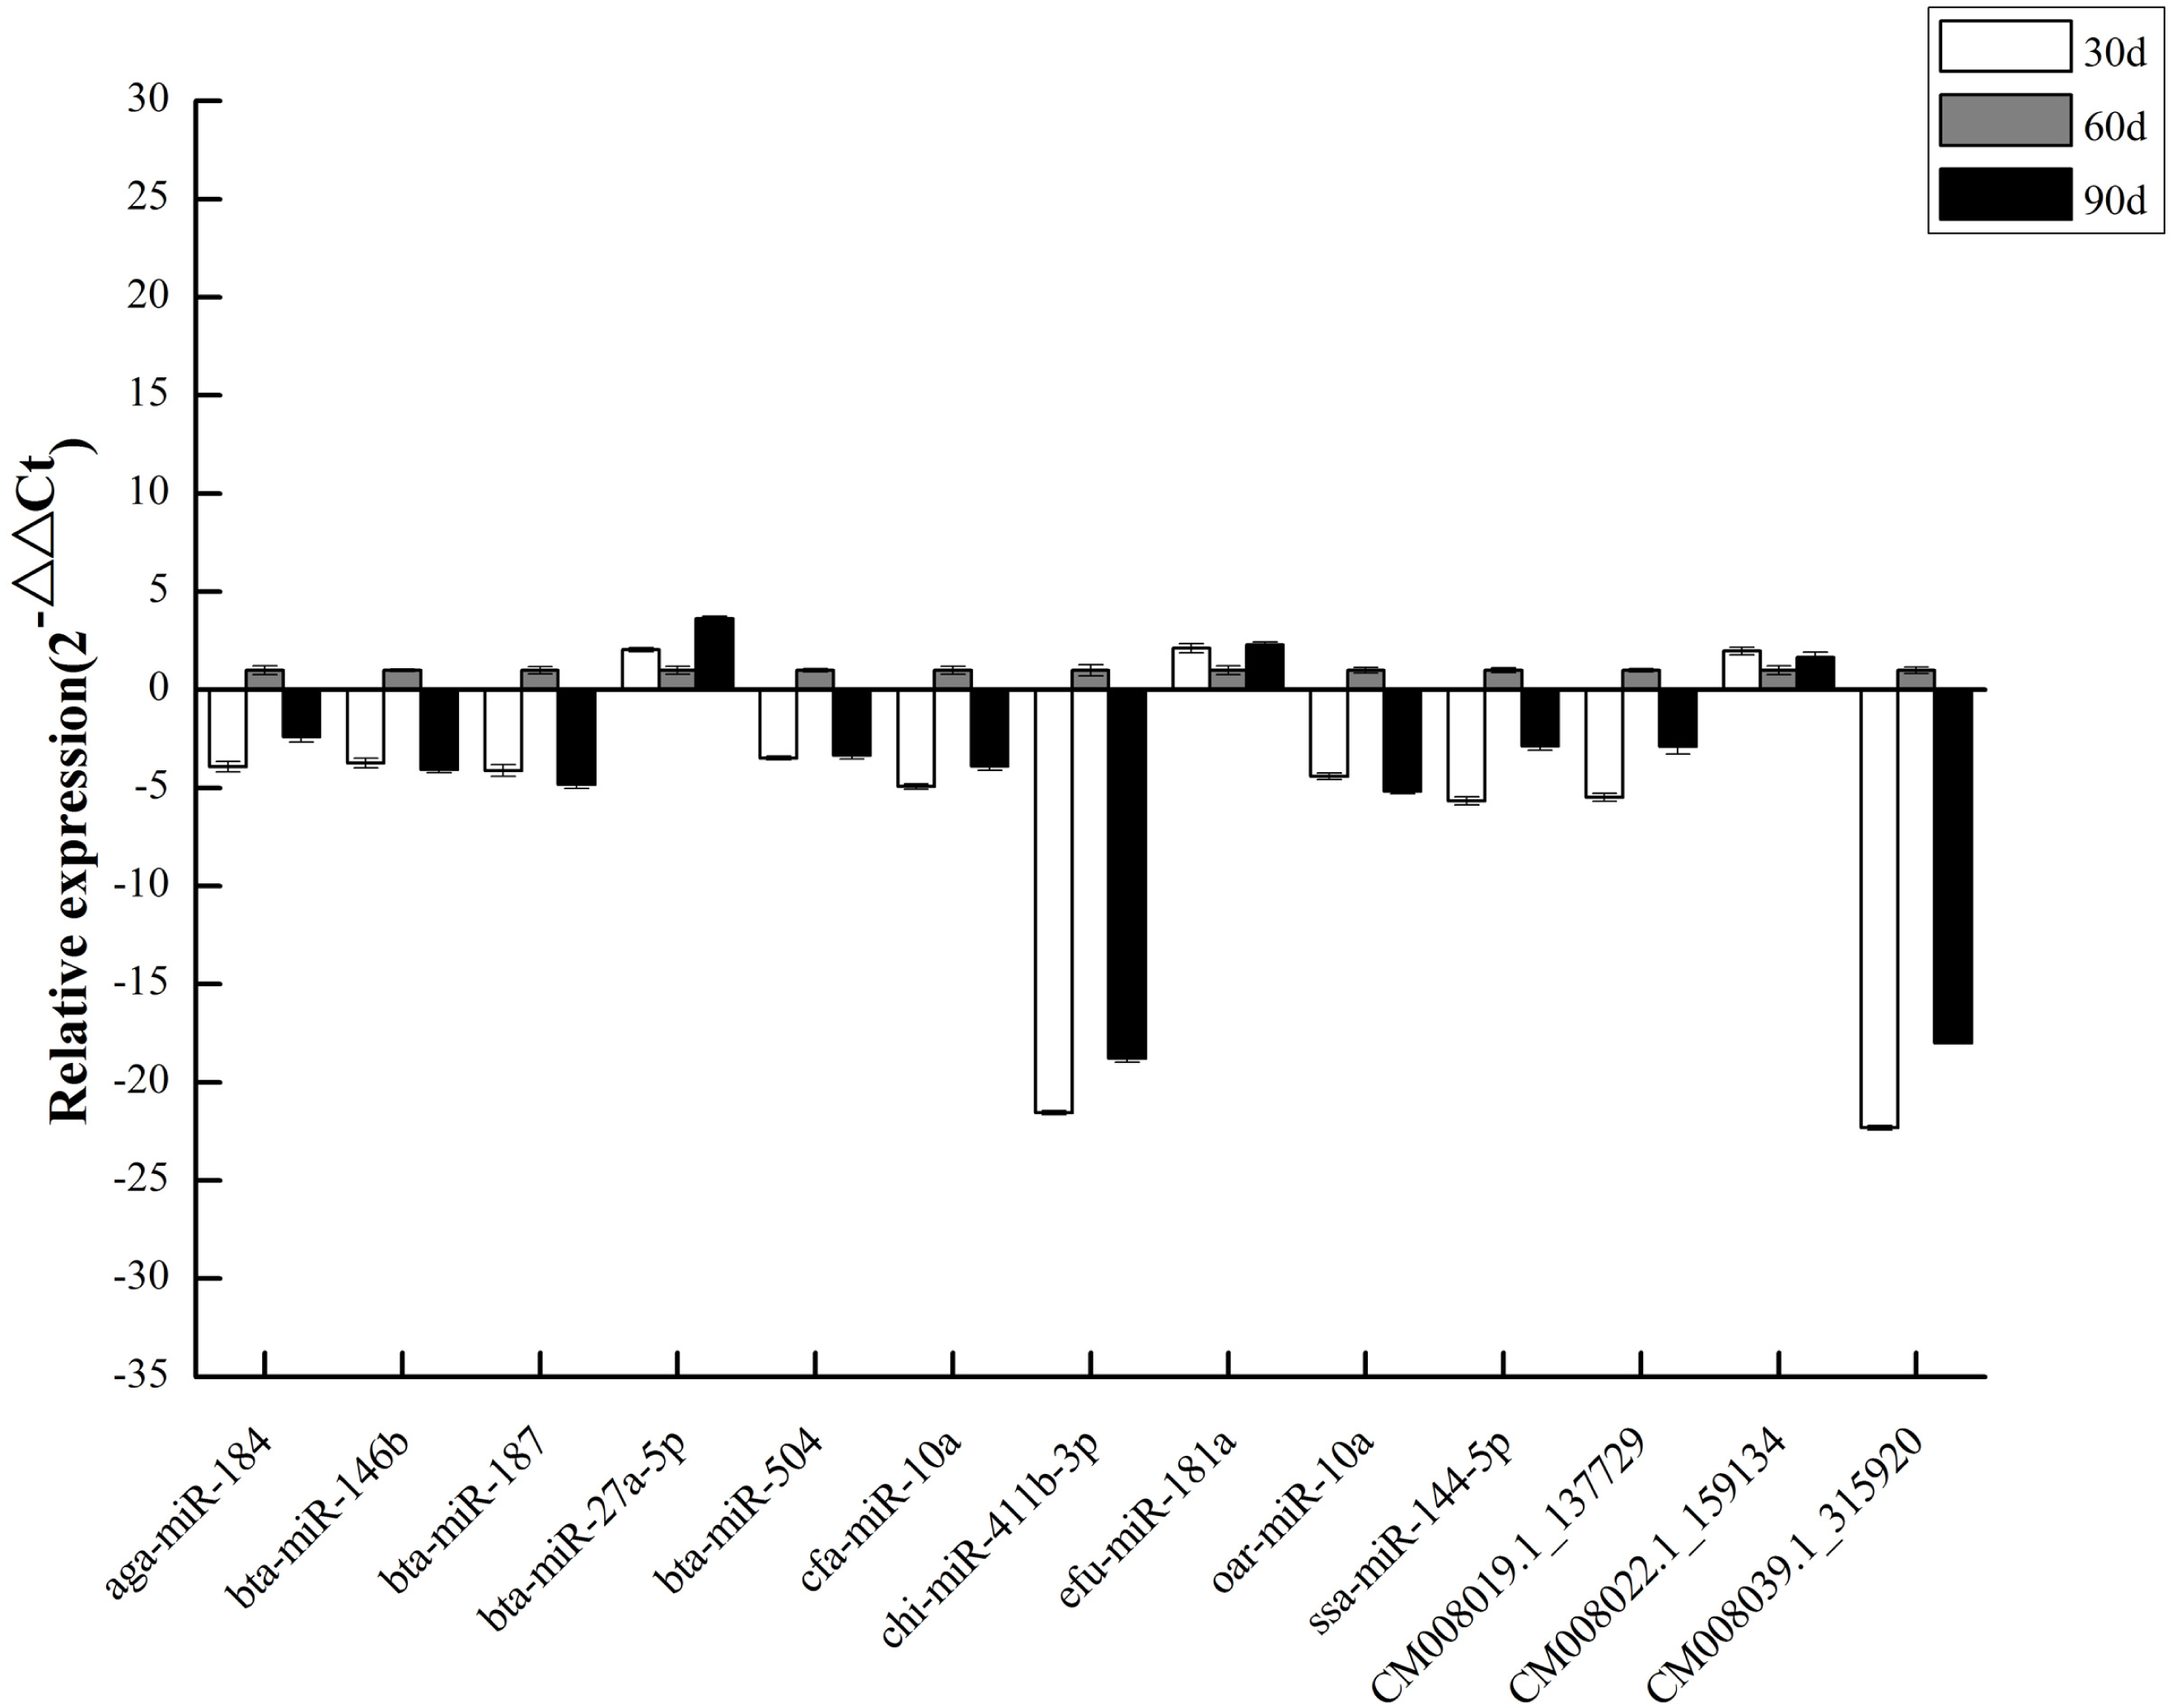
To validate DEM expression profiles, we randomly selected 13 miRNAs, including 10 known and three novel miRNAs, for stem-loop qRT-PCR. We discovered that qRT-PCR results and high-throughput sequencing data were correlated (Fig. 6), validating DEM expression patterns and confirming the reliability and accuracy of our miRNA-seq data.
Discussion
The velvet antler is capable of regeneration and rapid growth, processes that are inseparable from the self-renewal and differentiation ability of mesenchymal tissue in the antler growth center. These characteristics differentiate the antler from normal cartilage or bone tissue (Li et al., 2014). The growth center (mainly comprising velvet skin, mesenchyme, and cartilage) controls velvet antler regeneration and development (Li et al., 2002; Ba et al., 2019). Antler growth centers are rich in regulatory factors, including growth and transcription factors related to cartilage growth and ossification (Yao et al., 2018). Multiple studies have reported that let-7a and let-7f (Hu et al., 2014a), miR-18a (Hu et al., 2014b), miR-19a/b (Yan et al., 2020), and miR-15a/b (Liu et al., 2018) participate in the regulation of antler chondrocyte proliferation and regeneration. Therefore, discovering novel regulators and their associated pathways will help us understand the mechanisms involved in velvet antler RGS.
Here, we investigated and compared miRNA profiles of antler cartilage tissues at three growth stages (30, 60, and 90 d), revealing several DEMs and candidate target genes that are associated with the rapid growth of velvet antlers.
This study predicted 1,277 miRNAs, including 1,073 known and 204 novel miRNAs. Among these, 243 were differentially expressed across the three growth stages. We screened 25 DEMs from the 30 d vs. 60 d and 60 d vs 90 d comparisons, including 21 known and four novel miRNAs; 18 of these were upregulated and seven were downregulated in 60 d antler cartilage tissue. MicroRNA (miRNA) is evolutionarily conserved non-coding small RNA molecule between species. Since no miRNA sequence data of C. elaphus kansuensis was available in the miRBase v21.0 database, the miRNAs in this study were extrapolated from other species. This method was also used in other studies (Ba, Wang & Li, 2016).
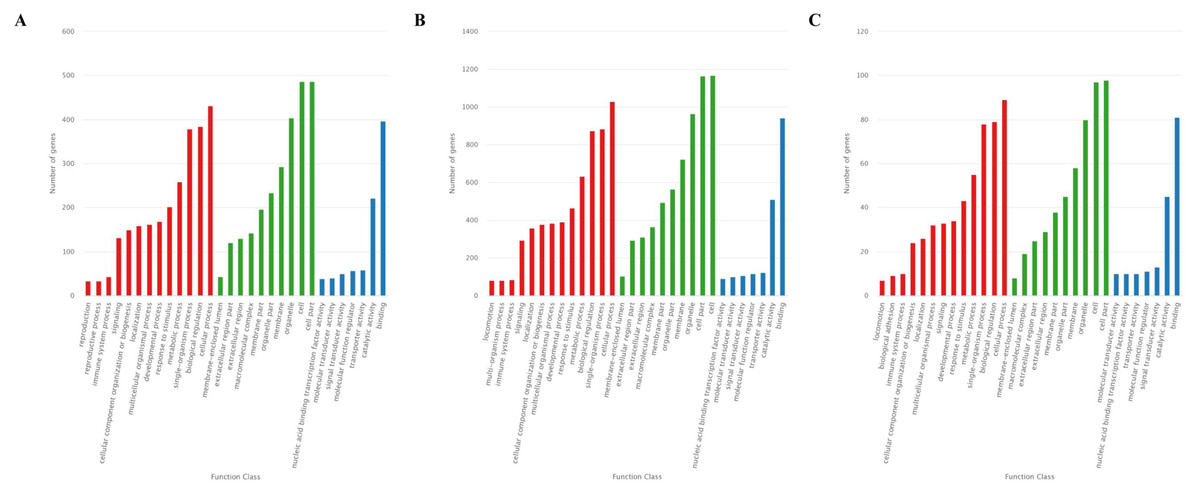
Figure 4: GO classification for target genes of 25 DEMs.
For target genes of 25 DEMs, specifically expressed miRNAs in 60 d and CM008039.1_315920, the GO terms of “cellular process,” “cell part,” “cell,” and “binding” were clustered the most target genes. (A) GO classification of target genes for 25 DEMs; (B) GO classification of target genes for specifically expressed miRNAs in 60 d; (C) GO classification of target genes for novel miRNA CM008039.1_315920.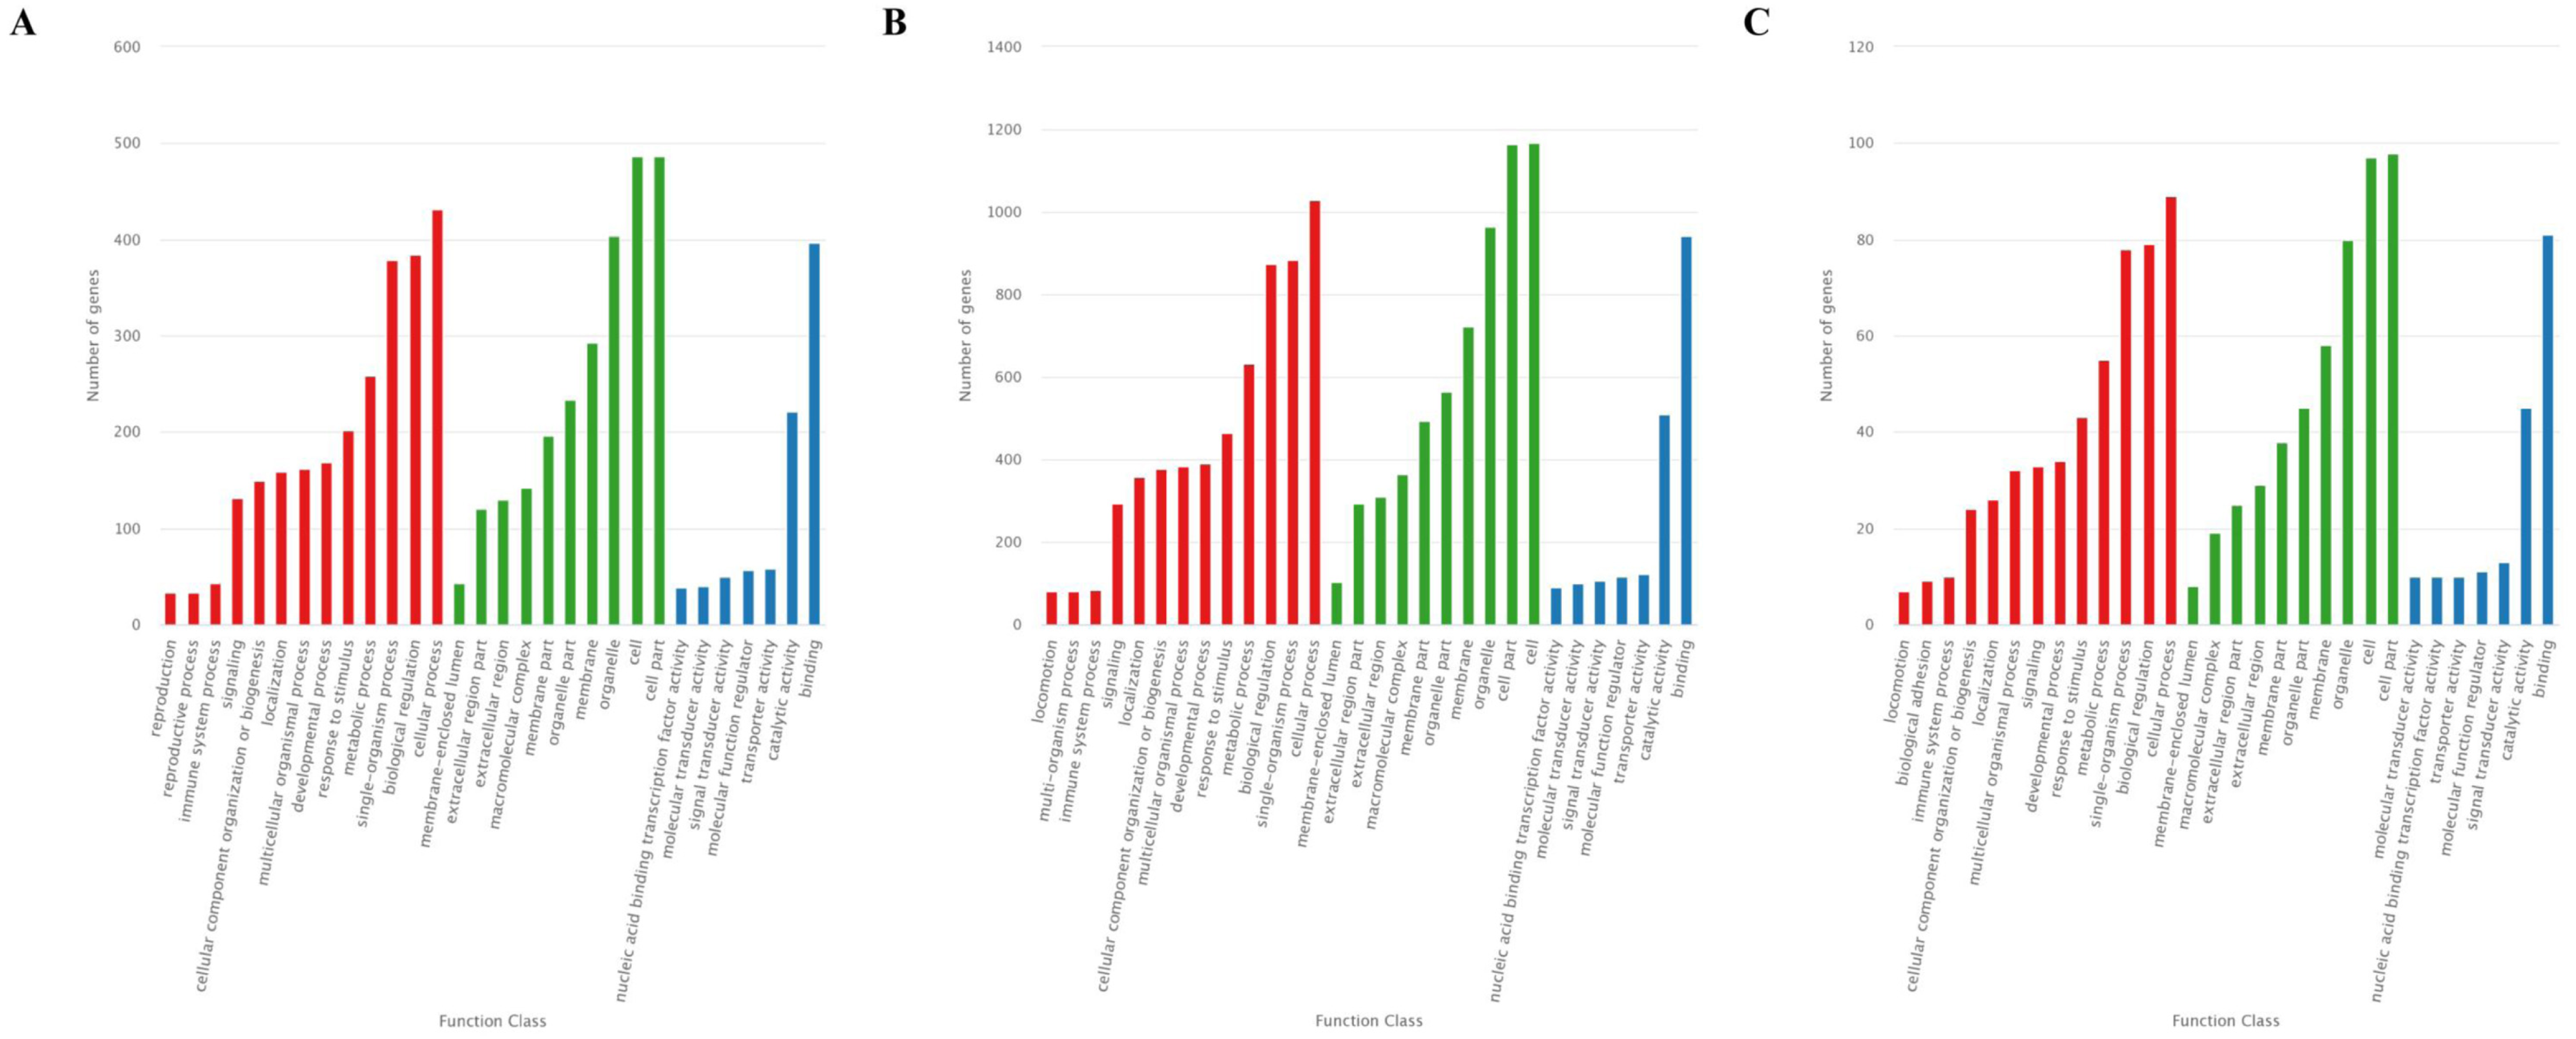
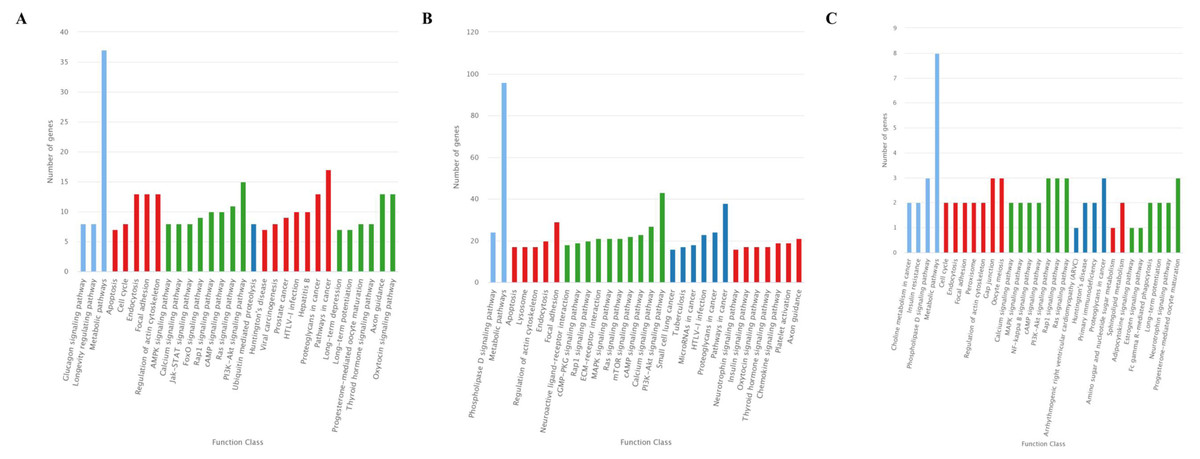
Figure 5: KEGG classification for target genes of 25 DEMs.
The ordinate represents the KEGG pathways, and the abscissa represents the number and proportion of target genes annotated to the pathway. For target genes of 25 DEMs, specifically expressed miRNAs in 60 d and CM008039.1_315920, most target genes annotated to pathways of “Metabolic pathways”, “PI3K-Akt signaling pathway” and “Proteoglycans in cancer”. (A) KEGG classification for target genes of all 243 DEMs. (B) KEGG classification for target genes of specifically expressed miRNAs in 60 d; (C) KEGG classification for target genes of CM008039.1_315920.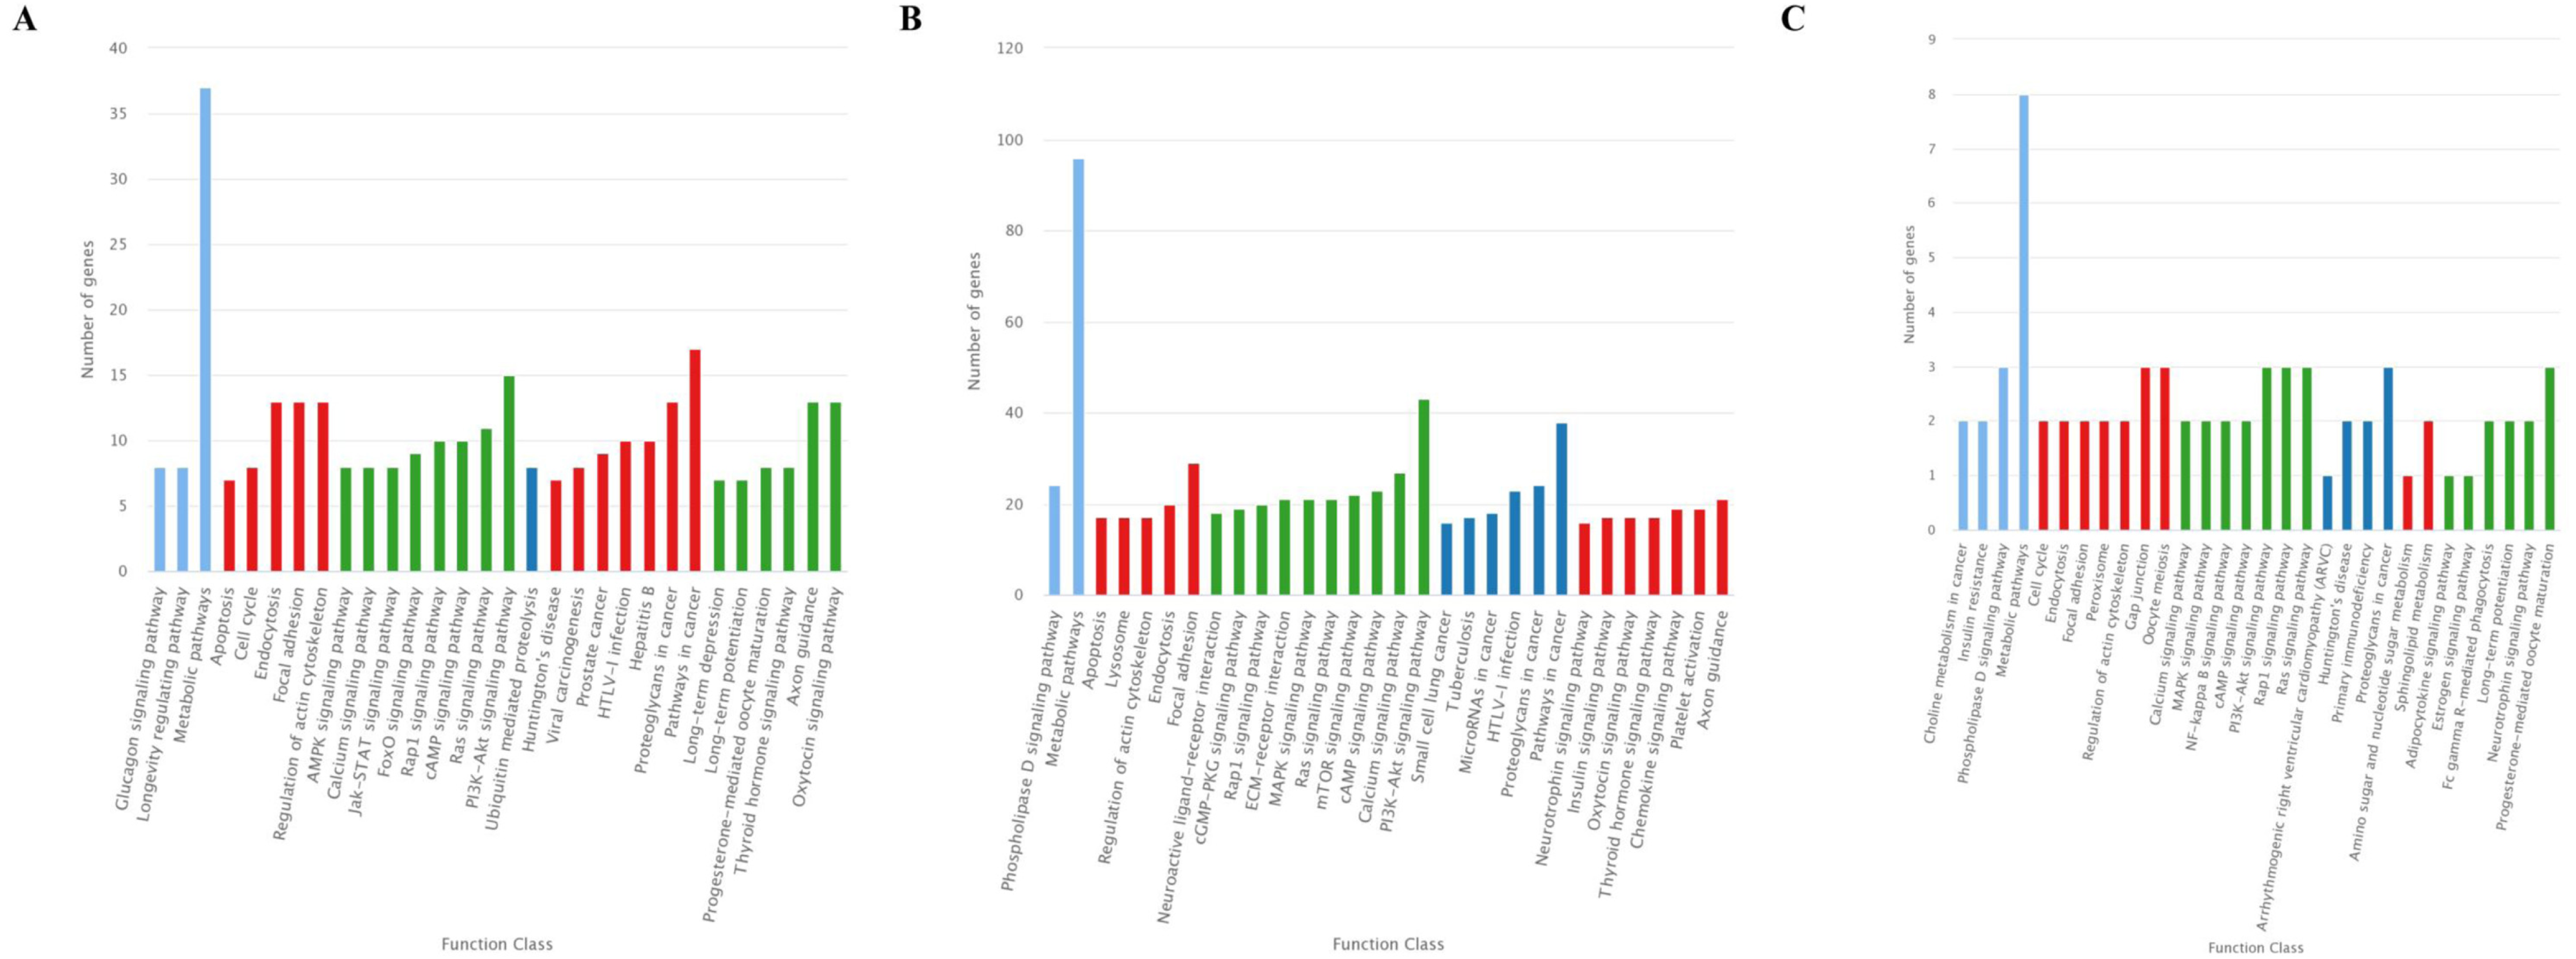
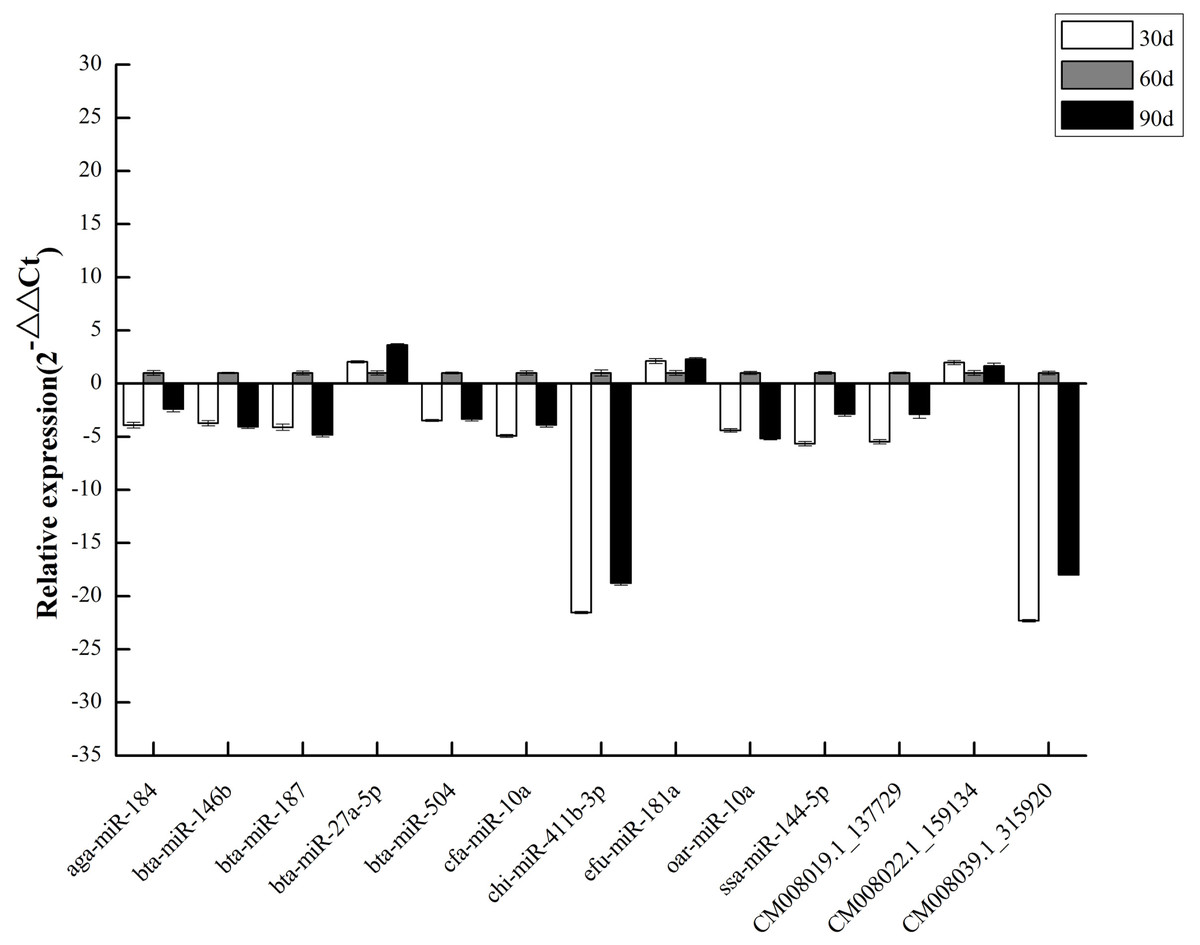
Figure 6: qPCR of DEMs.
Two DEMs (CM008039.1_315920 and chi-miR-411b-3p) with the lowest expression levels among 25 DEMs were specifically expressed in 60 d antler cartilage. Through suppressing target gene expression, miRNAs are known to alter expression patterns in specific tissues at specific times (Mohr & Mott, 2015). However, no studies have investigated the role of mir-411b in chondrogenesis. Thus, further research on these two miRNAs is required to determine their biological functions during the RGS of antler development.
Bioinformatics analysis revealed that the predicted target genes of 25 DEMs and specifically expressed miRNAs in 60d were widely classified into multiple GO terms, indicating that these genes may participate in many important biological processes. The GO enrichment results showed that most target genes were highly enriched in the “cellular process”, “cell”, “cell part”, and “binding” terms, implying involvement in antler development. The velvet antler may grow at a speed of two cm/d during RGS, a period of rapid cell proliferation, differentiation, and aggregation. The amount of ATP, nucleotides, proteins, and other factors involved in velvet antler growth may be able to support vigorous cell activity of antler, such as proliferation and differentiation.
Unlike the GO analysis, the KEGG pathway analysis yielded more direct and detailed results. The pathways represent protein-protein interactions and any change in each pathway reflects changes in a specific protein’s expression or activity. KEGG pathway analysis revealed that most target genes of 25 DEMs, specifically expressed miRNAs in 60d and CM008039.1_315920 were mainly associated with “Metabolic pathways”, “PI3K-Akt signaling pathway” and “Proteoglycans in cancer”. Metabolic pathways have extensive contents, such as glycolysis, fatty acid oxidation, and amino acid metabolism (Boroughs & DeBerardinis, 2015). These pathways play important roles in cells fate and functions (Boroughs & DeBerardinis, 2015; Kim & DeBerardinis, 2019) and determine vasculature formation (Li, Kumar & Carmeliet, 2019). Antler cartilage is rich in nerves and blood vessels, and there is a definite link between the abundant blood vessels and the rapid growth and regeneration of antlers (Clark et al., 2006; Hu et al., 2019). In summer, velvet antler grows rapidly, and a large number of blood vessels in antler can transport nutrients to and excrete metabolites from the antler. It has been reported that there may be a close relationship between metabolites and the size of velvet antlers (Su et al., 2020). Thus, metabolic pathways play important roles in rapid growth and regeneration of velvet antler.
PI3K-Akt pathway can regulate multiple cellular events including cell apoptosis, proliferation and differentiation. Moreover, PI3K-Akt pathway is frequently involved in cancers (Jiang et al., 2020). It can be activated by Wnt signaling pathway and there is complex crosstalk between PI3K-Akt and Wnt/β-catenin pathways (Dong et al., 2020). These two signaling pathways can function synergistically (Evangelisti et al., 2020; Prossomariti et al., 2020). PI3K-Akt pathway also participates in glucose and glutamine metabolism within the hierarchy of pathways altered in cancer (Boroughs & DeBerardinis, 2015).
Proteoglycans are a group of molecules, which play significant roles in cancer development, progression, invasion and metastasis (Wei et al., 2020). Whether the pathway of “Proteoglycans in cancer” participates in antler rapid growth and regeneration needs further investigation.
Target genes associated with the above signaling pathways may also be involved with the well-known Wnt signaling pathway, widely distributed in invertebrates and vertebrates. This pathway mediates important cellular responses, including cancer development, body axis development, and morphogenesis. Wnt signaling also plays a crucial role in the early development of animal embryos, organ formation, tissue regeneration, and other normal physiological processes (Leucht, Lee & Yim, 2019). Previous studies have reported that the Wnt signaling pathway participates in the regulation of antler growth and development (Mount et al., 2006; Li et al., 2012; Zhang et al., 2018). Some researchers believe that antler growth is a tumor-like development due to their similar growth rates (Goss, 1990; Kierdorf & Kierdorf, 2011; Wang et al., 2017), suggesting a possible mechanism connecting the miRNAs detected in this study and antler development. Indeed, numerous genes are involved in both cancer and antler development. However, further studies are required to identify the specific genes acting on antler growth and development during RGS.
KEGG pathway analysis also revealed that CM008039.1_315920 miRNA was abundant in the NF- κB pathway. NF- κB is a ubiquitous transcription factor that regulates the expression of genes involved in multiple cell functions; it is activated by various extracellular stimuli (Caviedes et al., 2017). NF- κB plays an important role during immune response and inflammation. However, growing evidence suggests that NF- κB also has a major role in oncogenesis through regulating the expression of genes involved in cancer development and progression, such as tumor cell proliferation, migration, and apoptosis (Dolcet et al., 2005). Therefore, further investigation is required to confirm the function of this novel miRNA in velvet antler development.
We screened 25 DEMs that are potentially important for antler development from the 30 d vs. 60 d and 60 d vs. 90 d comparisons. Through qRT-PCR, we confirmed that the expression levels of 13 randomly selected miRNAs were consistent with the bioinformatics analysis.
Taken together, our findings provide new insights into the possible mechanisms involved in antler development during the RGS. Further research on the 25 DEMs and specifically expressed miRNAs in 60 d identified here, especially the novel miRNA CM008039.1_315920, will be helpful in elucidating mechanisms underlying the rapid growth of deer antlers and may also contribute novel therapeutic targets for cancer treatment.
Conclusions
In this study, the novel miRNA CM008039.1_315920 was differentially expressed in the 30 d vs. 60 d and 60 d vs. 90 d comparisons, but not in the 30 d vs. 90 d comparison. This miRNA was also a specifically expressed miRNA in deer antler cartilage that grew for about 60 d. Moreover, the target genes of this novel miRNA were annotated to NF- κB pathway, indicating that CM008039.1_315920 may possess important biological functions in rapid antler growth.