
Therapeutic targeting of ARID1A and PI3K/AKT pathway alterations in cholangiocarcinoma
- Published
- Accepted
- Received
- Academic Editor
- Adegboyega Oyelere
- Subject Areas
- Bioinformatics, Cell Biology, Genomics, Molecular Biology, Gastroenterology and Hepatology
- Keywords
- BAF250a, Phosphatidylinositol-3-kinase, Protein kinase B, Biliary tract cancer, AKT inhibitor
- Copyright
- © 2022 Tessiri et al.
- Licence
- This is an open access article distributed under the terms of the Creative Commons Attribution License, which permits unrestricted use, distribution, reproduction and adaptation in any medium and for any purpose provided that it is properly attributed. For attribution, the original author(s), title, publication source (PeerJ) and either DOI or URL of the article must be cited.
- Cite this article
- 2022. Therapeutic targeting of ARID1A and PI3K/AKT pathway alterations in cholangiocarcinoma. PeerJ 10:e12750 https://doi.org/10.7717/peerj.12750
Abstract
Background
Genetic alterations in ARID1A were detected at a high frequency in cholangiocarcinoma (CCA). Growing evidence indicates that the loss of ARID1A expression leads to activation of the PI3K/AKT pathway and increasing sensitivity of ARID1A-deficient cells for treatment with the PI3K/AKT inhibitor. Therefore, we investigated the association between genetic alterations of ARID1A and the PI3K/AKT pathway and evaluated the effect of AKT inhibition on ARID1A-deficient CCA cells.
Methods
Alterations of ARID1A, PI3K/AKT pathway-related genes, clinicopathological data and overall survival of 795 CCA patients were retrieved from cBio Cancer Genomics Portal (cBioPortal) databases. The association between genetic alterations and clinical data were analyzed. The effect of the AKT inhibitor (MK-2206) on ARID1A-deficient CCA cell lines and stable ARID1A-knockdown cell lines was investigated. Cell viability, apoptosis, and expression of AKT signaling were analyzed using an MTT assay, flow cytometry, and Western blots, respectively.
Results
The analysis of a total of 795 CCA samples revealed that ARID1A alterations significantly co-occurred with mutations of EPHA2 (p < 0.001), PIK3CA (p = 0.047), and LAMA1 (p = 0.024). Among the EPHA2 mutant CCA tumors, 82% of EPHA2 mutant tumors co-occurred with ARID1A truncating mutations. CCA tumors with ARID1A and EPHA2 mutations correlated with better survival compared to tumors with ARID1A mutations alone. We detected that 30% of patients with PIK3CA driver missense mutations harbored ARID1A-truncated mutations and 60% of LAMA1-mutated CCA co-occurred with truncating mutations of ARID1A. Interestingly, ARID1A-deficient CCA cell lines and ARID1A-knockdown CCA cells led to increased sensitivity to treatment with MK-2206 compared to the control. Treatment with MK-2206 induced apoptosis in ARID1A-knockdown KKU-213A and HUCCT1 cell lines and decreased the expression of pAKTS473 and mTOR.
Conclusion
These findings suggest a dependency of ARID1A-deficient CCA tumors with the activation of the PI3K/AKT-pathway, and that they may be more vulnerable to selective AKT pathway inhibitors which can be used therapeutically.
Introduction
Cholangiocarcinoma (CCA) is a malignancy arising from the epithelial cells along the biliary tree. The highest incidence rates of CCA have been reported in northeast Thailand, which is the endemic area of the group 1 carcinogen, the liver fluke, Opisthorchis viverrini (Ov) (Sripa & Pairojkul, 2008; Alsaleh et al., 2018). Cholangiocarcinogenesis is induced via multifactorial mechanistic pathways. DNA damage and genetic alterations occur during CCA progression (Sripa et al., 2007; Sripa et al., 2012). Although the best treatment option for localized CCA is curative surgical resection the five-year survival rate after surgical resection is low approximately 30% to 60% (Meza-Junco et al., 2010; Patel, 2011). Thus, more treatment options for CCA patients are urgently needed. Growing evidence from molecular genetic studies of CCA has initiated a significant shift towards a precision medicine-based approach. In recent years, molecular targets with clinical significance include fibroblast growth factor receptor (FGFR), isocitrate dehydrogenase (IDH1/2), human epidermal growth factor receptor (HER), neurotropic tyrosine kinase receptor (NTRK) fusions, and BRAF mutations have been identified in CCA tumors (Lamarca et al., 2020).
AT-rich interactive domain containing protein 1A (ARID1A or BAF250a) is a crucial non-catalytic subunit of human switch/sucrose nonfermentable (SWI/SNF) complex (Wu & Roberts, 2013; Xu & Tang, 2021). It plays an important role in crucial cellular processes including transcription, DNA replication, and DNA damage repair (Basu et al., 2016; Bayona-Feliu et al., 2021). Of note, ARID1A is commonly inactivated in tumors including CCA (Wu & Roberts, 2013; Jusakul et al., 2017; Orlando et al., 2019). Silencing of ARID1A has resulted in a significant increase in proliferation in vitro (Samartzis et al., 2014). In CCA tumors, decreased expression of ARID1A was associated with CCA progression and metastasis, indicating the tumor-suppressor function of ARID1A in CCA (Chan-on et al., 2013; Namjan et al., 2020; Zhao et al., 2021). Recent studies have shown that ARID1A mutations is involved in carcinogenesis via activation of the phosphatidylinositol 3-kinase/protein kinase B (PI3K/AKT) pathway (Takeda et al., 2016). Co-occurrence of ARID1A alterations with PI3K/AKT pathway activation has been reported in ovarian clear cell carcinoma, breast cancer, and gastric cancer (Huang et al., 2014; Samartzis et al., 2014; Zhang et al., 2016; De & Dey, 2019). Silencing of ARID1A in gastric, ovarian, glioma, and colon cancer cells has been shown to activate the phosphorylation of AKT, and PI3K (Zeng et al., 2013; Xie et al., 2014; Takeda et al., 2016; Zhang et al., 2016), suggesting an interrelationship between ARID1A deficiency and PI3K/AKT pathway activation. Taken together, the crucial tumor suppressive roles of ARID1A shed light on targeted therapeutic strategies, hence there has been ongoing effort towards developing effective therapeutic strategies for ARID1A deficient tumors (Bitler, Fatkhutdinov & Zhang, 2015; Mathur, 2018; Mullen et al., 2021).
Interestingly, ARID1A mutations and the depletion of ARID1A protein expression sensitized cancer cells to PI3K/AKT inhibitors. In breast and gastric cancer, ARID1A-depleted cells showed an increased sensitivity to PI3K and AKT inhibitor compared to wild-type cells (Samartzis et al., 2014; Zhang et al., 2016; Yang et al., 2018b). This is of significant clinical importance since ARID1A mutations or loss of the expression can be predictive of a favorable therapeutic response to inhibitors in the PI3K/AKT pathway. Although ARID1A inactivation and PI3K/AKT pathway alteration frequently occur in CCA, the effect of PI3K or AKT inhibitor has not been well-defined in ARID1A-deficient CCA. We therefore aimed to study the association between genetic alterations of ARID1A and the PI3K/AKT pathway in CCA and investigate the effect of AKT inhibitor on ARID1A-deficient CCA cell lines. This study will provide a unique opportunity for predicting favorable treatment responses to inhibitors of the PI3K/AKT pathway on ARID1A-deficient CCA tumors which might further improve treatment outcome.
Material and Methods
Cell lines and cell culture
The human cholangiocarcinoma cell lines KKU-452 (JCRB1772) (Saensa-ard et al., 2017), KKU-055 (JCRB1551), KKU-213A (JCRB1557) (Sripa et al., 2020), and KKU-100 (JCRB1568) (Sripa, 2005) were developed at Cholangiocarcinoma Research Institute, Khon Kaen University and deposited to the Japanese Cancer Research Resources Bank (JCRB, Ibaraki city, Osaka, Japan). The HUCCT1 (RCB1960) cell line was obtained from the RIKEN Bioresource Research Center (Ibaraki, Japan). The KKU-452, KKU-055, KKU-213A and KKU-100 cell lines were cultured in Ham’s F-12 whereas the HUCCT1 cells were cultured in RPMI containing 10% fetal bovine serum and penicillin/streptomycin (100 U/ml and 100 µl/ml). The cells were incubated in a humidified incubator at 37 °C and 5% CO2.
Materials
The following reagents and antibodies were used: MK-2206 (A-1909: Active Biochem, Hong Kong) was dissolved in DMSO at a concentration of 10 mM as a stock solution, ARID1A (HPA005456; Sigma-Aldrich, Germany), phospho-AKTS473 (pAKTS473, SAB4300042; Sigma-Aldrich, Germany), AKT (#9272; Cell Signaling Technology, USA), mTOR (#2983; Cell Signaling Technology, USA), Bax (50599-2-Ig; Proteintech, USA), Bcl-2 (12789-1-AP; Proteintech, USA), and β-actin (A5441; Sigma-Aldrich, Germany).
Analysis of gene alterations, using the open-access bio-database cBioPortal
We utilized the cBioPortal for Cancer Genomics (http://cbioportal.org), a web-based, open-access resource for the analysis of cancer genomics data from The Cancer Genome Atlas (TCGA) and The International Cancer Genome Consortium (ICGC). In the present study, somatic mutations of ARID1A, genes in RAS/PI3K/AKT pathways (mutation frequency ≥ 1.7% including: TP53, ARID1A, KRAS, EPHA2, STK11, PIK3CA, RASA1, LAMA2, ERBB2, LAMA1, BRAF, ERBB4, FGFR2, PIK3R1, PTEN, KDR, NRAS, and TNN), clinicopathological data and patient survival of 795 CCA patients/798 samples were analyzed. Collectively, the six data sets included a TCGA data portal (Firehose Legacy) and a ICGC data portal (Jusakul et al., 2017; Chan-on et al., 2013; Ong et al., 2012; Jiao et al., 2013; Lowery et al., 2018) (Table S1). We utilized cBioPortal to analyze genetic alterations, co-occurrence, and mutual exclusivity in CCA tumors. The OncoPrint, co-occurrence and mutual exclusivity of gene mutations were applied according to the online instructions of the cBioPortal. The statistical test for detecting co-occurrence and mutual exclusivity were based on a one-sided Fisher Exact Test, and Benjamini–Hochberg FDR correction in 153 pairs of the 18 genes (Table S2).
Stable shRNA transduction
The cholangiocarcinoma cell lines were infected with MISSION® Lentiviral Transduction Particles Clone containing specific short-hairpin RNA against ARID1A#1 (SHCLNV-NM_006015-TRCN0000059091; Sigma-Aldrich, Germany), ARID1A#2 (SHCLNV-NM_006015-TRCN0000059089; Sigma-Aldrich, Germany) and non-targeted shRNA (SHC016V; Sigma-Aldrich, Germany) using polybrene (EMD Millipore; Sigma-Aldrich, Germany). The following shRNA sequences were used: non-targeted shRNA: sense: CCGGGCGCGATAGCGCTAATAATTTCTC, shARID1A#1: CCGTTGATGAACTCATTGGTT, and shARID1A#2: GCCTGATCTATCTGGTTCAAT.
After 24-hours of infection, cells were selected using 1–2 µg/ml of puromycin (Sigma-Aldrich, Germany). Expression levels of ARID1A were confirmed by real time-PCR and Western blot.
Cell viability assay
Cell viability was determined by a methylthiazolyldiphenyl-tetrazolium bromide (MTT) assay (PanReac Applichem, Germany). Cells were seeded into 96-well plates (Corning, NY, USA). After 24-hour exposure of inhibitor, 100 µl of 0.5 mg/ml MTT reagent was added and incubated for 2 h. After adding DMSO for 15 min, the absorbance was measured using a microplate reader at a wavelength of 570 nm. Each experiment was performed in triplicate and the results were given as means ± SD. The percentage of cell viability was calculated using the formula: % cell viability= (Nt/Nc) x100. Nt and Nc refer to the absorbance of the treated and control groups, respectively.
Western blot
Cells were lysed in RIPA lysis buffer. Protein lysates were centrifuge at 14,000g for 20 mins at 4 °C. Protein concentration was determined using the Pierce™ BCA Protein Assay Kit (Pierce Biotechnology, USA). Protein lysates were resolved by SDS-PAGE and transferred onto PVDF membranes. The membranes were blocked with 5% skim milk or BSA in 1xTBS (1M Tris HCl pH 7.4, 5M NaCl) for 1 h at room temperature. Membranes were subsequently incubated with primary antibodies overnight at 4 °C. After washing, the secondary goat anti-Rabbit IgG-HRP (G21234; Invitrogen, USA) or rabbit anti-Mouse IgG-HRP (A16166; Thermo Fisher Scientific, USA) was used. The immunoreactive signals were visualized using Amersham™ ECL™ Prime Western Blotting Detection Reagent (GE Healthcare, UK).
Apoptosis assay
Cell apoptosis was detected using an Annexin V-FITC and propidium iodide (PI) Kit (V13241; Invitrogen, USA) according to the manufacturer’s protocol. Briefly, cells were seeded into 6-well culture plates overnight. Cells were then exposed to MK-2206 at designated concentrations and 0.3% DMSO was used as the control. After 24 h, cells were trypsinized, washed with ice-cold PBS, and resuspended in binding buffer containing Annexin V-FITC, whereupon, Annexin V/PI was added. Cells were resuspended in reaction buffer containing PI and immediately analyzed by BD FACSCanto II Flow cytometry (Becton Dickinson, USA) to detect the rate of apoptosis.
RNA extraction and real time-RT PCR
Total RNA was isolated from cell pellets using TRIzol® Reagent (Invitrogen, USA) according to the manufacturer’s protocol. Subsequently, 2 µg of total RNA was converted to cDNA using High-Capacity cDNA Reverse Transcription Kit (Applied Biosystems, USA). Real-time reverse transcription polymerase chain reaction (real time PCR) was performed using TaqMan gene expression assay: TaqMan probes (Hs00195664_m1 ARID1A and hs99999903_m1 β-actin; ThermoFisher Scientific, USA) to detected mRNA levels of ARID1A and β-actin. Real time PCR was performed using the ABI real-time PCR system, Quantstudio™ 6 Flex (Life technologies, Singapore). β-actin was used as the housekeeping gene.
Statistical analysis
All experiments were repeated at least two times. Data were expressed as the mean ± standard deviation (SD). Statistical analysis was performed using SPSS 23.0 software (SPSS Inc., USA) or GraphPad Prism v.8.0 (GraphPad Inc., La Jolla, CA, USA) software. Overall survival (OS) curves were constructed according to the Kaplan–Meier estimator and differences between curves were tested for significance by means of log-rank tests. The half inhibitory concentration (IC50) values were calculated by dose–response curves (Y = 100/(1 + X/IC50)). A two-tailed unpaired t-test was used for two-group comparisons. For multiple group comparisons, one-way analysis of variance, Kruskal-Wallis test, and Fisher’s Least Significant Difference Test (LSD Test) test were used. A two-sided p<0.05 was considered statistically significant. Adjusted p-values were calculated using Benjamini–Hochberg correction.
Results
ARID1A mutations and their co-occurrence with alterations in PI3K/AKT pathway
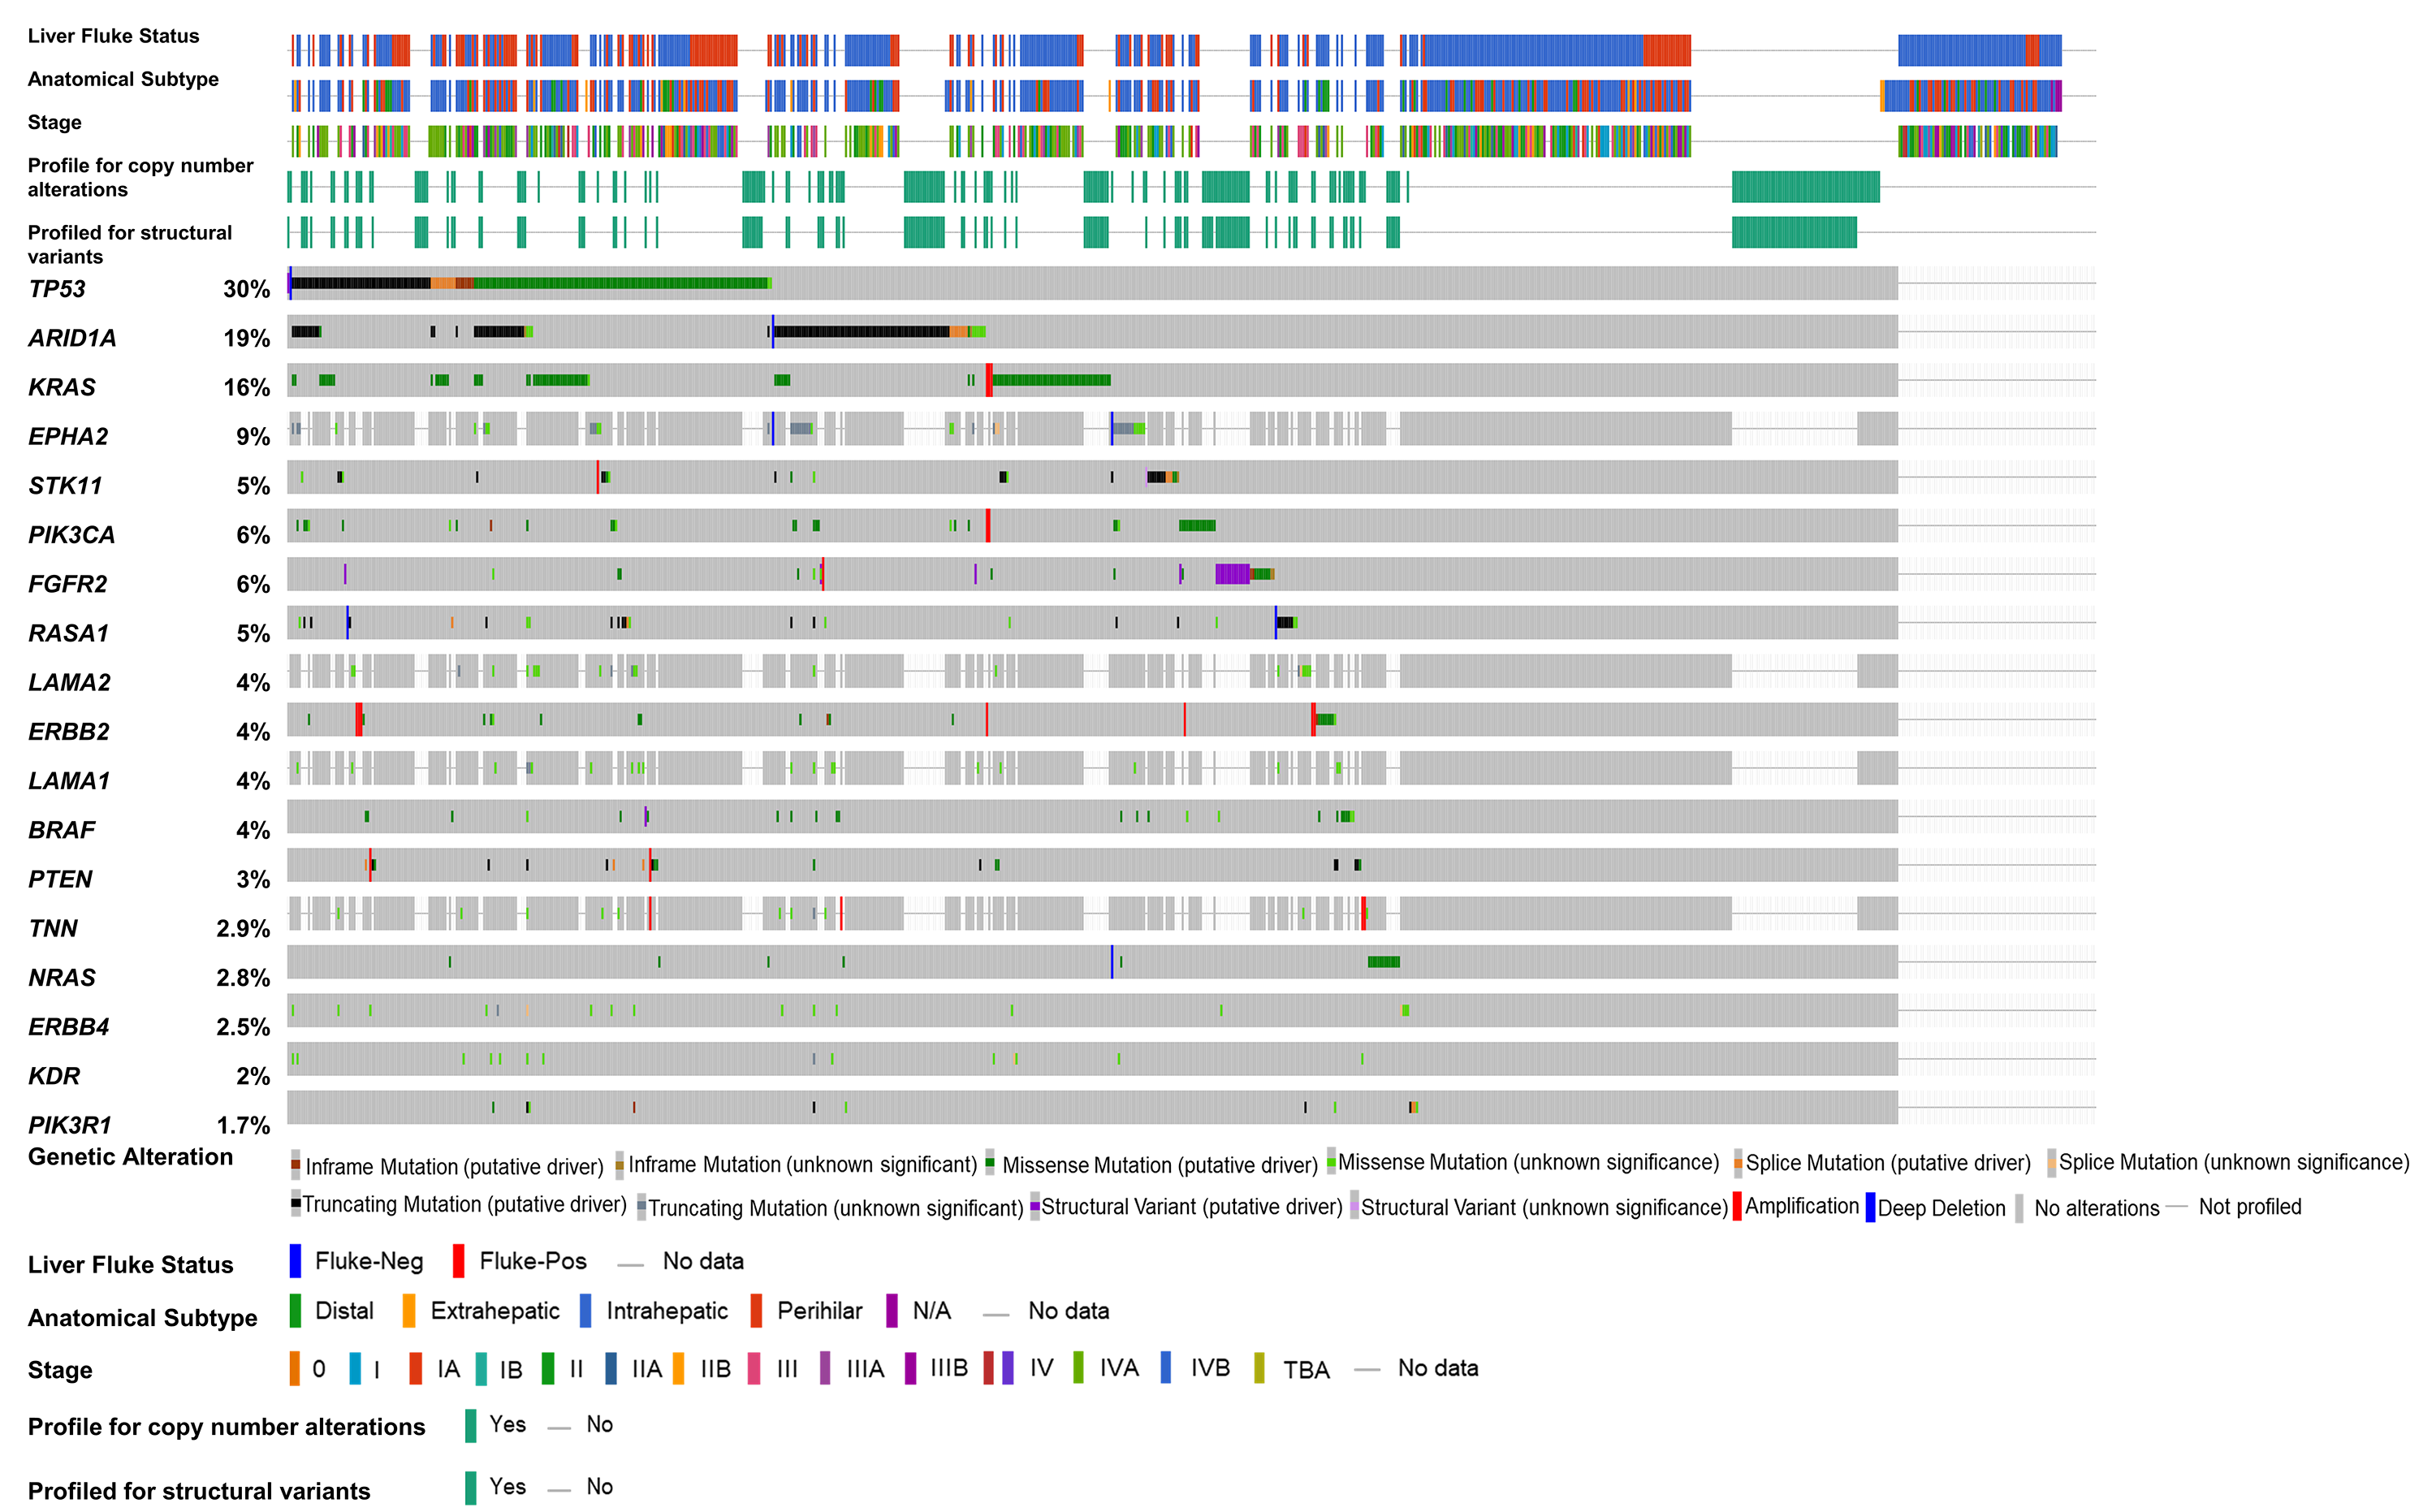
To address if inactivation of ARID1A in CCA was associated with alterations of PI3K/AKT signaling, the mutations of ARID1A and genes in RAS/PI3K/AKT pathway were assessed using cBioPortal. A total of 795 CCA patients were included in the present study. Among kinase-related genes, we selected 17 genes that were mutated (mutation frequency ≥1.7%) in CCA (Fig. S1). Somatic mutations of ARID1A were found in 19% (137/711) of CCA patients. Truncating ARID1A mutations were the most prevalent in ARID1A mutated CCA (85%, 116/137) (Figs. 1–2, 3A). The most common truncating ARID1A mutation observed in this cohort was frameshift deletion (G276Efs*87, G277Rfs*123 and M274Ifs*126, Fig. 2). Additionally, truncating ARID1A mutations were more common in advanced stage (stage II (18%, 20/112), III (13%, 12/93) and IV (20%, 31/153), Fig. 3C). Suggesting that ARID1A mutation were predominantly in CCA with high tumor stage and may involve in CCA progression. We then investigated if ARID1A mutations co-occurred with mutations in the kinase-related pathway (Fig. S1). Interestingly, ARID1A mutations were significantly correlated with mutations of EPHA2 (adjusted p<0.001), PIK3CA (adjusted p = 0.047), and LAMA1 (adjusted p = 0.024) (Table S2). EPHA2 was mutated in 9% (46/516) of CCA patients (Figs. 1 and 3A–3B). Truncating EPHA2 mutations were the most prevalent alterations in EPHA2 mutated CCA, particularly frameshift deletion (P460Rfs*33) (Figs. 1–2, 3A). Among EPHA2 mutant CCA tumors, 48% (22/46) harbored ARID1A mutations (Figs. 1, 3B). Of note, 82% (18/22) of EPHA2 mutant tumors co-occurred with ARID1A truncating mutations (Fig. 3B, Table S1). The frequency of PIK3CA mutations was 6% (41/711), and 80% (33/41) of PIK3CA-mutated CCA tumors were driver missense mutations (T1025A, E365K, E545K, E542K, C420R, Q546K, C901F, R38C, N345K, R88Q, R108H, M1043I, K111E, H1047R and H1047L) (Figs. 1–2, 3A and Table S1). We found that 37% (15/41) of CCA with PIK3CA mutations harbored ARID1A mutations. Of note, 30% (10/33) of CCA with PIK3CA driver missense mutations harbored ARID1A-truncated mutations (Fig. 3B, Table S1). LAMA1 was mutated in 4% (20/516) of CCA (Fig. 1). LAMA1 missense mutations were the most common mutations in CCA tumors (Figs. 2, 3A) and 50% (10/20) of LAMA1-mutated CCA co-occurring with ARID1A mutations (Fig. 1, Fig. 3B). Interestingly, 60% (6/10) of LAMA1-mutated CCA co-occurred with truncating mutations of ARID1A (Fig. 3B, Table S1). We did not detect any significant correlation between mutations in ARID1A and KRAS, BRAF, and NRAS. These results suggest interdependency between ARID1A mutations and alterations in the PI3K/AKT pathway, which may lead to activation of the PI3K/AKT pathway (Fig. S1).
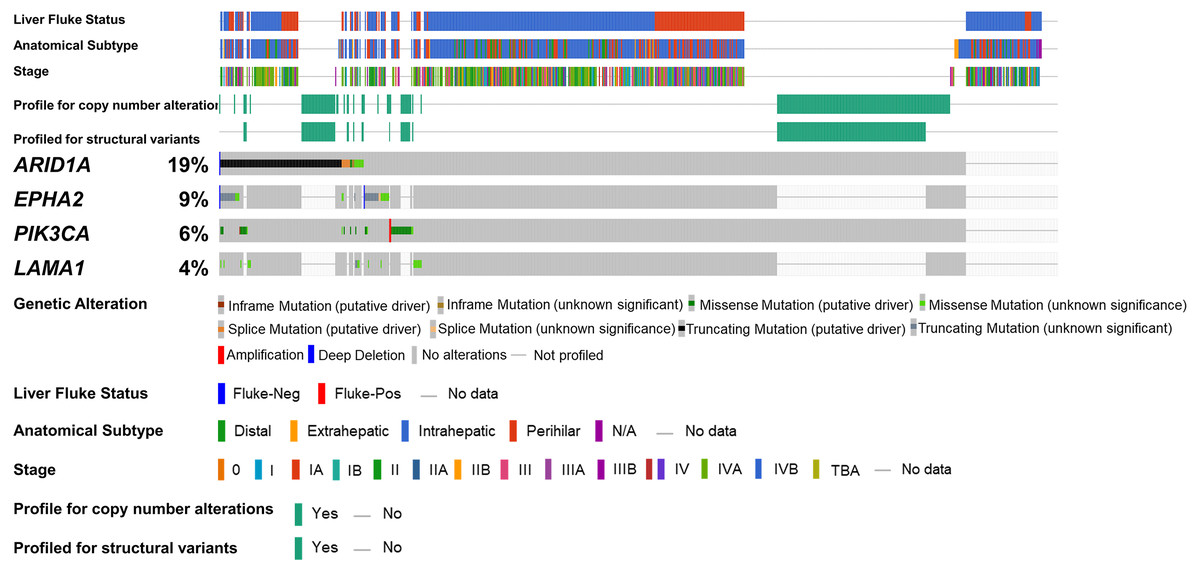
Figure 1: Genetic alterations of the ARID1A mutations with alterations of EPHA2, PIK3CA and LAMA1.
The oncoplot shows a co-occurrence pattern of ARID1A mutations with EPHA2, PIK3CA and LAMA1 genes in 795 CCA patients.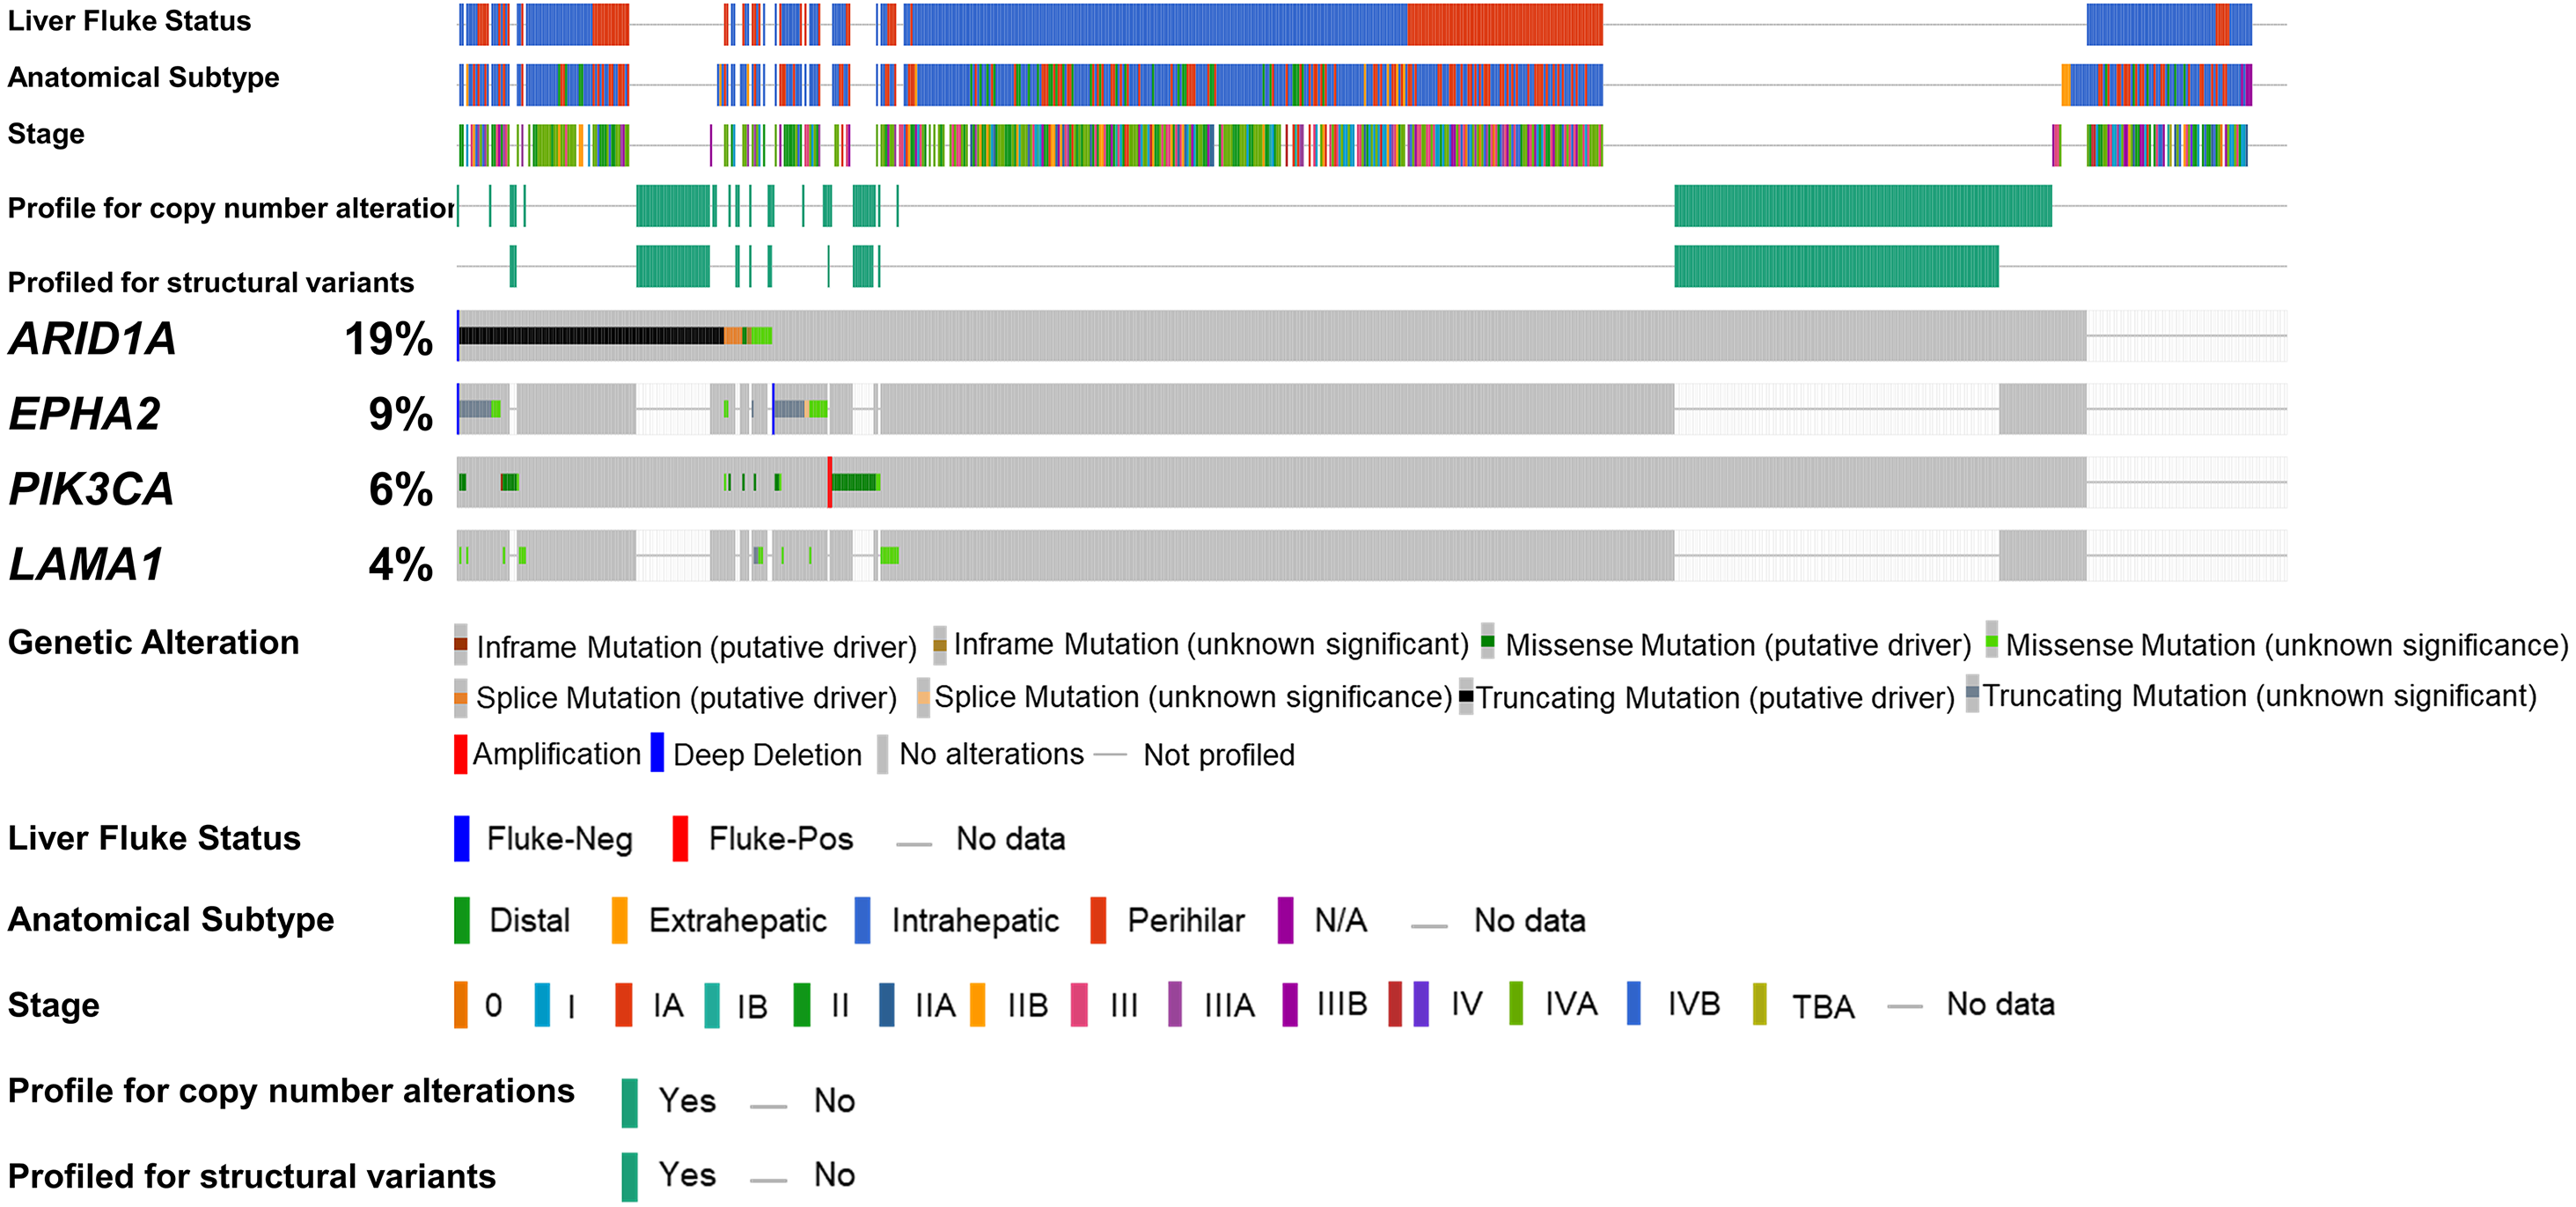
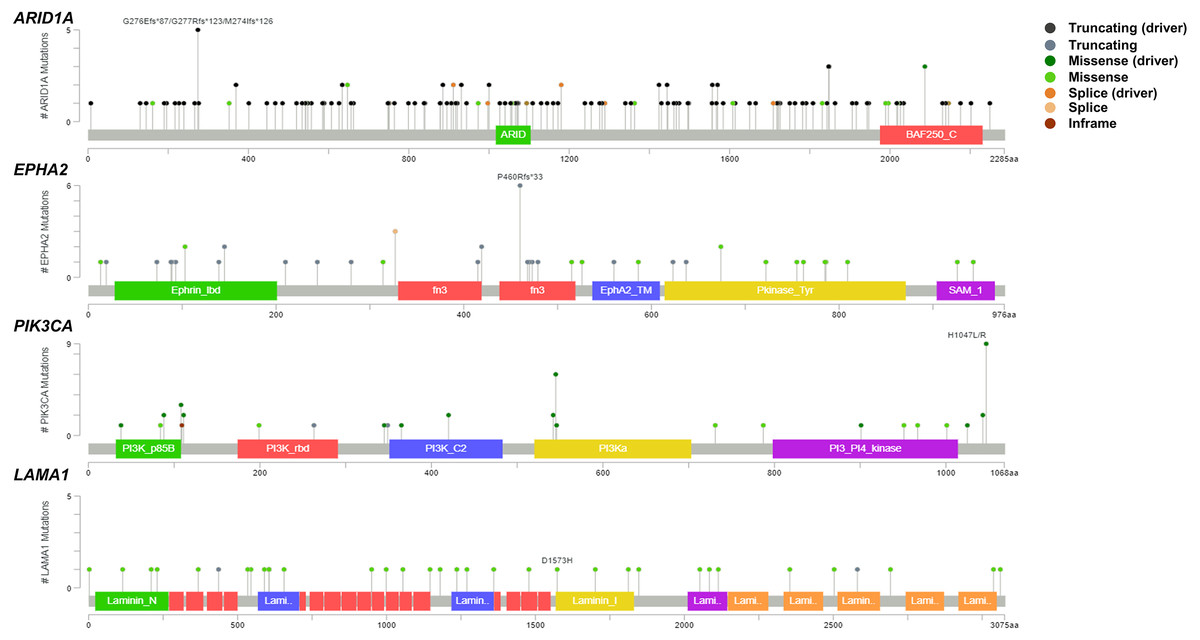
Figure 2: Variant distribution of ARID1A, EPHA2, PIK3CA and LAMA1 genes in 795 CCA patients.
Lollipop plots showing the distribution of ARID1A, EPHA2, PIK3CA and LAMA1 genes in CCA patients. The most frequent variant alterations are annotated as on top of the plots.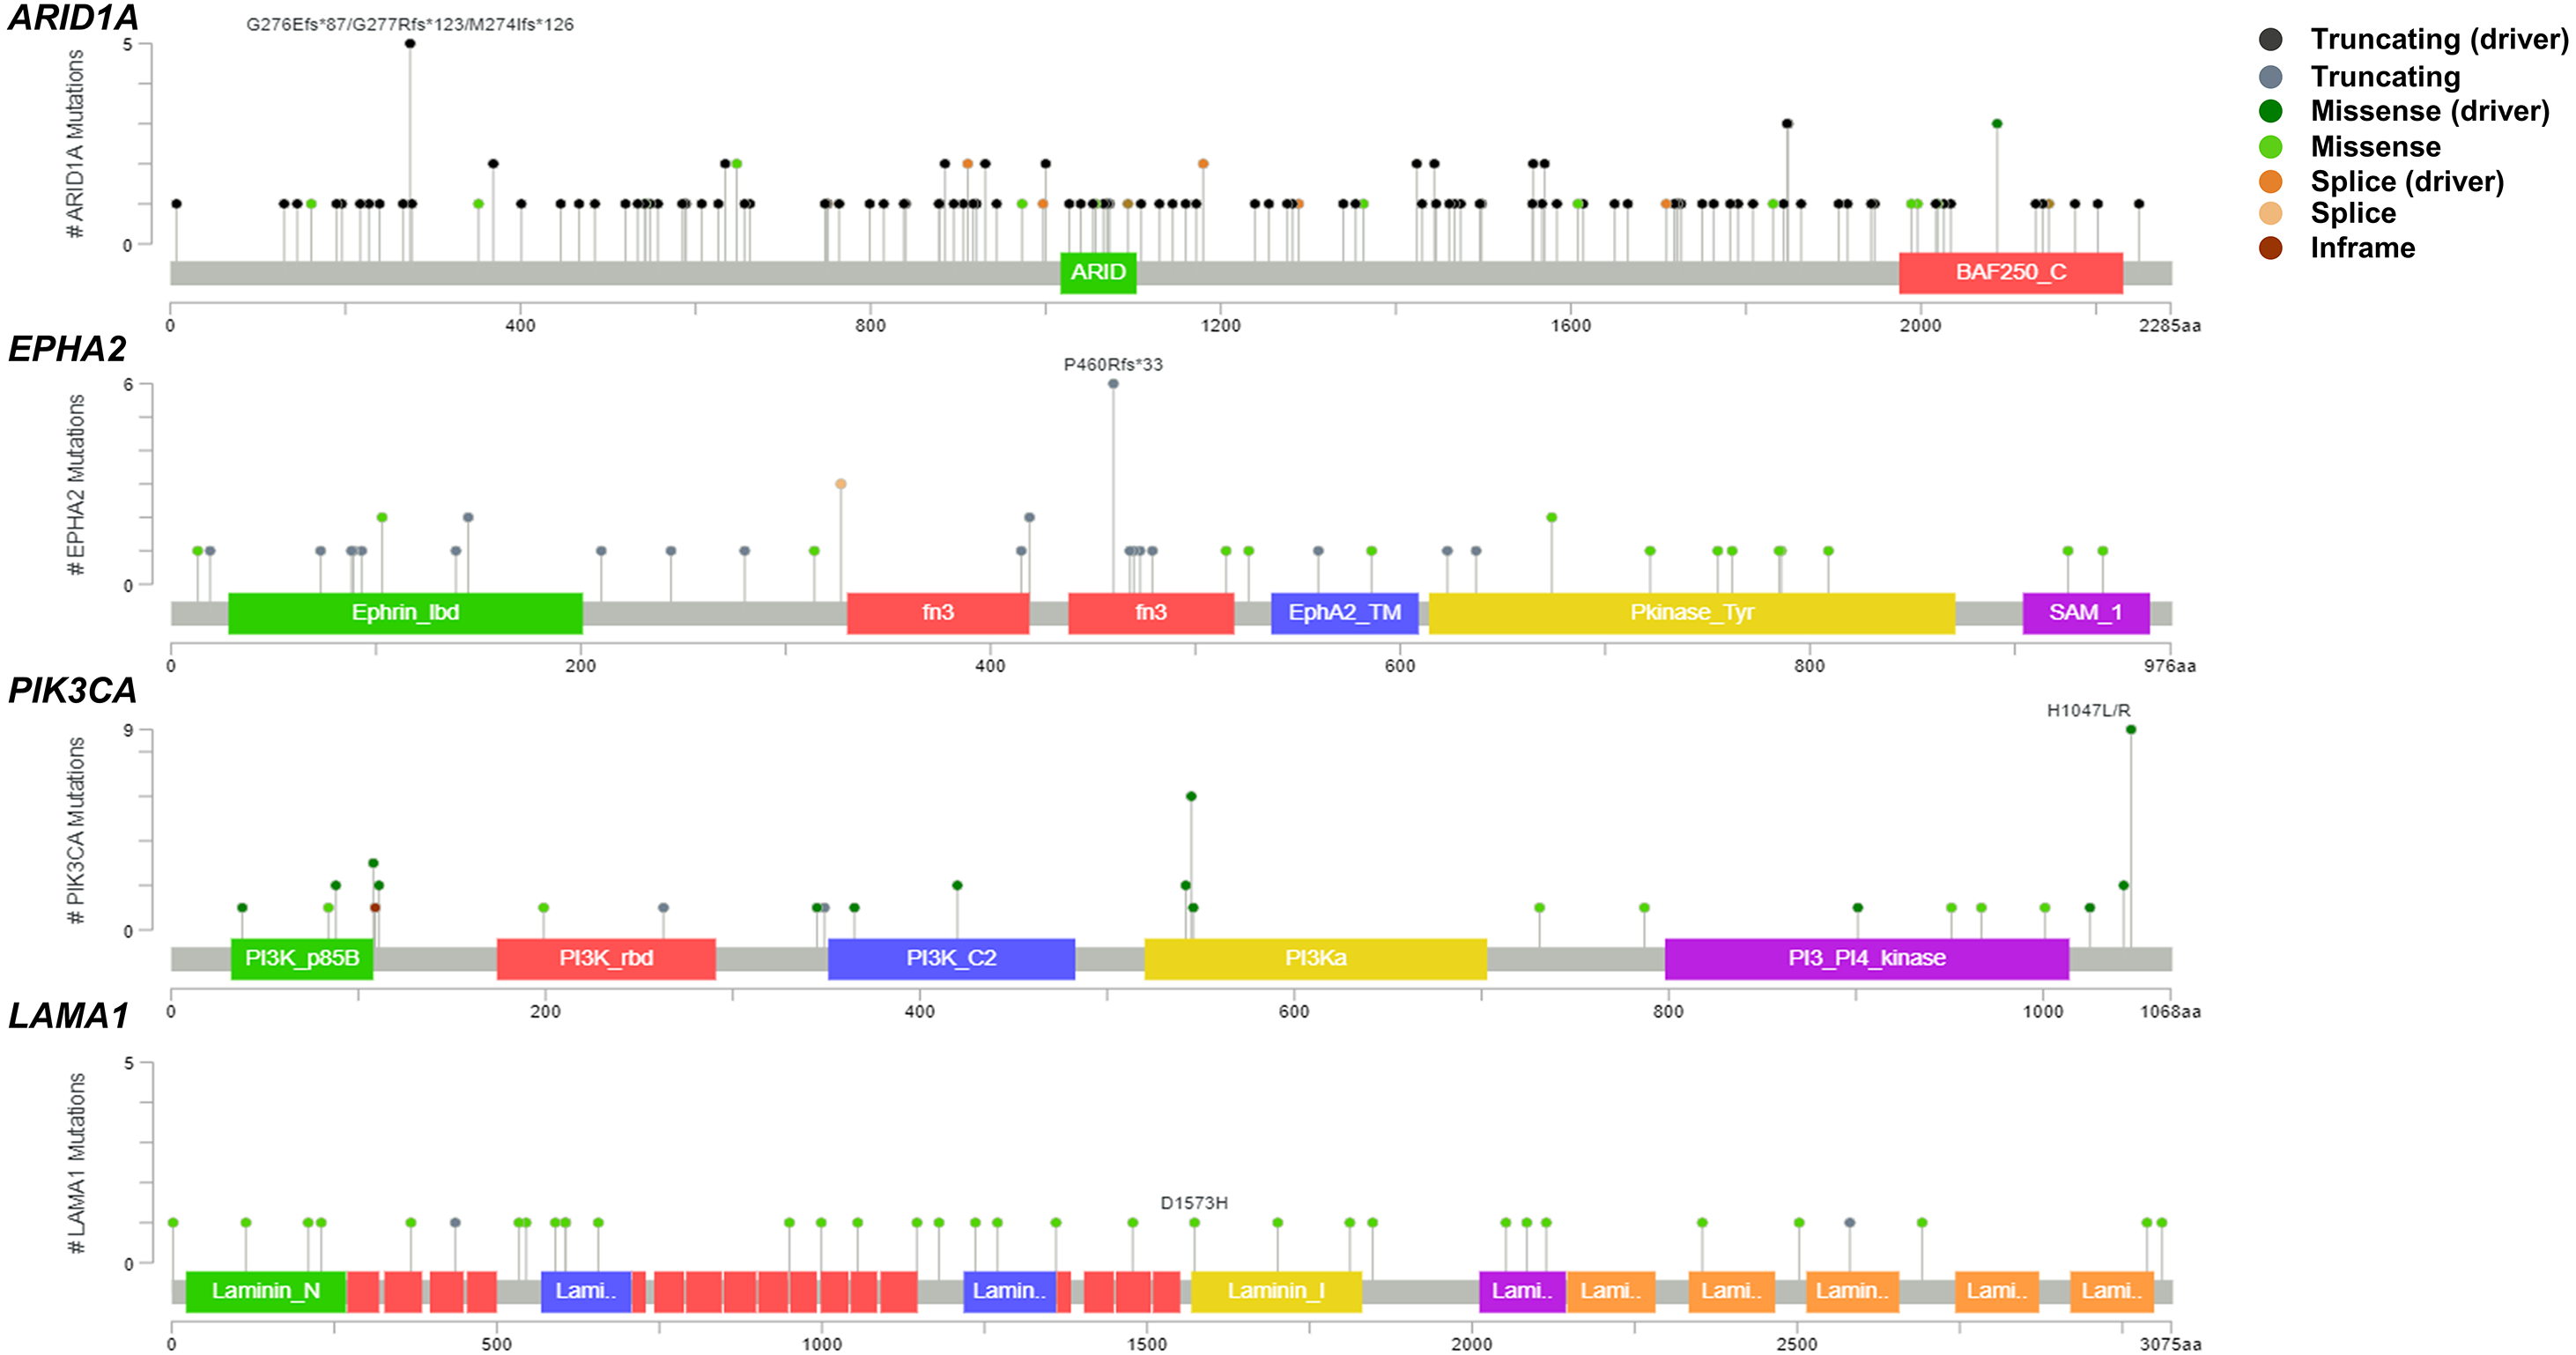
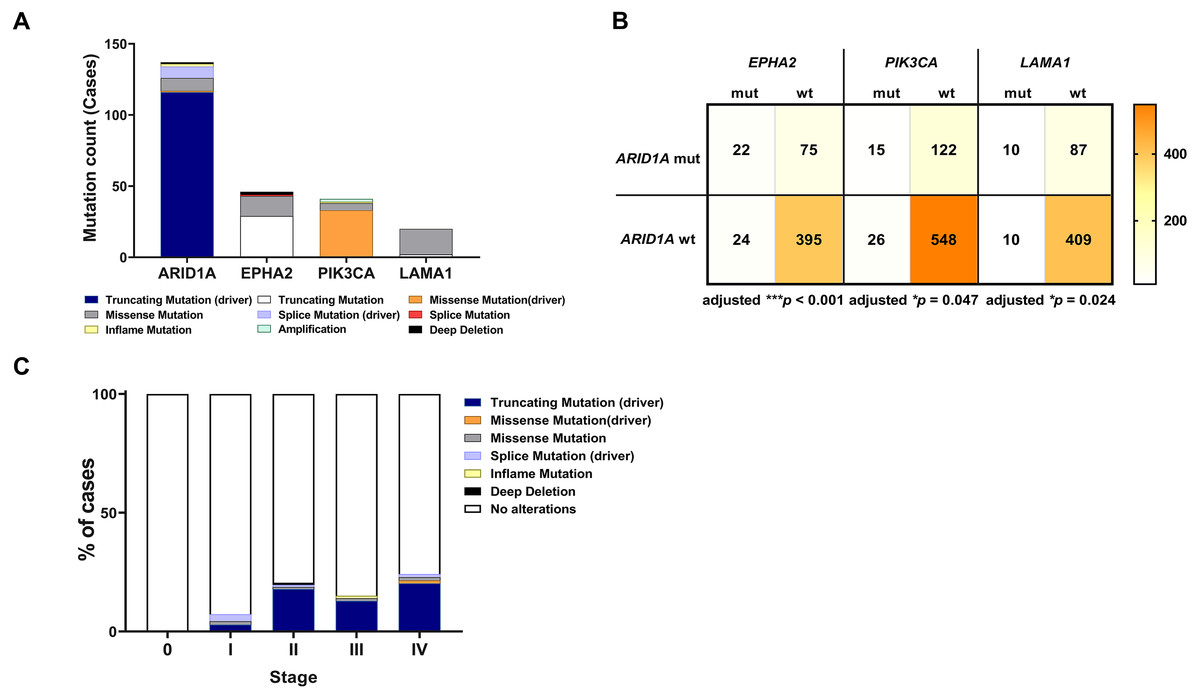
Figure 3: Frequencies of the ARID1A alterations and its co-occurrence with alterations of EPHA2, PIK3CA, LAMA1 and CCA staging.
(A) Frequencies of ARID1A, EPHA2, PIK3CA, and LAMA1 mutations in the cBioPortal database. (B) The co-alteration incidence for ARID1A, EPHA2, PIK3CA, and LAMA1 mutation. (C) Frequencies of ARID1A gene mutations changes across different stages of CCA. adjusted * p < 0.05, adjusted ** p < 0.01, adjusted *** p < 0.001 was considered statistically significant (mut: mutant, wt: wild-type).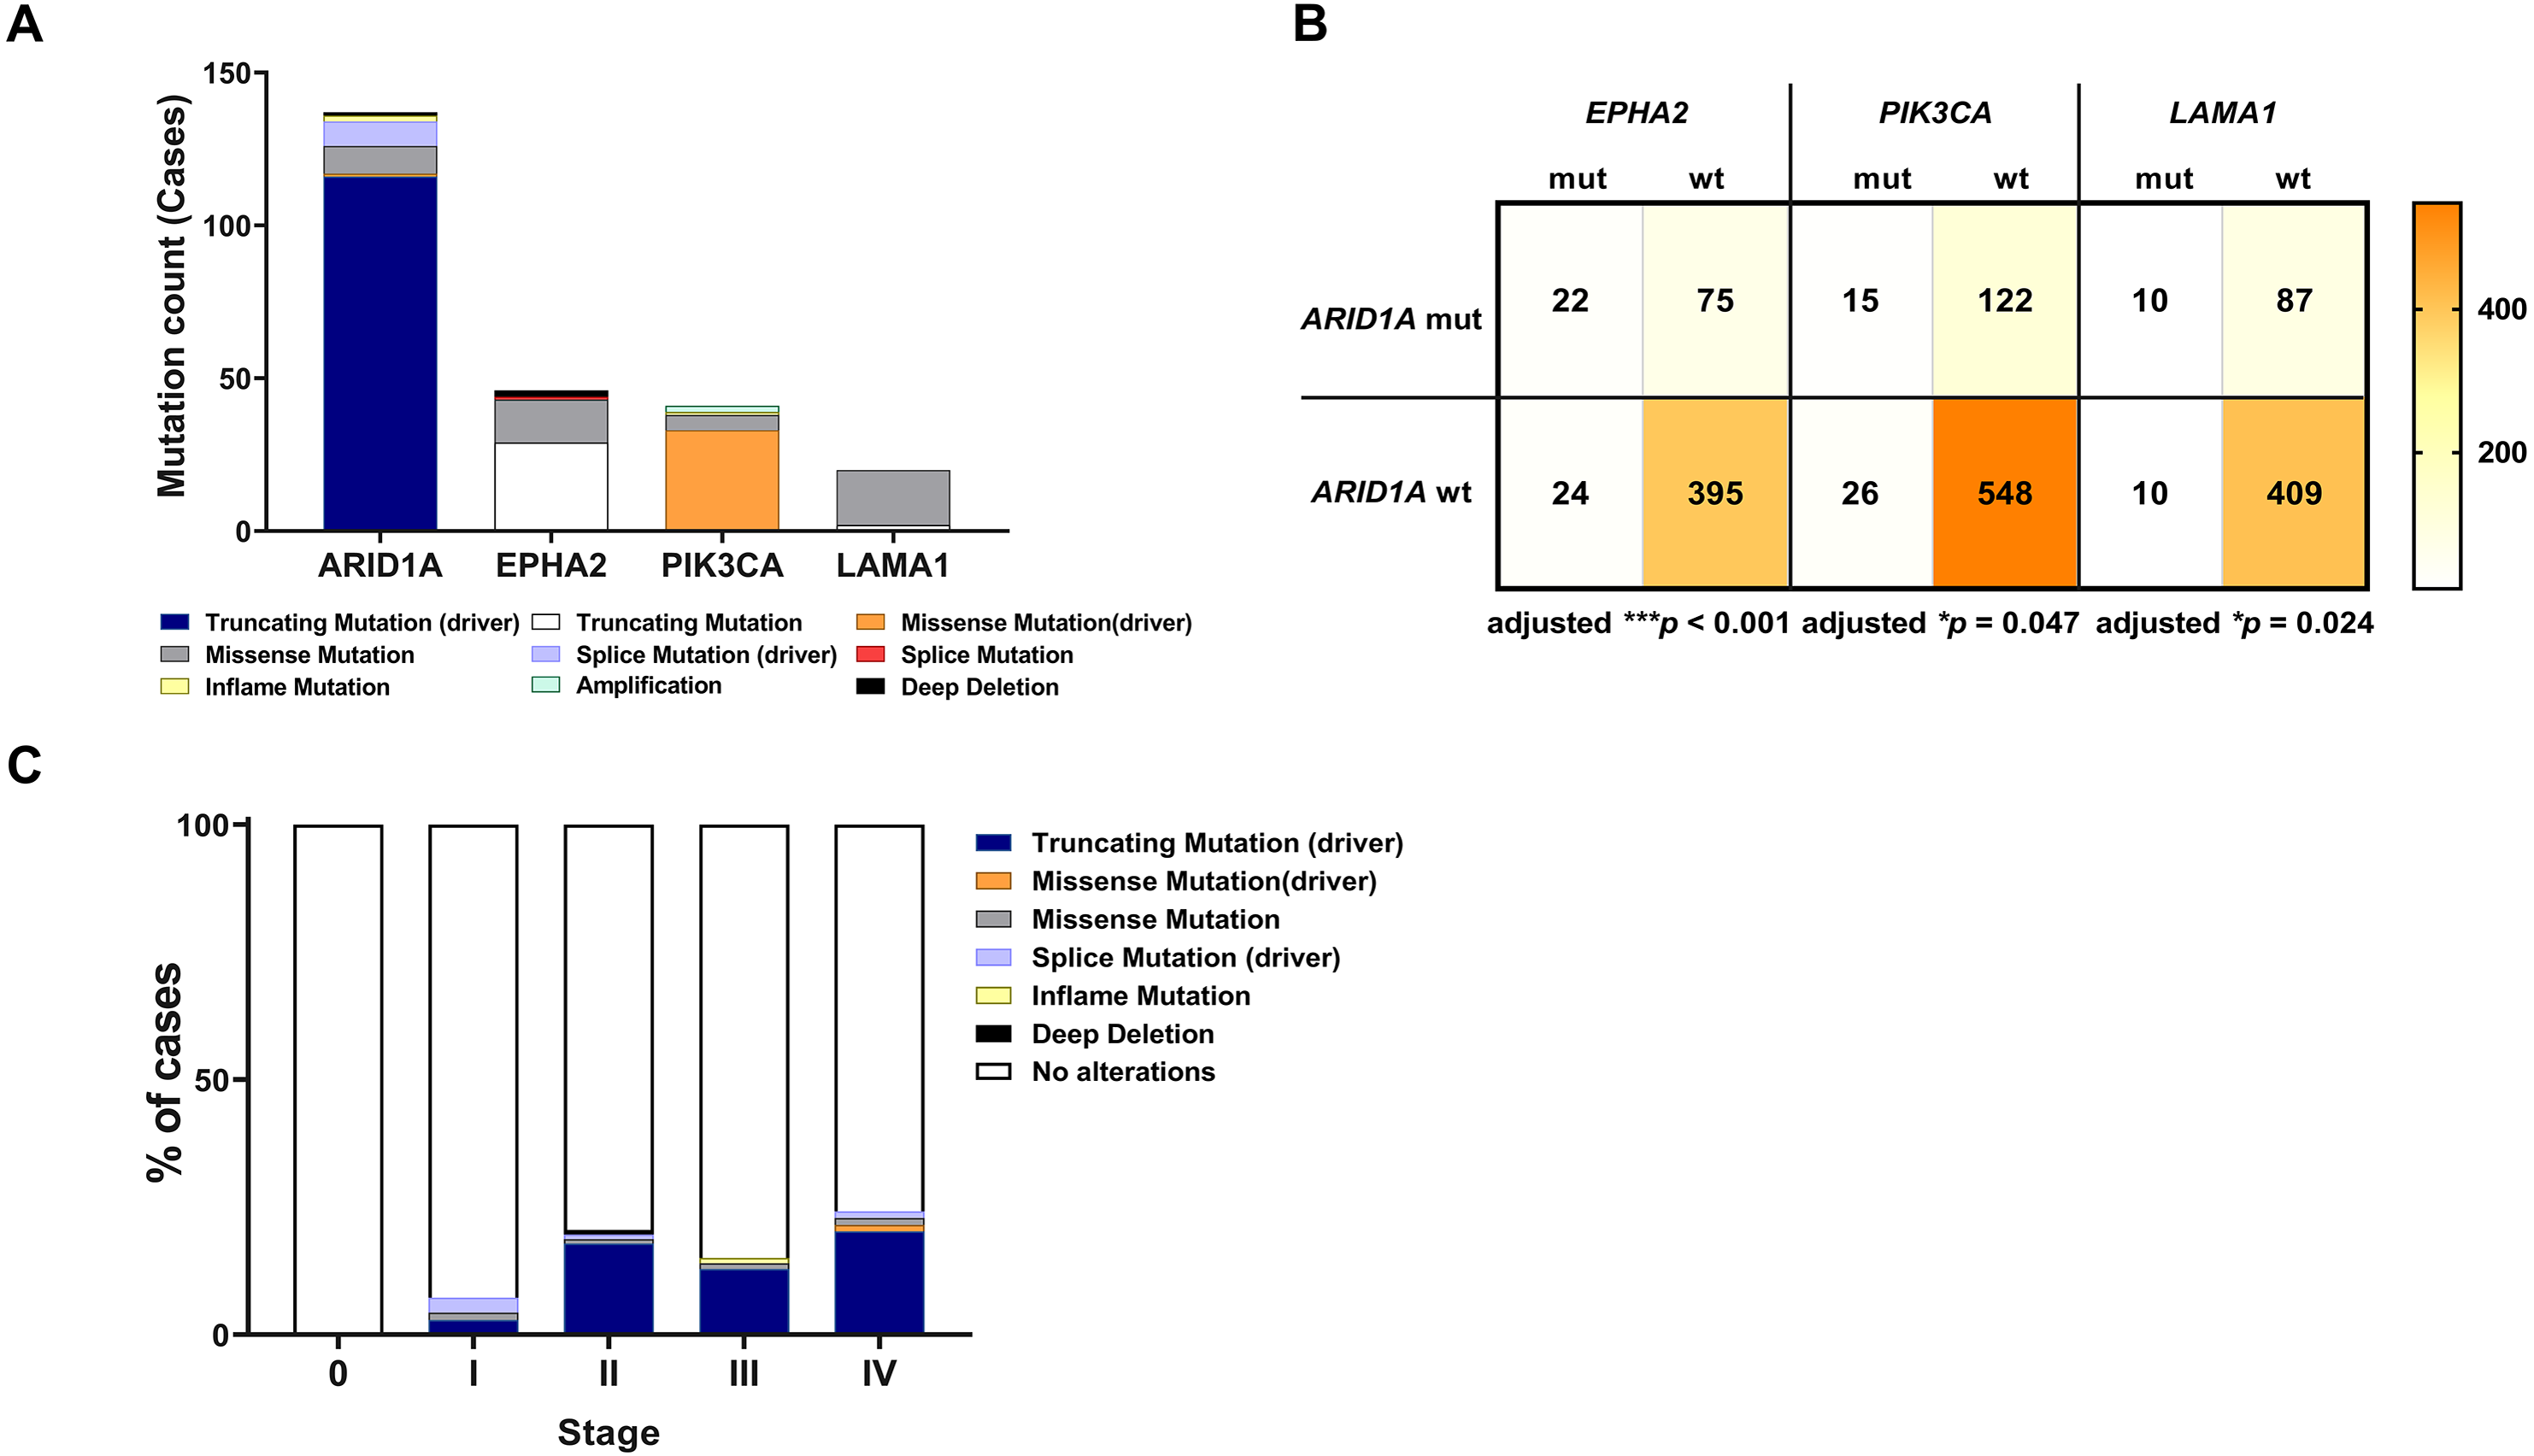
Coexistent ARID1A-EPHA2 mutations associated with shorter overall survival in CCA patients
To examine the prognostic survival values of mutational co-occurrence between mutations of ARID1A, EPHA2, PIK3CA and LAMA1 in CCA, we further performed survival analysis in CCA tumors with or without mutations of ARID1A, EPHA2, PIK3CA and LAMA1 (Table S1). As shown in Fig. 4A, there was no significant correlation between ARID1A mutations and overall survival (p = 0.190, log-rank test), while co-occurrence of ARID1A-EPHA2 mutations was significantly correlated with poor overall survival (HR = 2.651; 95% CI [1.34–6.19]; p < 0.001, log-rank test, Fig. 4B). In addition, patients with ARID1A-EPHA2 mutations were found to have a shorter overall survival compared to patients with ARID1A mutations (HR = 1.905; 95% CI [0.92–3.95]; p = 0.024, log-rank test, Fig. 4C). In contrast, coexistent ARID1A-PIK3CA mutations and ARID1A-LAMA1 mutations was not significantly associated with shorter overall survival (HR = 1.122; 95% CI [0.50–2.54]; p = 0.768 and HR = 0.598; 95% CI [0.25–1.66]; p = 0.371, respectively, log-rank test, Figs. 4D–4E). The insignificant shortening survival rate of the ARID1A-PIK3CA mutations and ARID1A-LAMA1 mutations might be a result of limited power of sample size (n = 9 and n = 6, respectively).
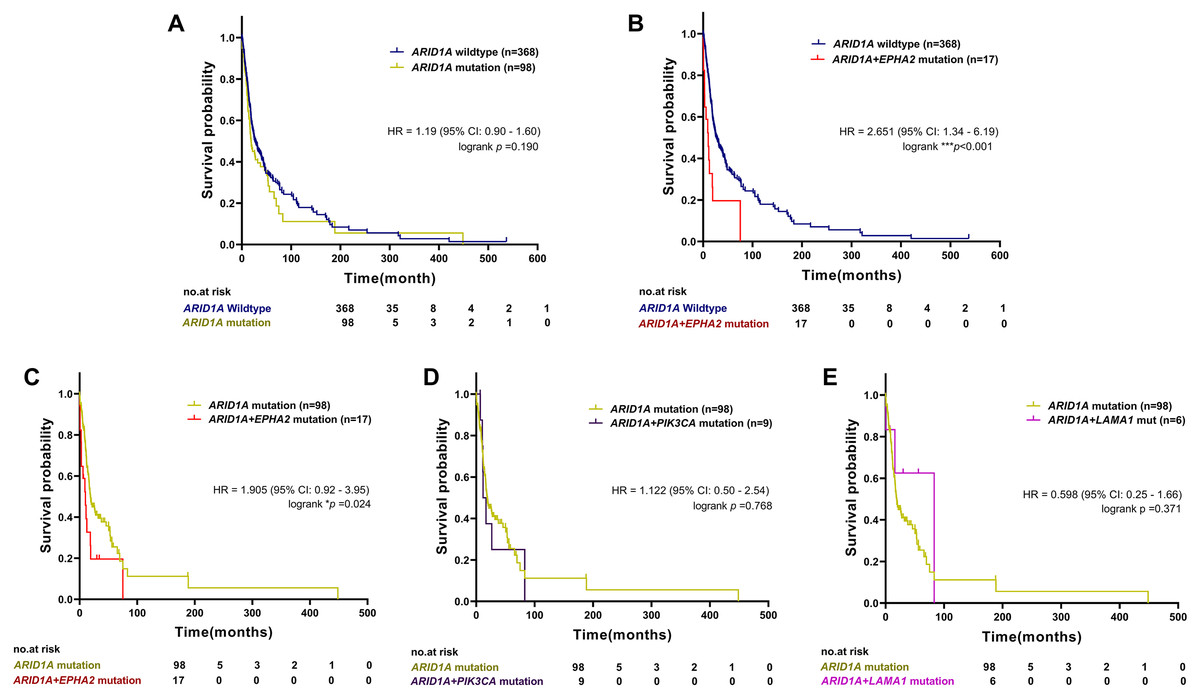
Figure 4: The prognostic value of ARID1A mutations and co-existent mutations with EPHA2, PIK3CA, and LAMA1.
Kaplan–Meier survival analysis of overall survival in four selected studies cohort. Data were retrieved from the cBioPortal database. *p < 0.05, **p < 0.01, ***p < 0.001 was considered statistically significant.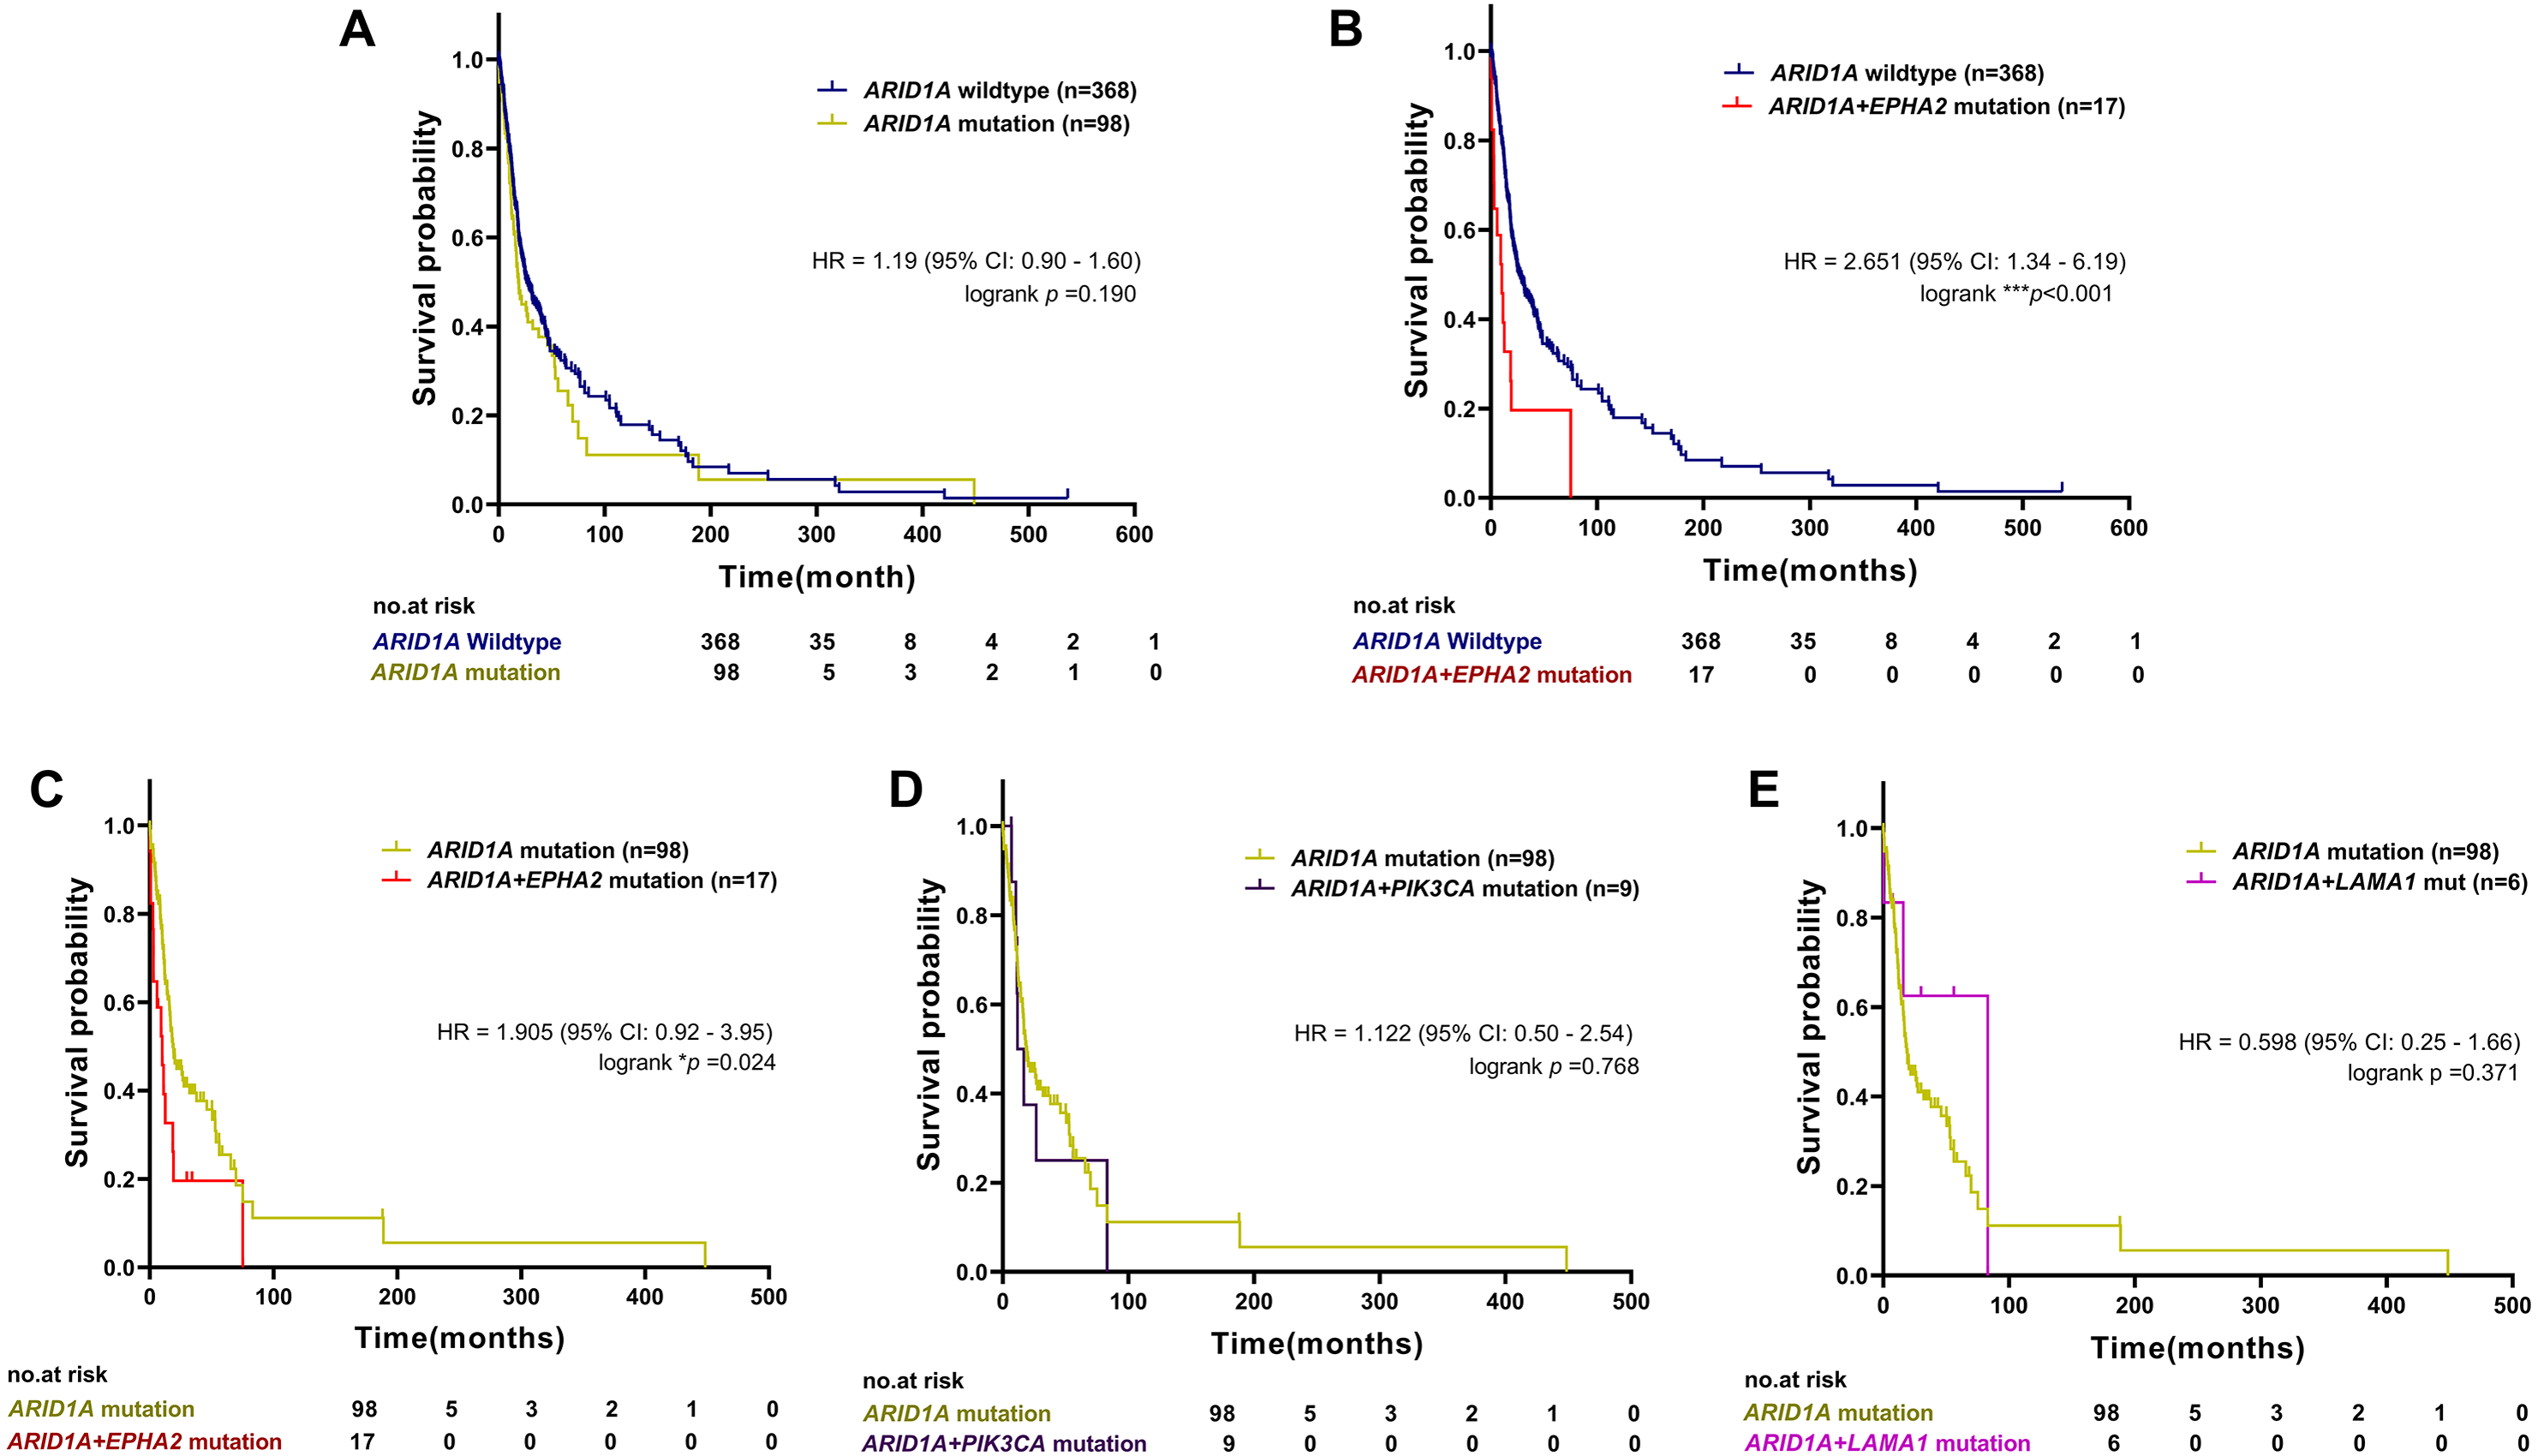
Loss of ARID1A expression in CCA cell lines led to increased sensitivity towards the AKT-inhibitor MK-2206
Several studies suggest the interdependency between loss of ARID1A protein expression and PI3K/AKT pathway activation which may also be more vulnerable to its inhibition (Samartzis et al., 2014; Zhang et al., 2016; Lee et al., 2017). We previously demonstrated that CCA tumors with ARID1A truncating mutations exhibited the loss or reduction of ARID1A protein expression (Namjan et al., 2020). However, the effect of PI3K/AKT inhibitor has not been well-defined in ARID1A-deficient CCA. The effect of MK-2206, however, has been investigated in early clinical trials of biliary tract cancers (NCT01425879) (Ahn et al., 2015). We therefore evaluated the effect of MK-2206 specifically in ARID1A-deficient CCA in vitro. To investigate sensitivity to treatment with MK-2206, we examined the effect of MK-2206 on cell viability in CCA cell lines. Among five CCA cell lines, KKU-213A, KKU-100 and HUCCT1 showed higher level of ARID1A protein expression compared to KKU-452 and KKU-055 cells (Figs. 5A–5B). Based on ARID1A protein expression, 4 CCA cell lines were selected as representative cells of ARID1A-depleted CCA cells (KKU-452 and KKU-055) and ARID1A-intact CCA cell lines (KKU-213A and KKU-100) for cell viability analysis. ARID1A-depleted CCA cells, KKU-452 and KKU-055 were found to be significantly more sensitive to treatment with MK-2206 (Fig. 5C). The IC50 values of KKU-452 and KKU-055 cells were 69 ± 13 µM and 85 ± 6 µM, 24 h, respectively, while the IC50 values of KKU-213A and KKU-100 cells were 152 ± 17 µM, and 120 ± 9 µM, 24 h, respectively (p = 0.016, Kruskal–Wallis test, Fig. 5D and Table S3). These results show that ARID1A-deficient CCA cells are vulnerable to MK-2206.
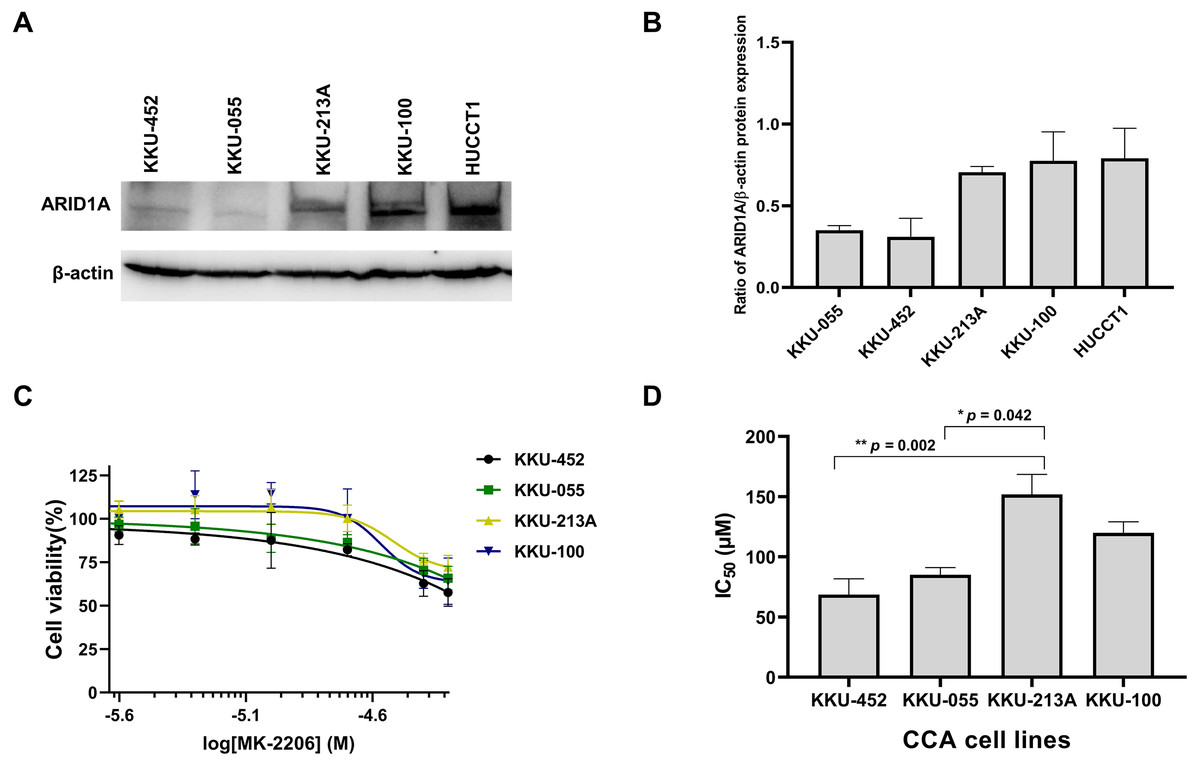
Figure 5: Loss of ARID1A expression leads to increased sensitivity towards MK-2206 in ARID1A-deficient CCA cell lines.
(A–B) Western blot for the screening of ARID1A expression in five CCA cell lines. (C) The effect of MK-2206 (0–50 µM) on cell viability in CCA cell lines. (D) ARID1A-depleted CCA cell lines (KKU-452 and KKU-055) were more sensitive to the treatment with MK-2206 when compared to KKU-213A and KKU-100 cells. Cell viability was measured by a MTT assay after 24 h of treatment. *p = 0.042, **p = 0.002, pairwise comparisons.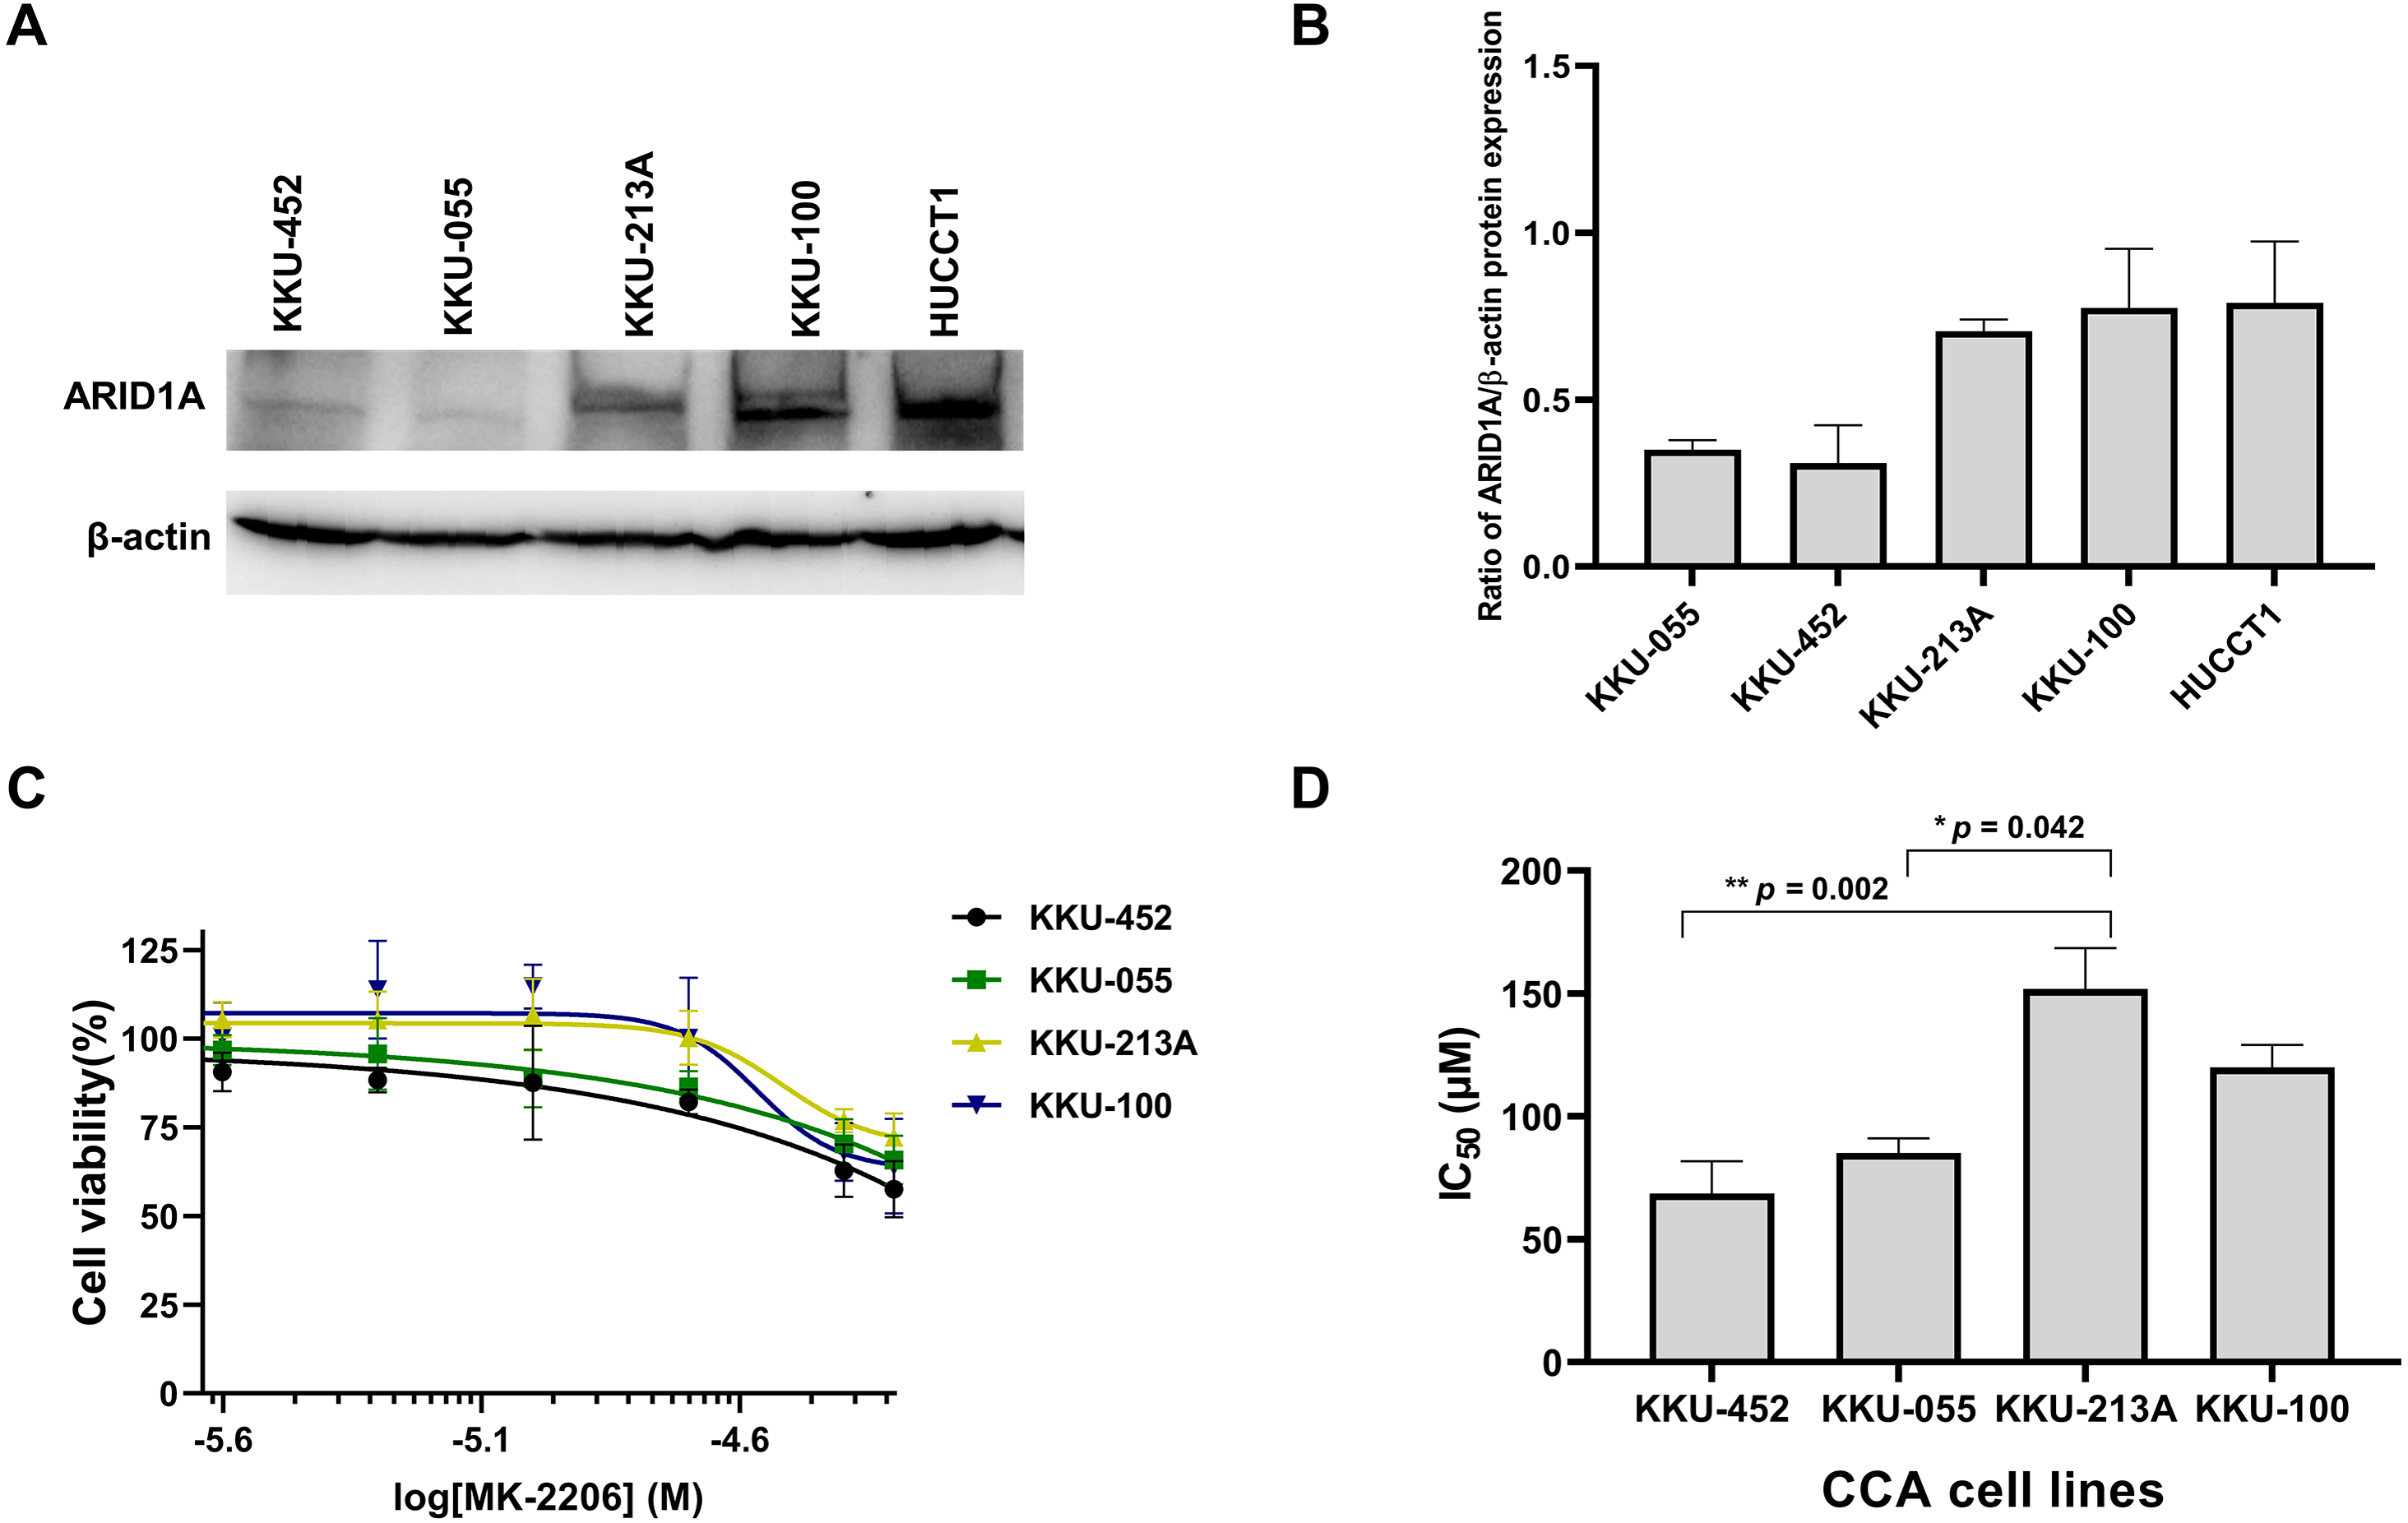
ARID1A knockdown increased sensitivity to treatment with MK-2206
To confirm the effect of MK-2206 in ARID1A-deficient CCA cells, ARID1A-knockdown KKU-213A and HUCCT1 cell lines were used to investigate cell viability after the treatment with MK-2206. ARID1A-knockdown KKU-213A and HUCCT1 cell lines were treated with 2.5–50 µM of the MK-2206, for 24, 48 and 72 h, followed by cell viability detection. Decreased expression of ARID1A in ARID1A-knockdown cell lines was confirmed at mRNA and protein levels (Figs. 6A–6B). ARID1A-knockdown KKU-213A and HUCCT1 cell lines showed higher sensitivity towards treatment with MK-2206 when compared to the non-targeted shRNA control cells (Figs. 6C–6D). The IC50 values of ARID1A-knockdown KKU-213A cells were significantly decreased (shARID1A#1 = 24 ± 5 µM and shARID1A#2 = 24 ± 7 µM, 24 h, p = 0.016, Fisher’s LSD test) when compared to the control (IC50 = 41 ± 8 µM, 24 h, Fig. 6E and Table S3). Likewise, the IC50 values of ARID1A-knockdown HUCCT1 cells significantly decreased (shARID1A#1 = 21 ± 2 µM and shARID1A#2 = 19 ± 2 µM, 24 h, p = 0.027 and 0.013, respectively, Fisher’s LSD test) when compared to the control (IC50 = 33 ± 8 µM, 24 h, Fig. 6F and Table S3).
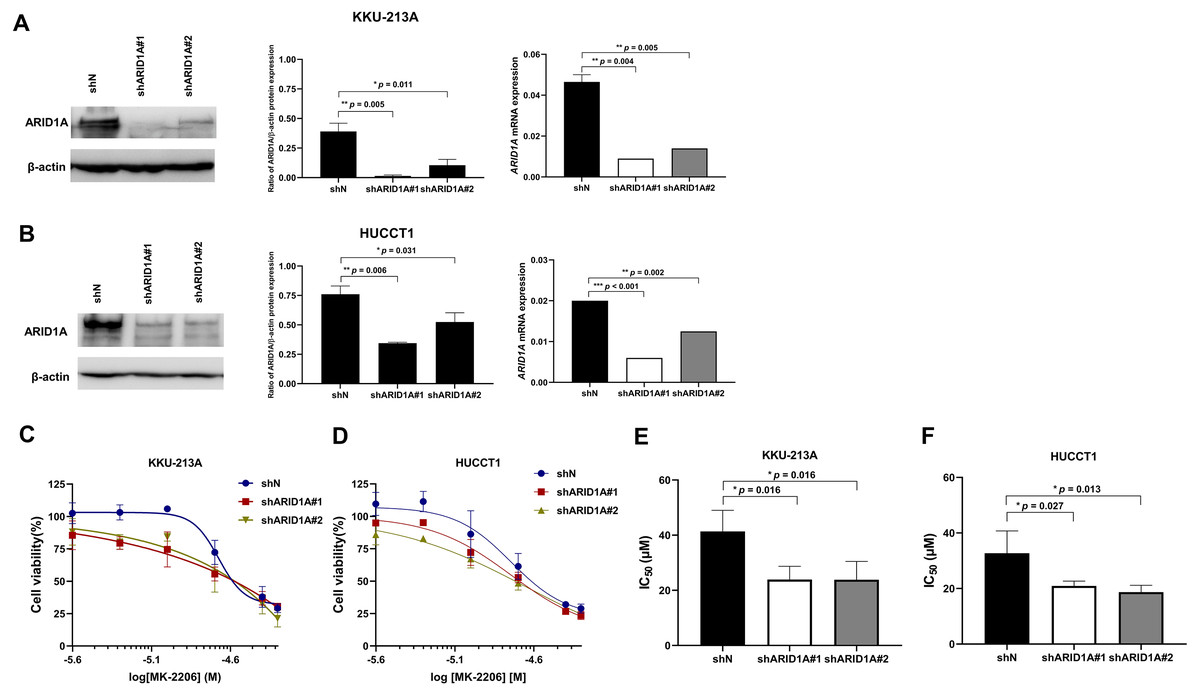
Figure 6: ARID1A-knockdown CCA cell lines show increased sensitivity towards MK-2206.
(A–B) ARID1A protein and mRNA expression were decreased in ARID1A-knockdown CCA cell lines (A: KKU-213A, B: HUCCT1) using a different shRNA sequence for ARID1A (shARID1A#1 and shARID1A#2) compared to non-targeting shRNA control cells (shN). (C–D) The effect of MK-2206 (0-50 M) on cell viability in ARID1A-knockdown CCA cell lines (C: KKU-213A, D: HUCCT1). Cells were treated with 2.5–50 µM of MK-2206 for 24 h and cell viability was measured using MTT assay. (E–F) The IC50 values of ARID1A-knockdown CCA cell lines (E: KKU-213A, F: HUCCT1) decreased compared to the control (shN). *p < 0.05, **p < 0.01, ***p < 0.001 was considered statistically significant.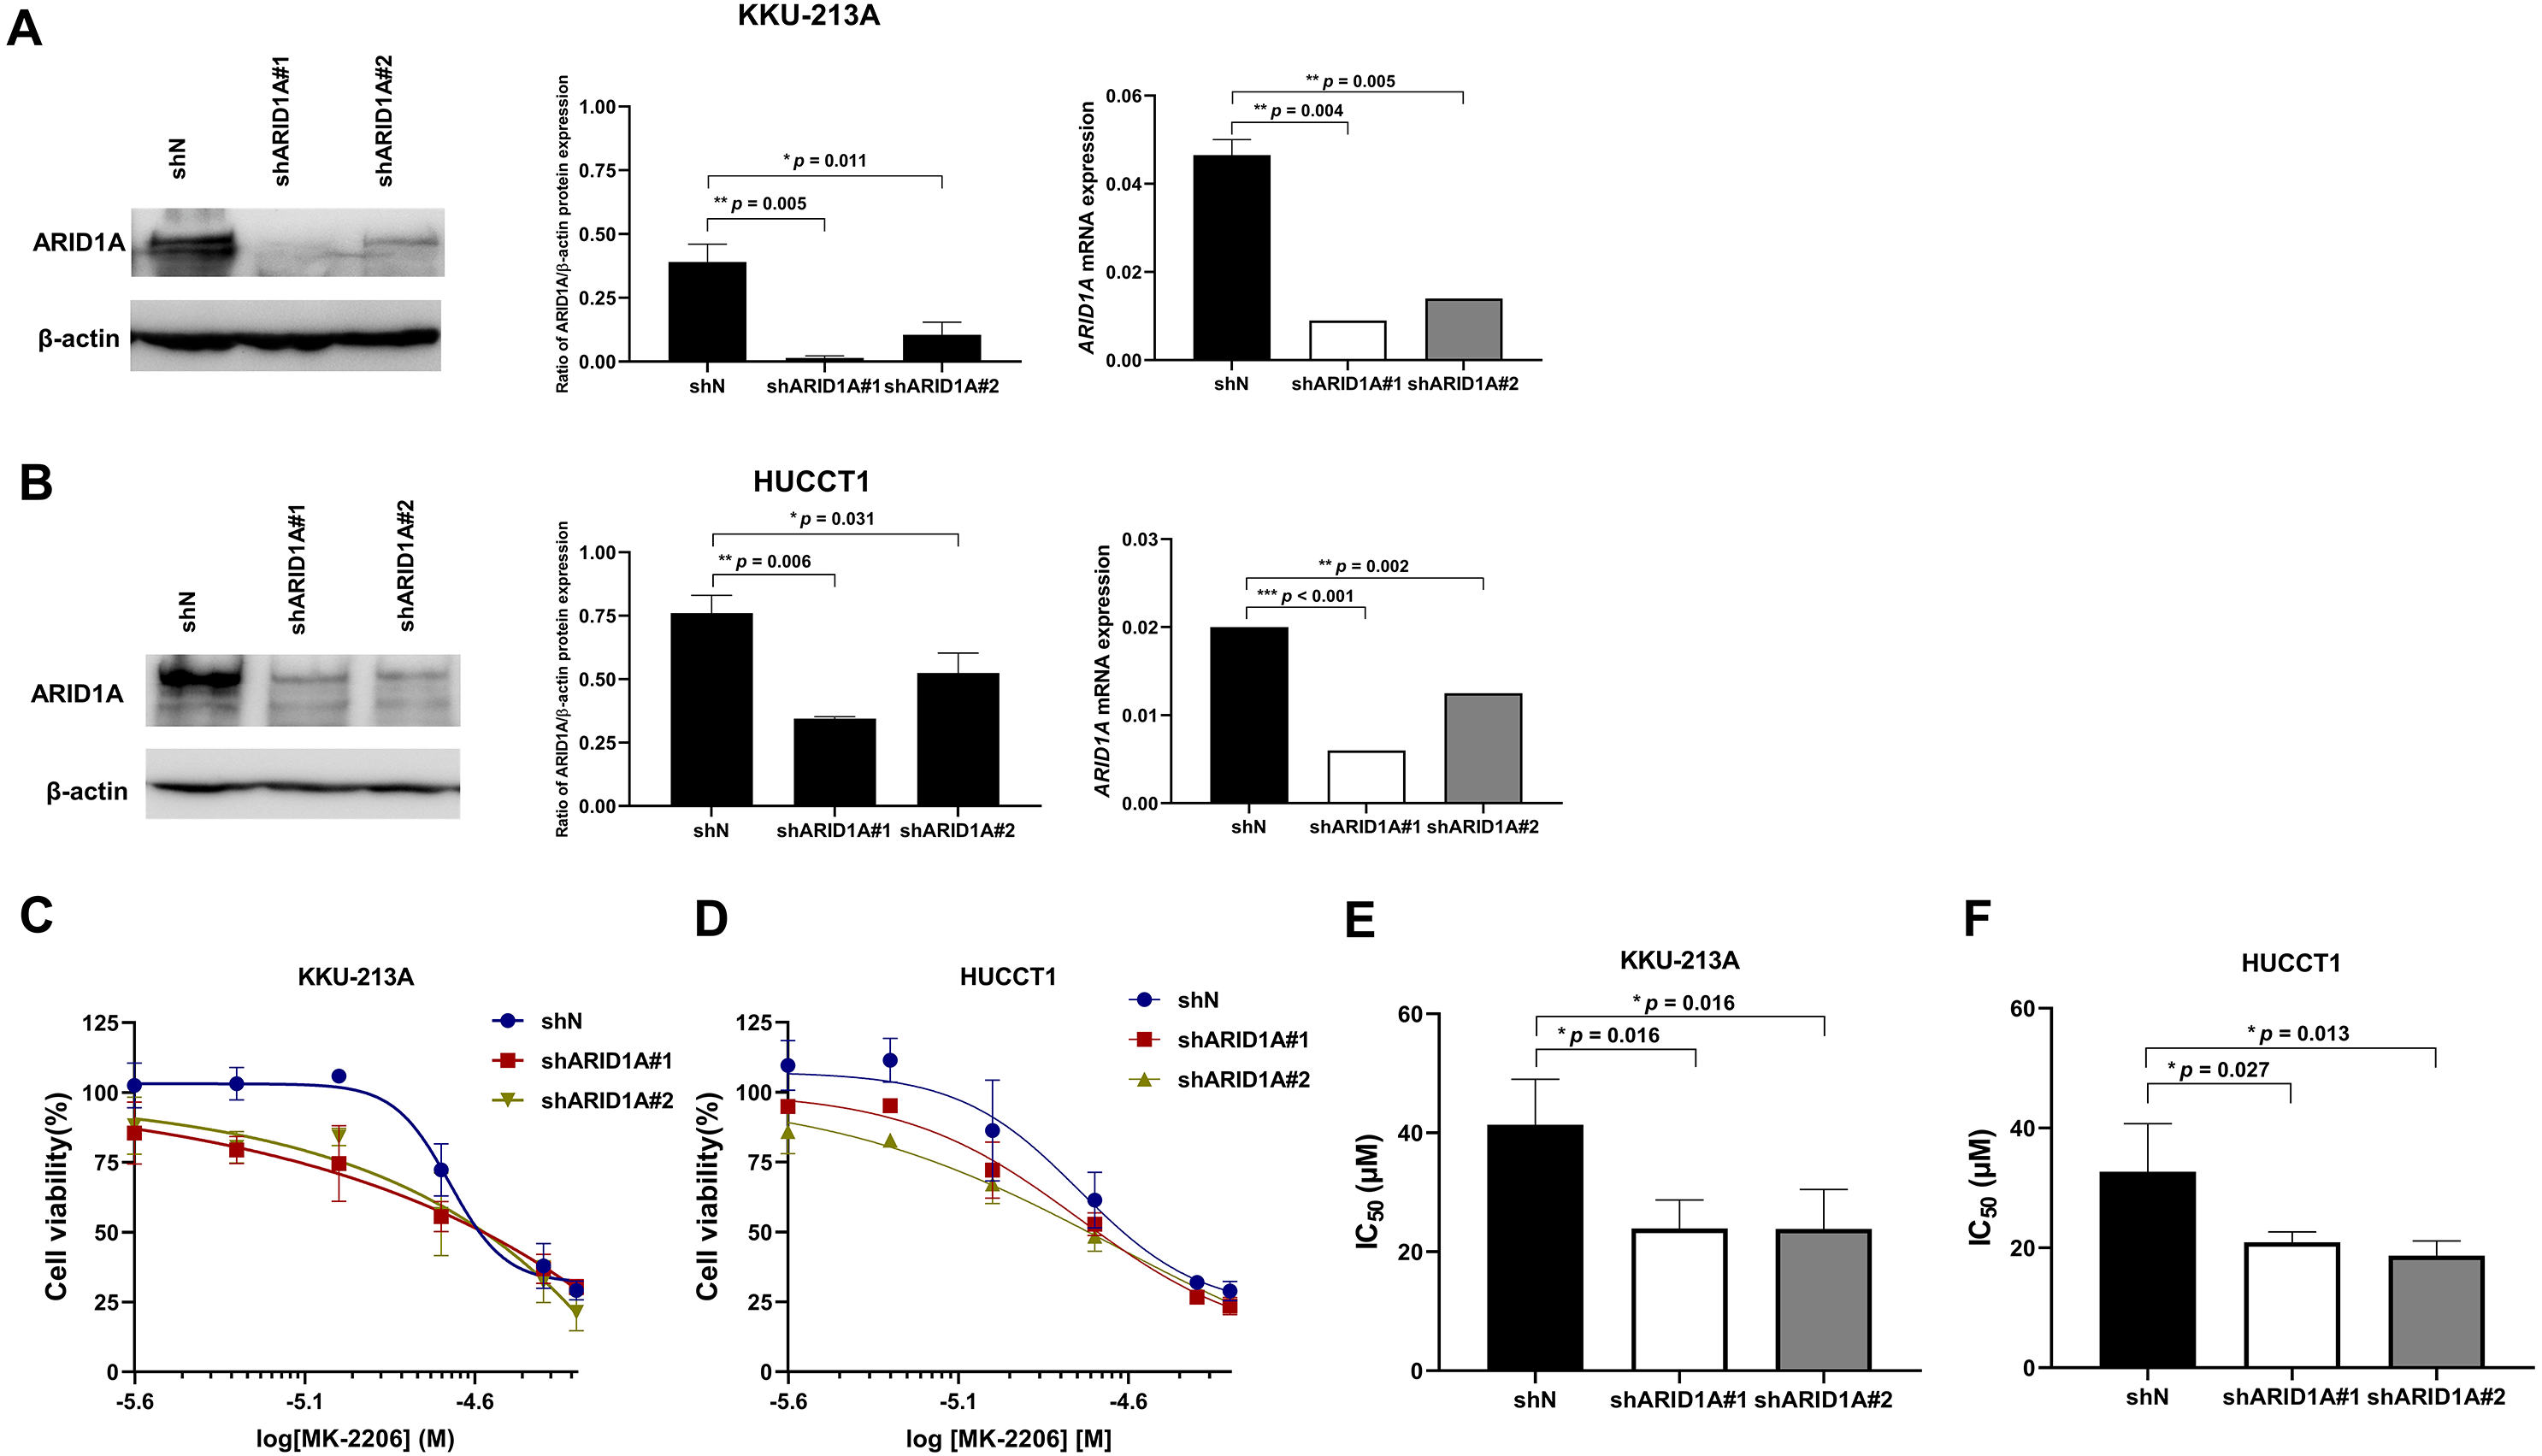
AKT inhibition induced apoptosis in ARID1A-knockdown CCA cell lines and decreased phosphorylation of AKT
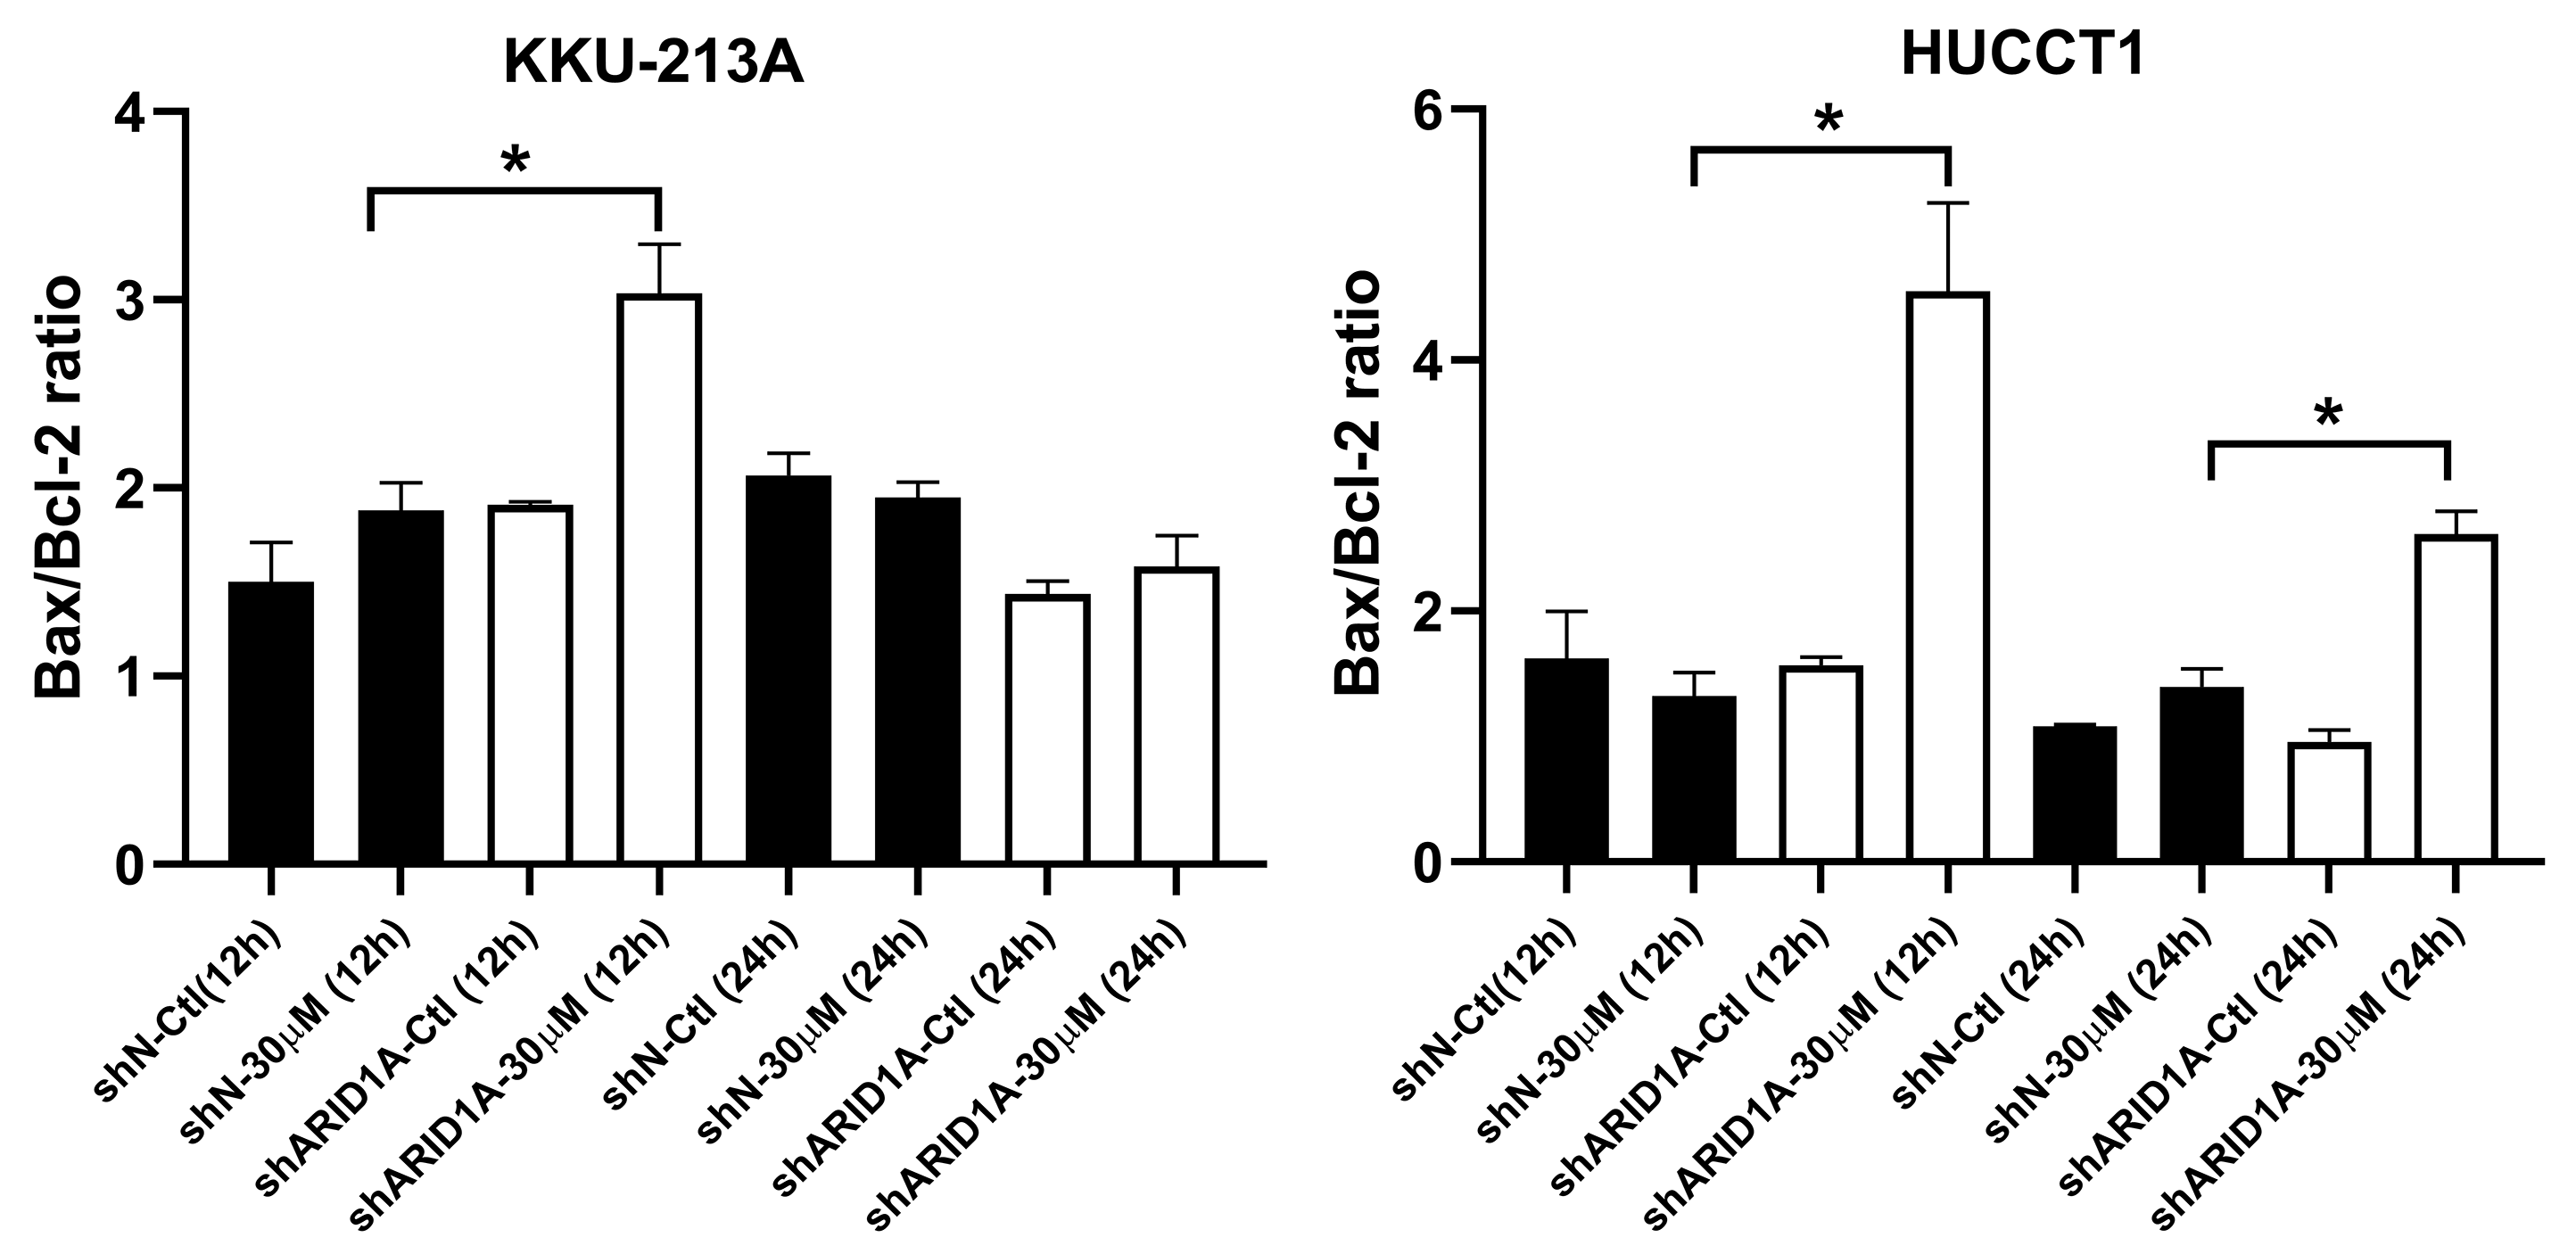
We subsequently investigated whether inhibition of AKT leads to increased apoptosis in ARID1A-knockdown cells. Treatment with MK-2206 at designated concentrations induced apoptosis in ARID1A-knockdown KKU-213A cell lines (Figs. 7A–7B). Flow cytometry confirmed that MK-2206 (30 µM) significantly induced apoptosis in ARID1A-knockdown KKU-213A cell lines compared to the control (68.2% versus 44.9%, respectively, p = 0.004). Even though, ARID1A-silencing in CCA cell lines minimally increased phosphorylation of AKT at Ser-473 (pAKTS473), treatment with MK-2206 (30 µM) significantly reduced pAKTS473 level in ARID1A-knockdown KKU-213A and HUCCT-1 cell lines compared to the non-targeting control shRNA (Figs. 8A–8C). Notably, pAKTS473 levels were significantly reduced in ARID1A-knockdown KKU-213A and HUCCT1 cell lines after the treatment with MK-2206 compared to control shRNA (Fig. 8C). Likewise, treatment with MK-2206 reduced mTOR protein expression in ARID1A-knockdown KKU-213A and HUCCT1 cells compared to the non-targeting control shRNA (Fig. 8D). Consistently, MK-2206 induced apoptosis in ARID1A-knockdown cell lines through the increasing of the Bax/Bcl-2 ratio (Figs. 8A–8B and Fig. S2).
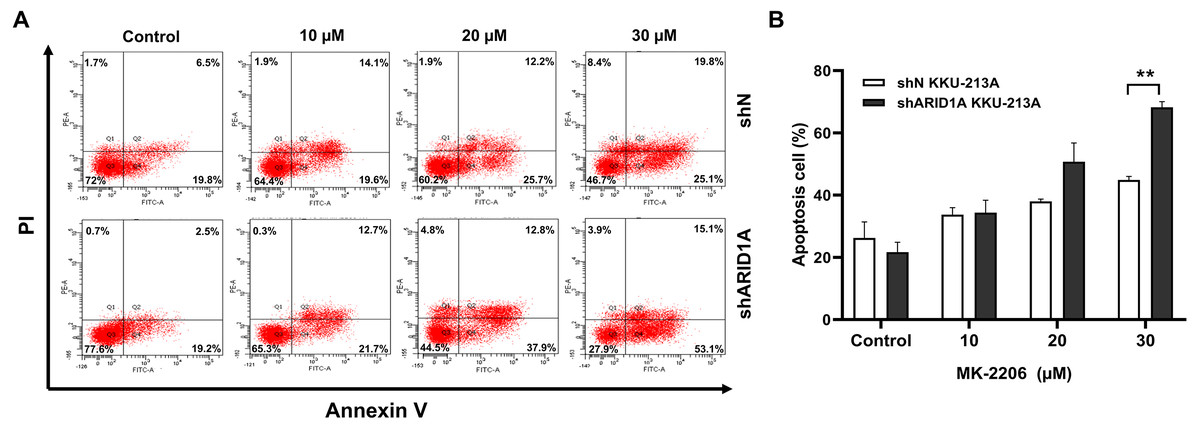
Figure 7: MK-2206 induces apoptosis in ARID1A-knockdown CCA cell lines.
(A) Flow cytometry shows that treatment with MK-2206 (24 h) led to increased apoptosis in ARID1A-knockdown KKU-213A cell lines (shARID1A) as compared with non-targeted shRNA control cells (shN). (B) The number of apoptotic cells was expressed as % of total cell number. **p < 0.01; unpaired t-test.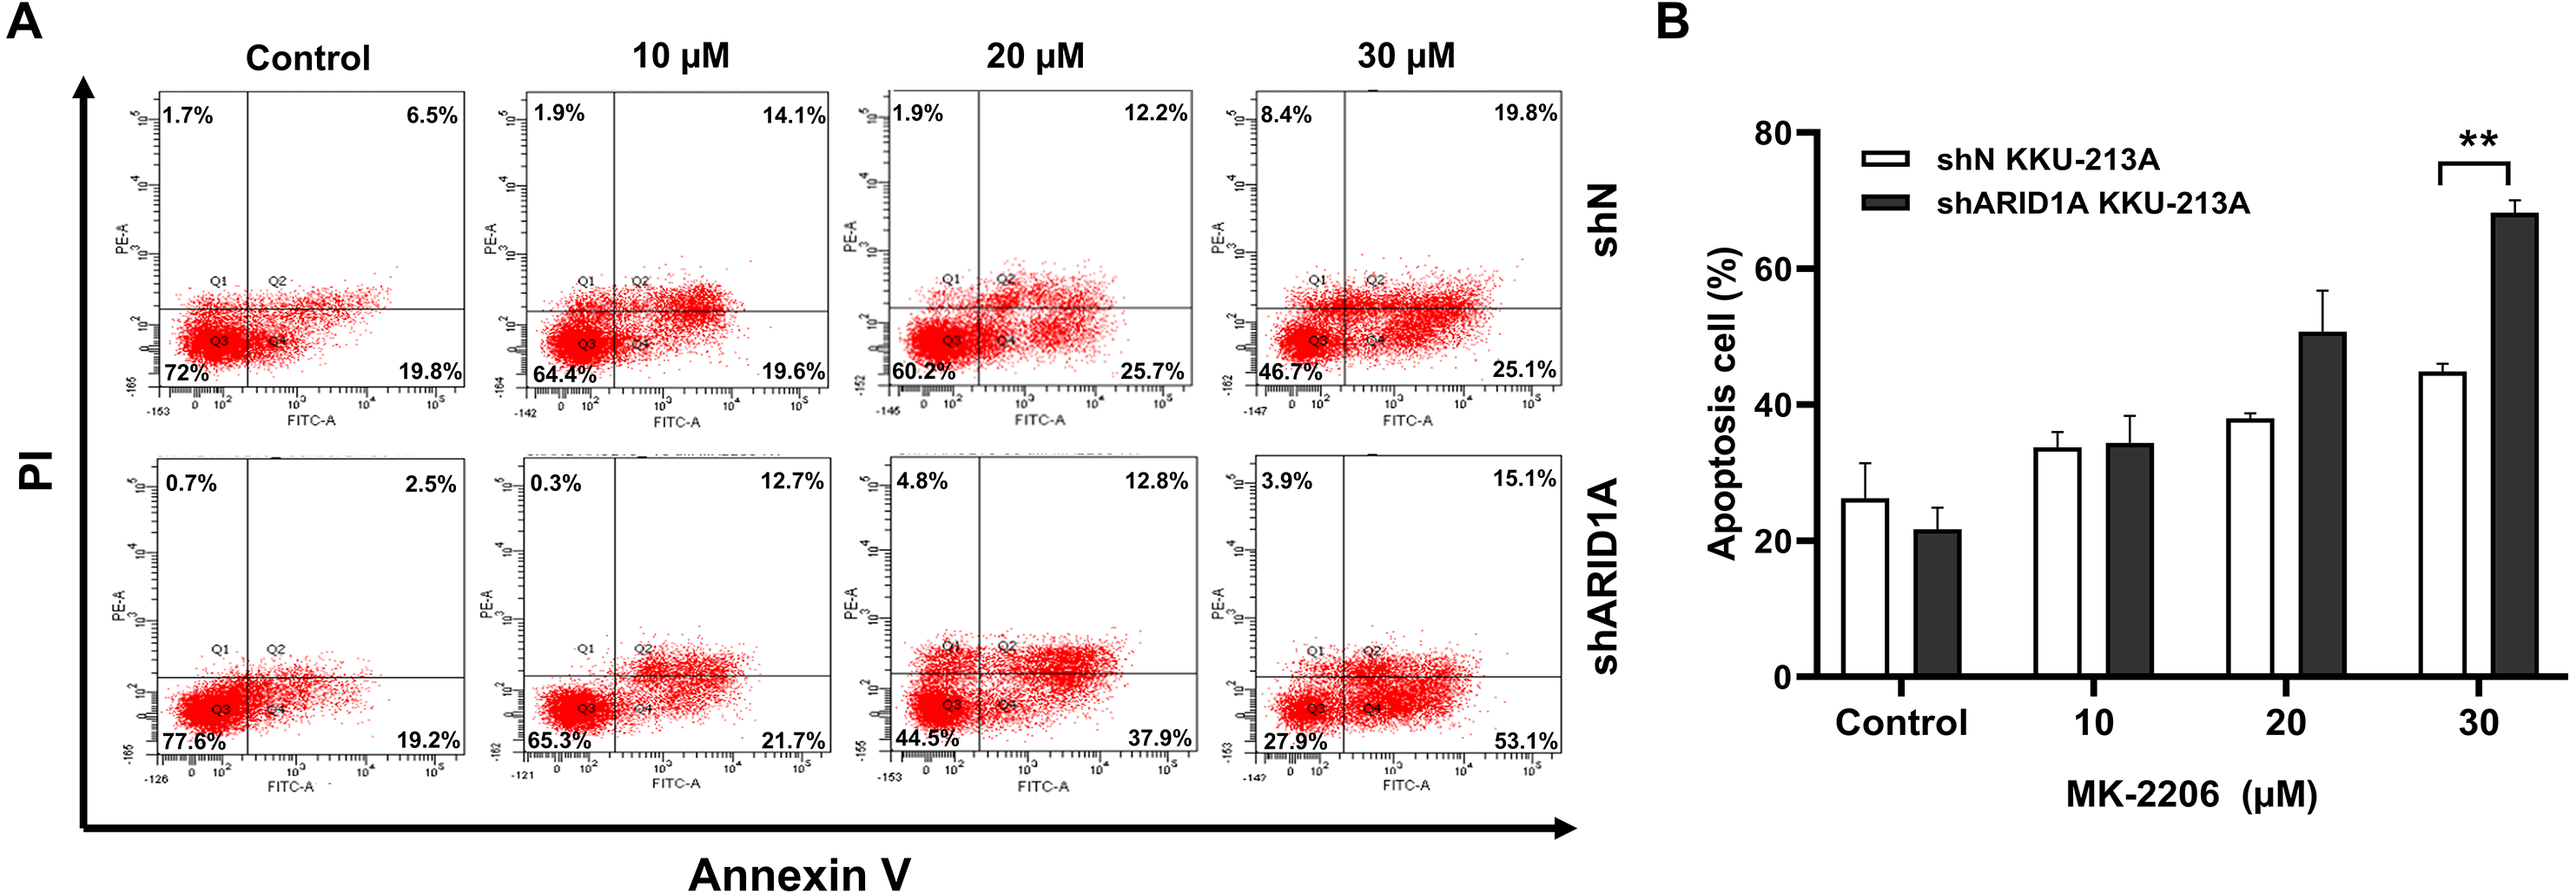
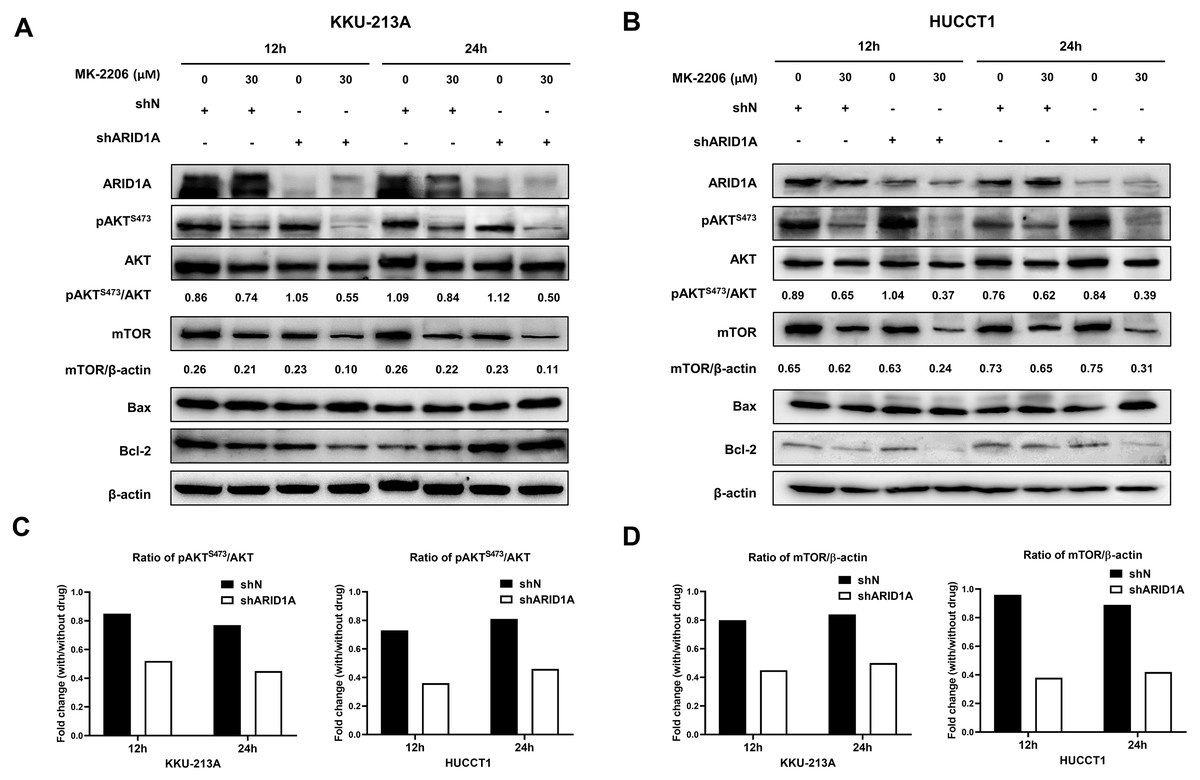
Figure 8: AKT inhibition decreases phosphorylation of AKT, mTOR and induces apoptosis in ARID1A-knockdown CCA cell lines.
(A–B) Treatment with 30 µM MK-2206 led to decrease pAKTS473, mTOR expression and increase Bax/Bcl-2 ratio in ARID1A-knockdown CCA cell lines (A; KKU-213A, B; HUCCT1) compared to non-targeted shRNA control cell (shN). (C) Decreased ratios of pAKTS473/AKT in ARID1A-knockdown CCA cell lines were observed than that of non-targeted shRNA control cells (shN). (D) Decreased ratios of mTOR/β-actin in ARID1A-knockdown CCA cell lines were observed than that of non-targeted shRNA control cells (shN). Densitometric quantification of protein expression in CCA cell lines were obtained using ImageJ (version 1.53a, NIH, USA). Cells were treated with MK-2206 for 12 hours (12 h) or 24 h (24 h) and 0.3% DMSO was used as the control.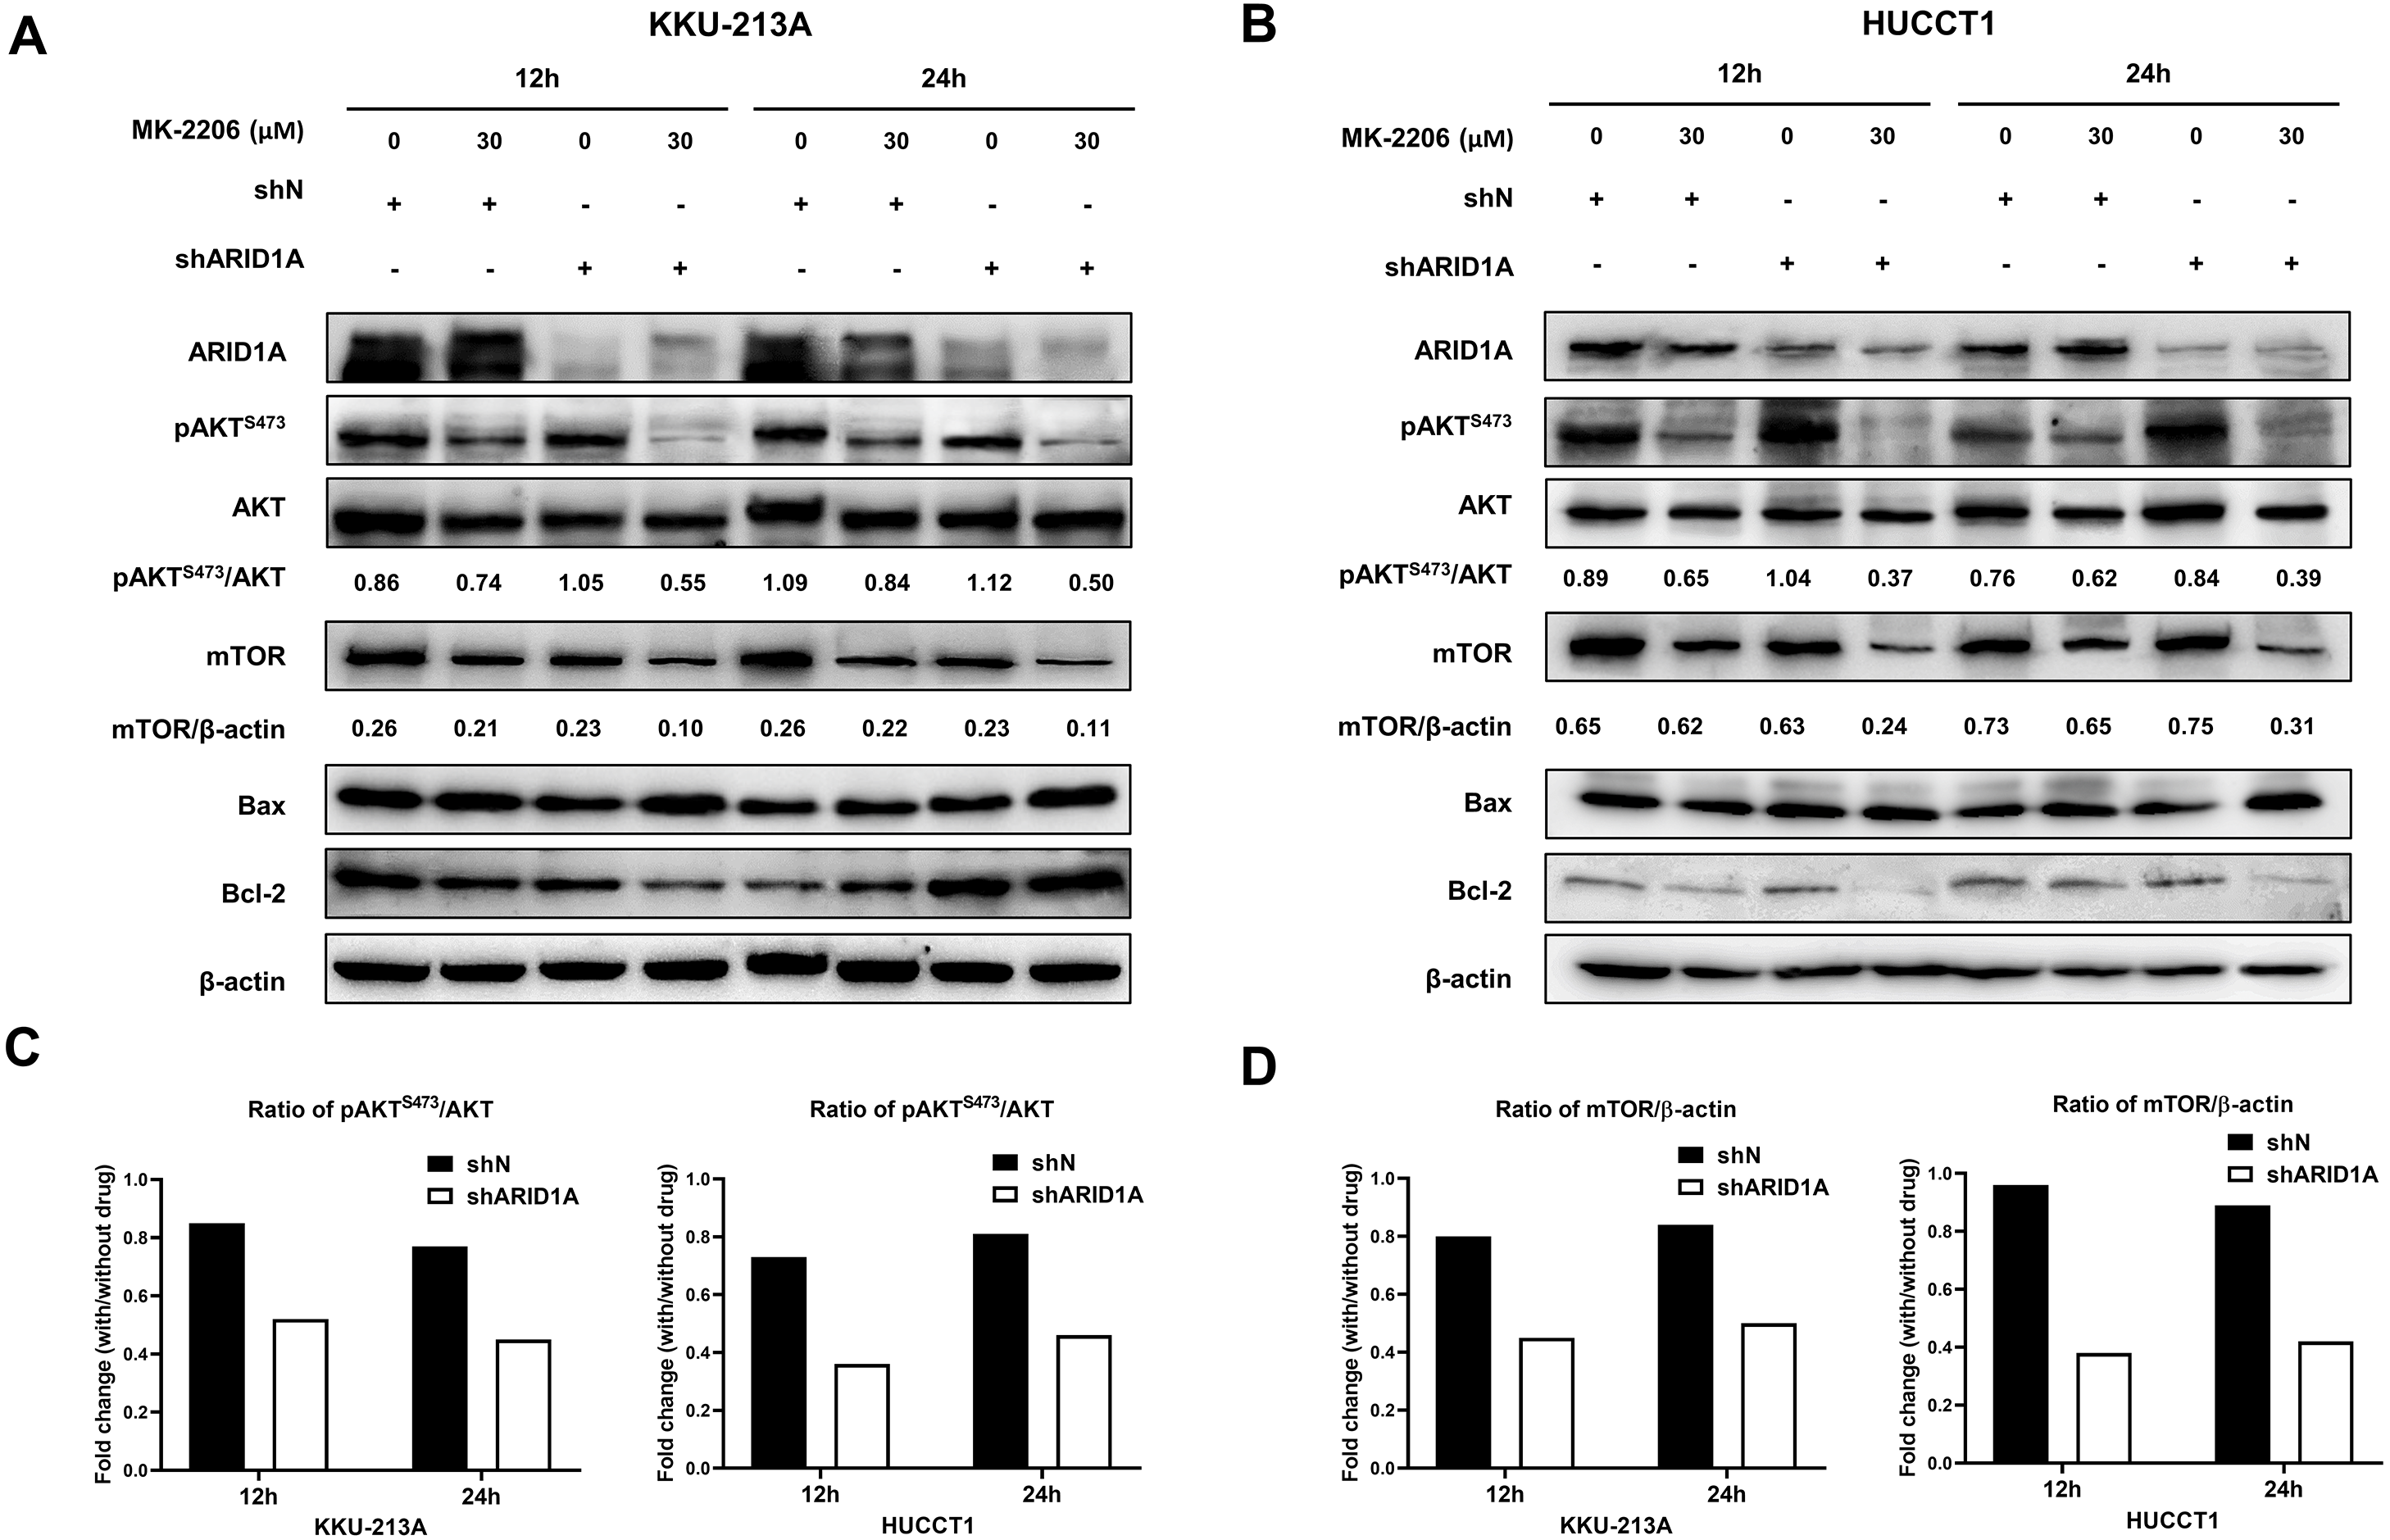
Discussion
CCA is an aggressive malignancy having increased incidence globally with a high mortality rate (Banales et al., 2020). Most CCA patients are diagnosed in the advanced metastatic stage of the disease, resulting in poor survival and poor outcome of the local and systemic therapies (Banales et al., 2020). Recent comprehensive genomic profiling of CCA has revealed potential molecular targets and opened new horizons for tailored treatment for CCA. Among the chromatin remodeling genes, ARID1A shows one of the highest mutation rates across different cancer types in people, and it is one of the most frequently inactivated genes in CCA (Chan-on et al., 2013; Jusakul et al., 2017). Many reports suggest that ARID1A plays a tumor suppressive role in various cancers. These findings have increased interest in developing targeted therapies that take advantage of ARID1A mutations. Interestingly, ARID1A alterations often co-exist with genetic alterations that lead to activation of the PI3K/AKT pathway (Bitler, Fatkhutdinov & Zhang, 2015). There is evidence indicating that ARID1A-mutated cancers may also be vulnerable to therapeutic intervention by targeting the PI3K/AKT pathway (Samartzis et al., 2014). Although, ARID1A inactivation and alterations of the PI3K/AKT pathway frequently occur in CCA, the synthetic lethality by targeting the PI3K/AKT pathway in ARID1A-deficient CCA has not been studied. Herein, we demonstrated ARID1A mutations and its co-occurrence with alterations of the PI3K/AKT pathway in CCA. To the best of our knowledge, this is the first time that a synthetic lethality has been shown between ARID1A deficiency and the inhibition of the PI3K/AKT pathway in vitro of CCA. Furthermore, we found that depletion of ARID1A considerably increased sensitivity toward AKT inhibition in CCA cell lines.
Firstly, we investigated the association between ARID1A mutations and activation of PI3K/AKT pathway. The PI3K/AKT pathway activation could be a result of receptor tyrosine kinases activation or somatic mutations in specific components of the signaling pathway such as PTEN, PIK3CA, and AKT isoforms (Shukla & Mukherjee, 2018). We explored gene alterations of ARID1A and genes in PI3K/AKT pathway in 6 studies using the online resource cBioPortal Web. Our results indicated that ARID1A mutations were associated with somatic mutations of EPHA2, PIK3CA, and LAMA1. EPHA2, a member of the tyrosine kinase family, has been found to be frequently mutated in intrahepatic CCA (ICC). Of note, in vitro and in vivo experiments revealed that EPHA2 mutations led to ligand-independent phosphorylation of Ser897 and were associated with lymph node metastasis of ICC (Sheng et al., 2019). Additionally, ARID1A and EPHA2 mutations were associated with lymph node metastasis of ICC (Sheng et al., 2019). In the present study, we found 82% (18/22) of EPHA2 mutant tumors co-occurred with ARID1A truncating mutations, suggesting an interdependency of ARID1A and EPHA2 pathways. Interestingly, patients with ARID1A-EPHA2 mutations were found to have a shorter overall survival than patients without ARID1A mutations. Additionally, we also found coexistent of ARID1A-PIK3CA mutations in this cohort. Coexistent ARID1A-PIK3CA mutations promotes tumorigenesis has been shown in several types of cancer (Chandler et al., 2015; Takeda et al., 2016; Wilson et al., 2019). PIK3CA mutations lead to dysregulation of the PI3K/AKT pathway (Arcaro & Guerreiro, 2007). Moreover, the H1047R/L PIK3CA mutations exhibited increased kinase activation and resulted in increased sensitivity to the ATP-competitive inhibitor (Mankoo, Sukumar & Karchin, 2009). Combination of inactivation of ARID1A with activation of PIK3CA activates the development of ovarian endometrioid carcinoma (Wilson et al., 2019). In ovarian clear-cell carcinomas, 40% of tumors harbor PIK3CA somatic mutations and the majority of these were ARID1A-deficient tumors (Yamamoto et al., 2012). Here, we found 30% (10/33) of CCA with PIK3CA driver missense (E545K, H1047L, R88Q, R108H, M1043I, and K111E) mutations harbored ARID1A-truncated mutations. This evidence suggests a synergistic mode of ARID1A mutations and PIK3CA activation, which resulted in the activation of the PI3K/AKT pathway. Importantly, our results have shown for the first time the association between mutations in ARID1A and LAMA1. LAMA1 is a subunit of laminins family. Laminins are the main component of the basement membrane, and they can promote tumor growth and metastasis (Patarroyo, Tryggvason & Virtanen, 2002; Engbring & Kleinman, 2003). In clear cell renal cell carcinoma, LAMA1 is one of the markers associated with early metastatic cancer (Yang et al., 2017). We have shown that 60% (6/10) of LAMA1-mutated CCA co-occurred with truncating mutations of ARID1A. Hence, tumors with ARID1A deficiency may depend more on the activation of the PI3K/AKT pathway.
Currently, molecular therapies targeting the PI3K/AKT signaling pathway are under investigation in a clinical trial for several malignancies (NCT01307631 and NCT01277757). The effectiveness of AKT inhibitor (MK-2206) in inducing apoptosis was reported as a monotherapy in CCA cell lines in vitro (Wilson et al., 2015). A phase II clinical trial also evaluated the efficacy of MK-2206 on biliary tract cancers (NCT01425879). However, the clinical efficacy has been limited, to date, possibly because of the lack of appropriate patient selection based on a reliable biomarker(s). Interestingly, ARID1A-deficient cancers are more sensitive to PI3K/AKT inhibitors (Samartzis et al., 2014; Takeda et al., 2016; Zhang et al., 2016; Lee et al., 2017). Here, we demonstrated that ARID1A-deficient CCA cells show increased sensitivity to treatment with AKT inhibitor in vitro. Samartzis et al. (2014) have indicated that ARID1A-deficient breast carcinoma cell lines and human primary lung fibroblasts increased sensitivity to AKT-inhibitors MK-2206, perifosine and PI3K-inhibitor buparlisib (Samartzis et al., 2014). Moreover, Yang et al. (2018a) and Yang et al. (2018b) showed that PI3K/AKT inhibitors (LY294002 and MK-2206) could alleviate radioresistance through the induction of apoptosis and weakening DNA damage repair in ARID1A mutant pancreatic cancer cells (Yang et al., 2018a). Lee et al. (2017) showed that ARID1A- deficient gastric cell lines were more vulnerable to AKT inhibitor GSK690693 (Lee et al., 2017). Likewise, we have shown that MK-2206 targeted pAKTS473 downregulated CCA cell proliferation and induced apoptosis, conferred by ARID1A depletion. This suggests a synthetic lethal interaction between loss of ARID1A and inhibition of the PI3K/AKT pathway. In contrast to ovarian clear cell and endometrioid carcinomas (Samartzis et al., 2014), the effect of ARID1A knockdown on AKT inhibition was relatively small in CCA in vitro which could be a result of weak activation of AKT after ARID1A knockdown. Additionally, the IC50 values reported in this study were higher than those other in vitro models (Samartzis et al., 2014; Lee et al., 2017; Ewald et al., 2013; Wilson et al., 2015). A previous study demonstrated that the antiproliferative and AKT inhibition effects of MK-2206 were varied among cell lines with different genetic background (Hirai et al., 2010), suggesting that other mechanisms responsible for the synthetic lethality of ARID1A inactivation and AKT inhibition remain to be elucidated.
There were some limitations in our study. Although our data provide in silico information regarding the association between ARID1A mutations and PI3K/AKT pathway, its exact mechanism and function in human cancer cells has yet to be fully elucidated. We also acknowledge that a limitation of our study is the lack of in vivo experiments. Future work should investigate MK-2206 properties in vivo and center on developing more effective combination therapies to improve treatment efficacy. Further assessment of the mechanism of action could shed light on the clinical utility of using AKT inhibitors to treat CCA patients harboring ARID1A alterations.
Conclusions
Our results have demonstrated that depletion of ARID1A leads to a significantly increased sensitivity towards AKT-inhibition in CCA cells in vitro. Additionally, our results have shown the co-occurrence of genetic alterations of ARID1A with the PI3K/AKT pathway in CCA tumors. The findings suggest a synthetic lethal interaction between the loss of ARID1A and the inhibition of the PI3K/AKT pathway. Furthermore, results from our study provide a sound basis and a unique opportunity for predicting favorable treatment responses to small molecule inhibitors of the PI3K/AKT pathway on ARID1A-mutated CCA which can improve treatment outcomes.
Supplemental Information
Genetic alterations of ARID1A and genes in PI3K/AKT pathway in 795 CCA patients
The Oncoplot was generated on cBioPortal (https://www.cbioportal.org).
AKT inhibition induces apoptosis in ARID1A-knockdown CCA cell lines
Relative Bax/Bcl-2 levels were increased in ARID1A-knockdown CCA cell lines compared to non-targeted shRNA control cells (shN). Densitometric quantification of the relative Bax/Bcl-2 expression in CCA cell lines were obtained using ImageJ (version 1.53a, NIH, USA). Cells were treated with MK-2206 for 12 h (12 h) or 24 h (24 h) and 0.3% DMSO was used as the control (Ctl). KKU-213A, ∗p = 0.032 and HUCCT1, ∗p = 0.025 and 0.018 respectively, unpaired t-test.