
Genome-wide identification and analysis of the YABBY gene family in Moso Bamboo (Phyllostachys edulis (Carrière) J. Houz)
- Published
- Accepted
- Received
- Academic Editor
- Vladimir Uversky
- Subject Areas
- Bioinformatics, Genomics, Plant Science
- Keywords
- Genome-wide analysis, Expression analysis, Phyllostachys edulis, Gene family, Phylogenetic analysis
- Copyright
- © 2021 Ma et al.
- Licence
- This is an open access article distributed under the terms of the Creative Commons Attribution License, which permits unrestricted use, distribution, reproduction and adaptation in any medium and for any purpose provided that it is properly attributed. For attribution, the original author(s), title, publication source (PeerJ) and either DOI or URL of the article must be cited.
- Cite this article
- 2021. Genome-wide identification and analysis of the YABBY gene family in Moso Bamboo (Phyllostachys edulis (Carrière) J. Houz) PeerJ 9:e11780 https://doi.org/10.7717/peerj.11780
Abstract
Background
The YABBY gene family is a family of small zinc finger transcription factors associated with plant morphogenesis, growth, and development. In particular, it is closely related to the development of polarity in the lateral organs of plants. Despite being studied extensively in many plant species, there is little information on genome-wide characterization of this gene family in Moso bamboo.
Methods
In the present study, we identified 16 PeYABBY genes, which were unequally distributed on 11 chromosomes, through genome-wide analysis of high-quality genome sequences of M oso bamboo by bioinformatics tools and biotechnological tools. Gene expression under hormone stress conditions was verified by quantitative real-time PCR (qRT-PCR) experiments.
Results
Based on peptide sequences and similarity of exon-intron structures, we classified the PeYABBY genes into four subfamilies. Analysis of putative cis-acting elements in promoters of these genes revealed that PeYABBYs contained a large number of hormone-responsive and stress-responsive elements. Expression analysis showed that they were expressed at a high level in Moso bamboo panicles, rhizomes, and leaves. Expression patterns of putative PeYABBY genes in different organs and hormone-treated were analyzed using RNA-seq data, results showed that some PeYABBY genes were responsive to gibberellin (GA) and abscisic acid (ABA), indicating that they may play an important role in plant hormone responses. Gene Ontology (GO) analyses of YABBY proteins indicated that they may be involved in many developmental processes, particularly high level of enrichment seen in plant leaf development. In summary, our results provide a comprehensive genome-wide study of the YABBY gene family in bamboos, which could be useful for further detailed studies of the function and evolution of the YABBY genes, and to provide a fundamental basis for the study of YABBY in Gramineae for resistance to stress and hormonal stress.
Introduction
YABBY genes are zinc finger transcription factors found throughout the plant kingdom, which include a C2–C2 zinc finger structure at the N terminus and a YABBY structure (helix-loop-helix) at the C terminus (Bowman & Eshed, 2000; Kanaya, Nakajima & Okada, 2002), which is similar to the first two helix sequences of high-mobility group box (HMG-box), a specific juxtaposition of structural domains not found in other eukaryotes (Siegfried et al., 1999; Golz et al., 2004; Sieber et al., 2004; Boter et al., 2015). These two structural domains have been shown to be implicated in the specific binding of DNA (Golz et al., 2004). The YABBY protein physically interacts with STYLOSA (STY) in Antirrhinum majus and with LEUNIG (LUG) and LEUNIG_HOMOLOG (LUH) in Arabidopsis (Navarro et al., 2004; Stahle et al., 2009). The YABBY protein of Arabidopsis also physically interacts with SEUSS (SEU), which is a modulator of synergy with LUG (Stahle et al., 2009). These findings suggest that YABBY proteins are involved in the synthesis of the deterrent complex along with LUG/STY and SEU. According to their biochemical properties, LUG/LUH, STY or SEU mutations enhance the phenotypes caused by functional loss mutations of the YABBY genes in A. majus and Arabidopsis (Navarro et al., 2004; Stahle et al., 2009).
A study of the YABBY gene family Arabidopsis thaliana revealed that several members play key roles in the establishment of dorsoventral polarity, as well as lateral organ growth, development, and morphogenesis. Additionally, this family has also been implicated in both biotic and abiotic stress response (Yamada et al., 2011; Eckardt, 2010). During the establishment of the dorsoventral axis of plant lateral organs, this family of genes mainly determines the fate of distal terminal cells and influences the development of plant lateral organs (Finet et al., 2016; Bowman, 2000). Furthermore, the YABBY genes are associated with the laminar growth, as well as suppression of shoot apical meristem (SAM) pattern genes (Sarojam et al., 2010). YABBY is a type of transcription factors that is specifically found in seed plants (Kayani et al., 2019). The YABBY gene family is relatively small and has independent origins in the seed plant genealogy (Floyd & Bowman, 2007; Liu et al., 2007). According to phylogenetic analysis, five members of YABBY gene family represented by INO (INNER NO OUTER), CRC (CRABS CLAW), YABBY2, YABBY3/FIL (FILAMENTOUS FLOWER), and YABBY5, have been found in angiosperms (Lee et al., 2005; Toriba et al., 2007; Yamada, Ito & Kato, 2004; Liu et al., 2007). In dicotyledons, the Arabidopsis YABBY family of genes contains six closely related transcripts: CRC, FIL, YAB2 (YABBY2), YAB3 (YABBY3), INO/YABBY4, and YAB5 (YABBY5) (Bowman, 2000; Nahar et al., 2012). Four of these (FIL, YAB2, YAB3, and YAB5) have high expression in vegetative tissues, while FIL, YAB2, and YAB3 genes are specifically expressed at the apical end of above-ground tissues.YAB3 plays a key role in regulating abaxial conformation, growth of lateral organs and inflorescence phyllotaxy (Hou, Lin & Hou, 2020). FIL is involved in flower and leaf development and is functionally redundant with the YAB3 gene (Stahle et al., 2009). In contrast, CRC and INO are expressed only in floral organs, with the former involved in the development of nectaries and the apical end of the carpel, and the latter regulating the development of the external end of the ovule (Eckardt, 2010; Ha, Jun & Fletcher, 2010; Zhang et al., 2013; Shamimuzzaman & Vodkin, 2013).
Thus far, eight YABBY family genes have been found in rice (Toriba et al., 2007; Yamaguchi et al., 2004; Navarro et al., 2004). Sequence analysis revealed the rice DL (DROOPING LEAF) gene is a homolog of the Arabidopsis CRC, which regulates the formation of flowers and leaf veins by promoting cell proliferation in the central region of rice leaves (Yamaguchi et al., 2004; Toriba et al., 2007). OsDL genes are not expressed polarized in the carpels and leaf primordia, whereas CRC is expressed in the distal end of the nectaries and carpels. CRC genes are mainly involved in regulating the development of Arabidopsis carpels and nectaries (Bowman & Smyth, 1999).
OsYABBY5 (TONGARI-BOUSHI1, TOB1) regulates lateral organogenesis and differentiation of meristematic tissues in rice spikelets (Tanaka et al., 2012). Overexpression of OsYABBY1 has been shown to result in a semi-dwarf phenotype that can be recovered by the exogenous application of gibberellin (GA) (Dai et al., 2007b) . Rice OsYAB3 is involved in leaf development but does not affect polarity establishment, and the leaves of plants expressing RNAi targeting this gene exhibit twisted, multinodular, and missing ligule auricles (Lin et al., 2012). OsYAB4 is mainly expressed in the vascular tissues of rice and may be involved in the regulation of vascular tissue development and leaf polarity establishment (Dai et al., 2007a; Liu et al., 2007).
To date, the function of the YABBY gene family has been studied in a variety of plants, for example, gene members of the YABBY family were identified in tomato (Solanum lycopersicum L.) (Huang et al., 2013; Han et al., 2015); YABBY family genes also have been identified in grapes (Vitis pseudoreticulata) (Xiang et al., 2013; Zhang et al., 2019), pak-choi (Brassica rapa ssp. chinensis) (Hou et al., 2019), Bienertia sinuspersici (Soundararajan et al., 2019), cotton (Gossypium arboreum) (Yang et al., 2018), maize (Zea mays L.) (Juarez, Twigg & Timmermans, 2004; Strable & Vollbrecht, 2019), berberidaceae (Epimedium sagittatum) (Sun et al., 2013), lily (Lilium longiflorum) (Wang et al., 2009), Chinese cabbage (Brassica campestris L. ssp. pekinensis (Lour.) Olsson) (Zhang et al., 2013), Pisum sativum (Fourquin et al., 2014), rapeseed (Brassica campestris L. ssp chinensis var. Parachinensis) (Zhang & Zhang, 2014), spearmint (Mentha spicata) (Wang et al., 2016) and wheat (Triticum aestivum L.) (Zhao et al., 2006). There is increasing evidence that YABBY has similar functions in nutrient storage organs in both dicots and monocots (Golz et al., 2004; Juarez, Twigg & Timmermans, 2004). For example, petunia PhCRC1/2 expression is similar to Arabidopsis CRC expression in developing nectaries and carpels (Li et al., 2018; Morel et al., 2018; Lee et al., 2005).
Moso bamboo (Phyllostachys edulis) belongs to the genus Phyllostachys of Bambusoideae in Gramineae (Zhang et al., 2018), and is the most versatile and largest economic bamboo species (Ramakrishnan et al., 2020). Because of its rapid growth and development and high economic production value, it is the most widely distributed and cultivated bamboo species in China. Due to its multiple uses of bamboo shoots and timber, it has high comprehensive incomes (Peng et al., 2013a). At the same time, moso bamboo forests also have ecological values of water conservation, fertilization, soil improvement, air purification and climate regulation. Moso bamboo is an excellent model plant due to its rapid growth rate during culm development (Tao et al., 2020; Zhao et al., 2018a). A better understanding of Moso bamboo’s genome and transcriptome has the potential to yield new genetic resources for the improvement of other crop species (Peng et al., 2013b; Pan et al., 2017; Liu et al., 2019).
Despite the sequencing of the Moso bamboo genome several years ago, few YABBY genes have been reported in this species (Zhao et al., 2018b). The recognition and functional characterization of the YABBY family in Moso bamboo will help to elucidate the regulatory mechanisms. Here, we identified 16 PeYABBY genes that contained the YABBY conserved domain and investigated their amplification patterns, tertiary structures, protein interactions and GO enrichment analysis. Additionally, we analyzed the expression characteristics of the PeYABBY genes in different tissues and in response to hormonal stress. These results may provide a basis for studying the tissue specificity of PeYABBY genes.
Materials & Methods
Identification of YABBY gene family members in P. edulis
The complete P. edulis genome files was downloaded from GigaDB (Wang et al. 2021; Zhao et al., 2018b) (http://gigadb.org/dataset/100498) while additional sequences of YABBY were obtained from the Pseudomolecule Download Site webpage in the RGAP 7 database (Rice Genome Annotation Project, http://rice.plantbiology.msu.edu/) and The Arabidopsis Information Resource, version 10 (TAIR 10) (https://www.arabidopsis.org/). BLAST analysis of YABBY proteins using Hidden Markov Models (HMMs) against the protein database. In combination with the pfam database (PF04690), rigorous criterion (E-values had a cutoff of 10-5) was used to ensure the reliability of the amino acid sequences. In addition to conserved sequences, the demonstration of conserved YABBY domains was the deterministic criterion for inclusion of candidate genes into the YABBY family (Punta et al., 2012). If there were several alternative splice variants for a candidate gene, the longest variant was used to represent the candidate genes. By sorting the results and removing redundancy, the complete nucleotide and common conserved domain sequences of 16 YABBY family members were identified in the Moso bamboo database. The online analysis tools ProtParam, ProtScale, and SignalP 4.1 Server (http://www.cbs.dtu.dk/services/SignalP/) were used to determine the physical and chemical properties of each protein, such as amino acid sequence length, molecular weight (MW), and isoelectric point (pI), as well as its signal peptides.
Phylogenetic analysis
Arabidopsis YABBY protein sequences were downloaded from TAIR 10, while the RGAP 7 database was used to obtain rice YABBY protein sequences. The YABBY protein sequences of A. thaliana, Oryza sativa, and P. edulis were used to construct a phylogenetic tree using the neighbor- joining method after multiple sequence alignment by ClustalW (Khachane, Timmis & dosSantos, 2005). For statistical reliability, the branch lengths were calculated using pair-wise estimates of the genetic distances in a bootstrap analysis of 1,000 replicates.
Gene structure, motifs and conserved domains-sequences analysis
We analyzed the structure of the YABBY family with the gene structure view based on the GFF annotation file. To better characterize the secondary structure of the YABBY proteins, the software MEME (Multiple Expectation Maximization for Motif Elicitation, https://meme-suite.org/meme/) was used to identify conserved motifs (Nakano et al., 2006). The following optimization parameters were used: any number of repeats, the maximum number of patterns was set to 5, and the length of each search was from 6 to 50 amino acid. The icons for the motifs were created using an online website (http://weblogo.berkeley.edu/logo.cgi).
For conserved domain-sequence analysis, the corresponding sequences of YABBY proteins were extracted and analyzed by multi-sequence alignment using Geneious software version 11.1.4 (Liao et al., 2015), and combined with an online website for conserved domains (such as NCBI Conserved Domain Database (CDD), https://www.ncbi.nlm.nih.gov/cdd/ and EMBL-Pfam, https://pfam.xfam.org/) to analyze conserved domains of the Moso bamboo YABBY sequence.
Determination of chromosomal localization and synteny analysis
To determine the physical locations of PeYABBY genes, all genes of bamboo on each chromosome were obtained from the P. edulis genomic database, followed by mapping of the physical location information obtained from the database by using TBtools.
Collinearity analysis was performed using the Basic Local Alignment Search Tool (BLAST) (Lugli et al., 2020) to compare the entire Moso bamboo YABBY protein sequence, with a cutoff of truncated E-value of 1 ×10⁻²⁰. This truncated E-value was also used in the collinearity analysis of P. edulis and rice, as well as P. edulis and A. thaliana. BLASTP results were analyzed using MCScanX software to generate collinearity blocks for the entire genome (Wang et al., 2012). CIRCOS software was used to extract colinear gene pairs from the YABBY protein family and plot the resulting collinearity (Krzywinski et al., 2009). To estimate divergence times, synonymous (Ks) and nonsynonymous (Ka) substitution rates and their corresponding cDNA sequences for the PeYABBY gene pairs in Moso bamboo species were calculated using the Ka/Ks feature of the TBtools software (Chen et al., 2020). The divergence time of the gene pairs was estimated using the synonymous mutation rate of λ substitutions per year per synonymous site, with the following formula: T = Ks/2 λ (λ = 6.5 ×10⁻⁹) (Peng et al., 2013a)
Cis -acting elements in the promoter regions of the PeYABBY genes
For cis-acting regulatory elements analysis in the promoter regions of the YABBY genes, the upstream sequence (1.5 Kb) of each PeYABBY transcription initiation sequence was downloaded from the genome database. These sequences were then submitted to the PlantCARE database (http://bioinformatics.psb.ugent.be/webtools/plantcare/html/) for identifying cis-acting elements and functional categorization, followed by visualization in TBtools (Lescot et al., 2002; Chen et al., 2020).
Expression patterns of transcriptome analysis
Transcriptomics data were obtained from the NCBI SRA database (Accession: ERX082501, ERX082502, ERX082503, ERX082504, ERX082506, ERX082507, ERX082508 and ERX082509, registration numbers ERR105067, ERR105068, ERR105069, ERR105070, ERR105072, ERR105073, ERR105074, and ERR105075) and utilized to calculate the expression level of the YABBY genes at different developmental stages, both roots, panicles, rhizomes, and leaves were also included. TopHat2 (Kim et al., 2013) was used to map paired reads to the respective reference genomes. After mapping, gene transcripts were assembled by Cufflinks (Ghosh & Chan, 2016; Kulahoglu & Brautigam, 2014). Gene expression profiles were calculated as transcripts per million reads (TPM) (Lama et al., 2020) (Table S3). For convenience, transcript expression of each gene was based on logarithm base 2 per million transcripts (log2 TPM), and the Amazing Heatmap module in TBtools was used to draw the gene expression heatmap (Chen et al., 2020).
Plant growth conditions and hormone treatments
Seeds of Moso bamboo were collected from Kunming, Yunnan Province, China. The seedlings were cultivated in an experimental greenhouse with a constant photoperiod (16 h of light/8 h of darkness) and an average temperature of 22 °C for 30 days. And then four tissue samples were obtained, which consisted of roots, stems, young leaves and mature leaves, with three replicates of each sample. Abscisic acid (ABA) hormone treatment was conducted on young leaves by spraying them with a 100 µM ABA solution. After spraying, the leaves were sampled at 0 h, 3 h, 6 h, 12 h, 24 h, and 48 h. Unprocessed samples were taken at 0 h and used as the control group (CK). GA hormone treatment was conducted on young leaves by spraying with a 50 µM GA solution. Leaves were then sampled and operated like ABA treatment. All samples were immediately frozen in liquid nitrogen and then stored at −80 °C prior to RNA isolation.
qRT-PCR analysis of PeYABBY genes
For quantitative real-time PCR (qRT-PCR), RNA was extracted from Moso bamboo samples with a FastPure Plant Total RNA Isolation Kit (Vazyme company, China). First-strand cDNA was generated via a HiScript@ lll 1st Strand cDNA Synthesis Kit (+gDNA wiper), following the manufacturer’s instructions. Gene-specific qRT-PCR primers were designed according to the coding sequence (CDS) of each gene by Primer Premier 5 (See Table S4 for primer sequences). qRT-PCR was performed on a CFX96 real-time system (BioRad, USA) for gene expression analysis with Hieff® qPCR SYBR Green Master Mix (Yeasen company, China) buffer, and three independent replicate experiments were performed (Dong et al., 2017). PCR conditions were as follows: 94 °C for 30 s; followed by 39 amplification cycles of 94 °C for 5 s, 60 °C for 30 s, and 72 °C for 10 s.
The relative expression level of each gene was calculated and normalized through the 2−ΔΔCt method relative to NTB, which was an internal control for normalization. The statistical analysis data were analyzed using SPSS software (SPSS Software, Chicago, IL, USA). The data was subjected to a one-way analysis of variance (ANOVA), and then a Tukey test was performed. Under appropriate circumstances, the non-parametric Student’s t-test was employed for pairwise comparisons of data from individual samples. Values of P ≤ 0.05 were considered significantly different.
Protein interaction network prediction and GO enrichment
Protein-protein interaction (PPI) networks are important for studying protein interactions and functions. To further analyze the YABBY protein interactions and their interaction networks, the online software STRING (https://string-db.org/) was used to construct the relationship networks and the results were visualized using Cytoscape (Paul et al., 2003). Additionally, to better understand the biological pathways that the 16 PeYABBY genes were involved in, Gene Ontology (GO) enrichment analysis and visualization were performed using Gene Ontology Enrichment Analysis software (Thomson et al., 2019).
Homology modeling
Homology modeling techniques are widely used in protein models. To determine the tertiary structure of YABBY protein, we used the fully automated protein structure homology modeling server Phyre2 database (http://www.sbg.bio.ic.ac.uk/phyre2) (Hüttner et al., 2019) for homology modeling, using similar protein structures as homology templates and visualizing them with Discovery Studio, version 2016 (BIOVIA) software.
Results
Identification of PeYABBY genes in P. edulis
After two rounds of genome retrieval of P. edulis, resulting in the identification of 16 YABBY family proteins through HMMER and the Pfam database (Accession no. PF04690), and the conservative YABBY domain was analyzed by NCBI CDD. Based on their genome location of P. edulis, each PeYABBY gene was assigned a unique name (PeYABBY01-PeYABBY16) (Table 1). The amino acid residue sequence, pI, MW and GRAVY of YABBY proteins were listed in Table 1. The predicted length of protein products varied, PeYABBY02 had the smallest protein sequence, with 85 amino acids (aa), while PeYABBY04 had the largest sequence (297 aa). The MW of proteins were predicted, and there were significant variations in MWs, PeYABBY02 had a MW of 9.46 KDa and PeYABBY04 was 31.06 KDa, and the pIs ranged from 5.55 and 9.85. Analysis of the grand average of hydropathicity (GRAVY) results indicated that the majority of the YABBY members revealed hydrophilicity, with the index <0. Only one protein (PeYABBY02) showing hydrophobic properties (GRAVY >0). All proteins discussed in this section were predicted to not contain signal peptides. The predicted analysis of the secondary structure of the protein sequences revealed that the largest proportion of each protein sequence was random coils, followed by alpha helices (Table S1).
| Id | New name | Number of amino acids (aa) | Molecular weight (KDa) | Theoretical pI | Aliphatic index | Grand average of hydropathicity (GRAVY) | Signal peptide |
|---|---|---|---|---|---|---|---|
| PH02Gene42615.t2 | PeYABBY01 | 260 | 28.16 | 9.32 | 82.27 | −0.23 | no |
| PH02Gene08310.t1 | PeYABBY03 | 170 | 18.78 | 9.10 | 57.94 | −0.59 | no |
| PH02Gene41238.t1 | PeYABBY02 | 85 | 9.46 | 9.55 | 104.24 | 0.63 | no |
| PH02Gene30423.t1 | PeYABBY04 | 297 | 31.06 | 9.03 | 75.76 | −0.23 | no |
| PH02Gene17872.t1 | PeYABBY05 | 101 | 10.61 | 5.55 | 80.99 | −0.13 | no |
| PH02Gene42853.t1 | PeYABBY06 | 122 | 13.85 | 9.85 | 54.34 | −0.87 | no |
| PH02Gene18063.t1 | PeYABBY07 | 193 | 21.55 | 9.32 | 68.24 | −0.55 | no |
| PH02Gene21516.t2 | PeYABBY08 | 197 | 21.70 | 8.78 | 68.38 | −0.49 | no |
| PH02Gene35716.t2 | PeYABBY09 | 291 | 30.78 | 9.58 | 80.93 | −0.18 | no |
| PH02Gene11723.t1 | PeYABBY11 | 193 | 21.66 | 8.71 | 56.06 | −0.66 | no |
| PH02Gene30480.t1 | PeYABBY10 | 188 | 21.22 | 8.84 | 72.13 | −0.41 | no |
| PH02Gene29867.t1 | PeYABBY13 | 191 | 21.36 | 8.98 | 57.64 | −0.61 | no |
| PH02Gene30849.t1 | PeYABBY12 | 188 | 21.21 | 8.61 | 71.6 | −0.50 | no |
| PH02Gene09731.t1 | PeYABBY14 | 252 | 26.86 | 7.06 | 71.47 | −0.20 | no |
| PH02Gene02055.t1 | PeYABBY16 | 258 | 27.31 | 7.62 | 73.99 | −0.17 | no |
| PH02Gene16897.t1 | PeYABBY15 | 255 | 27.07 | 6.78 | 74.43 | −0.19 | no |
Phylogenetic analysis and classification
In order to gain a better understanding of the evolutionary relationships among the YABBY proteins, the full-length protein sequences of A. thaliana, O. sativa and P. edulis were used for multi-sequence alignment and rootless phylogenetic tree analysis with bootstrap values 1000. 30 protein sequences (Table S2) were divided into five classes based on previous studies, including the CRC class, INO class, YAB2 class, YAB5 class, and YAB3 class (Fig. 1). Based on the phylogenetic tree, the YAB2 class could be divided into two subgroups. The YAB3 class had the largest number of members (11), including six Moso bamboo members. Only one member AtYABBY05 was present in the YAB5 class. Within the CRC class, there were two P. edulis, one O. sativa and two A. thaliana YABBY proteins. In the YAB2 class, there was only one Arabidopsis YABBY protein sequence in the YAB2-II subgroup, and the YAB2-I subgroup contained six Moso bamboo protein sequences.
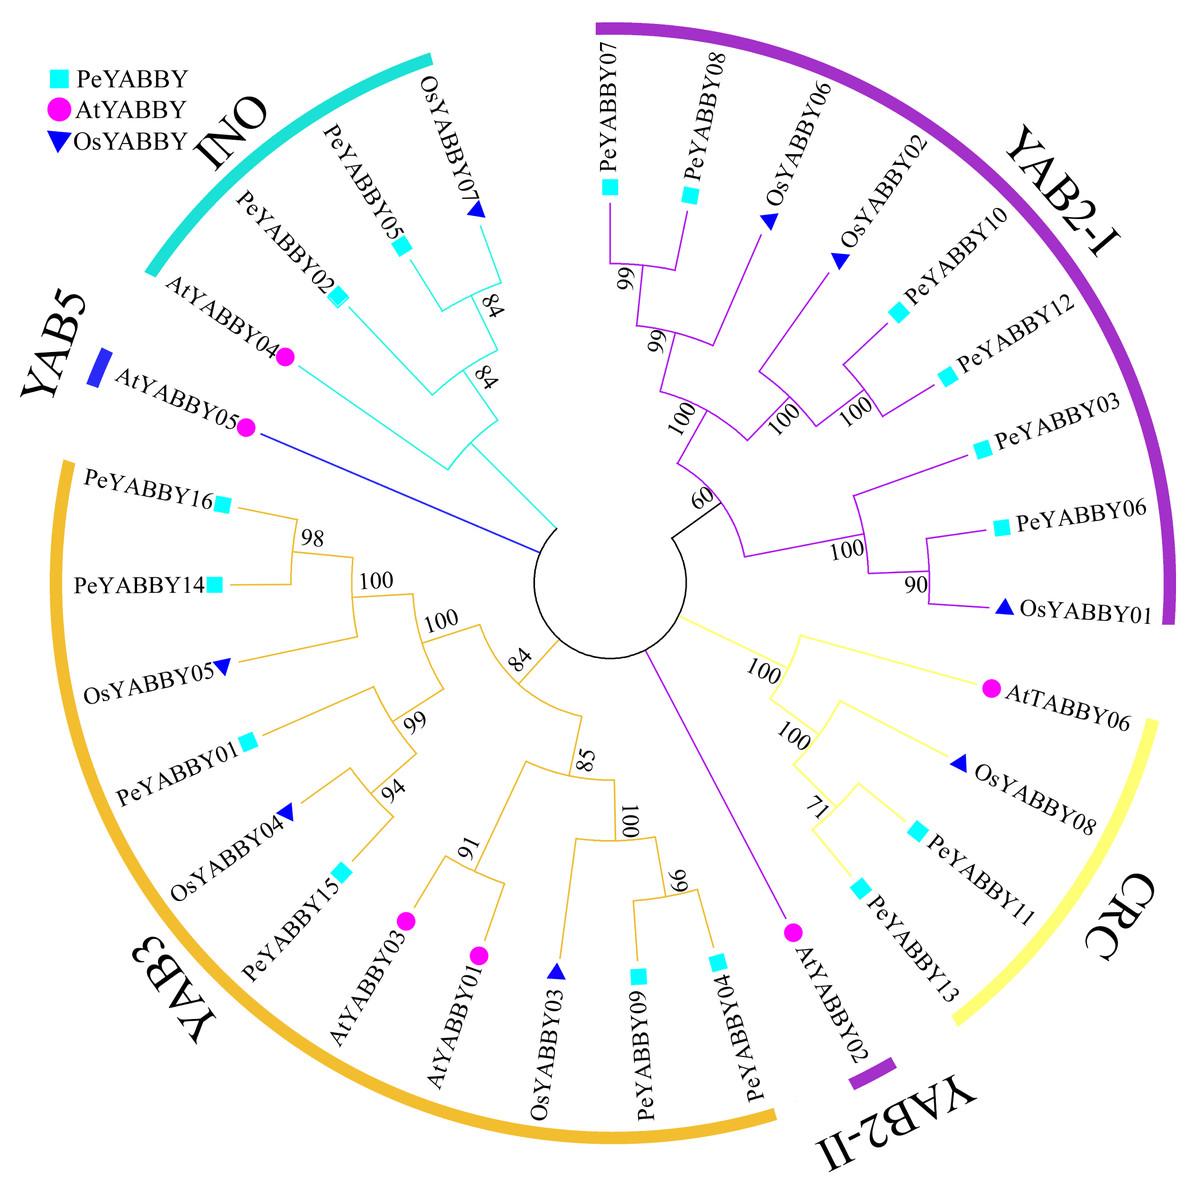
Figure 1: Phylogenetic tree of interspecific YABBY relationships.
In MEGA 7.0, phylogenetic trees without roots were developed using the neighbor-joining (NJ) process. At each node, bootstrap values of 1,000 replicates are indicated. The phylogenetic tree resulted in a tree that was divided into five classes, with AtYABBYs representing the YABBY sequences of Arabidopsis, OsYABBYs representing the YABBY sequences of rice, and PeYABBYs representing the YABBY sequences of bamboo.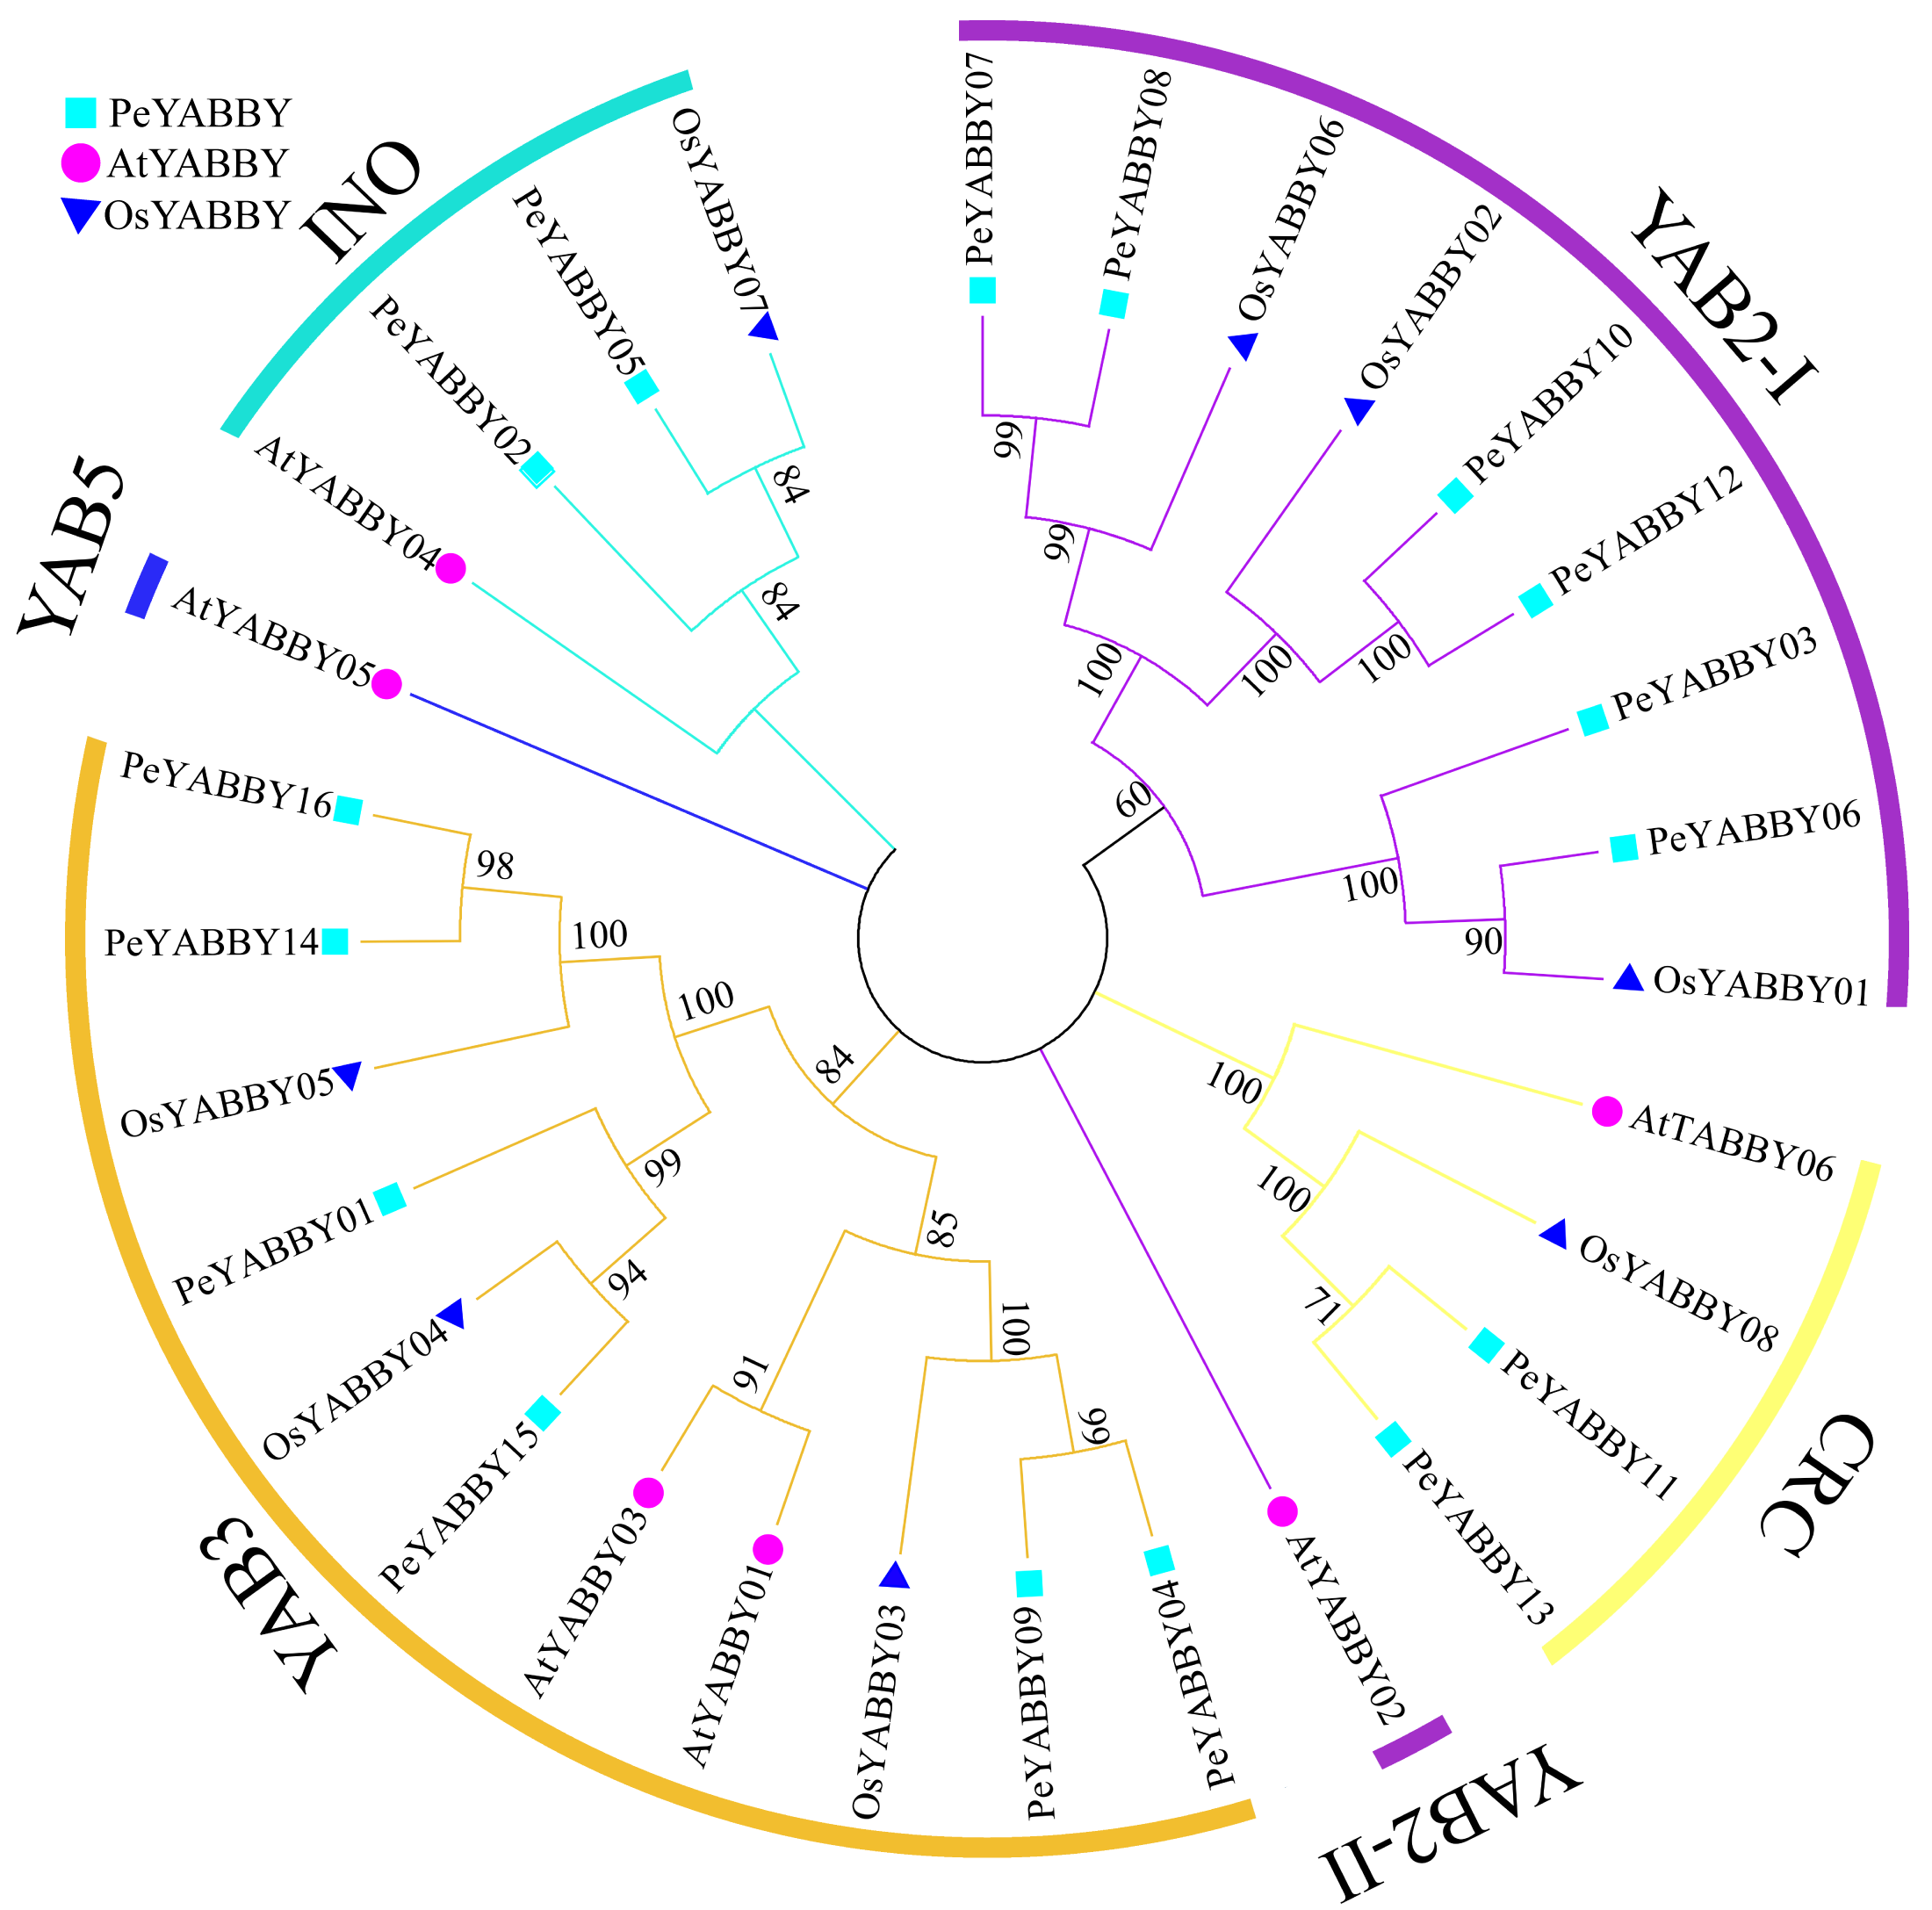
Chromosome localization and collinearity analysis of PeYABBY genes
Chromosome localization and gene duplication allow analysis of the evolutionary history of the YABBY gene family. Among YABBY family members, 16 PeYABBY genes were randomly distributed on 11 chromosome scaffolds based on the whole-genome GFF annotation file of the P. edulis and the location information of the PeYABBY genes. All chromosome scaffolds had at least one YABBY gene, but the overall distribution was uneven. One PeYABBY gene was present on scaffolds 3, 5, 11, 12, 13 and 23, and two PeYABBYs were present on scaffolds 4, 10, 15, 21, and 24.
Intra-specific collinearity analysis was performed to examine YABBY homologous loci relationships and putative gene duplication events. This analysis revealed that many PeYABBY genes appeared to have arisen from gene duplications, including PeYABBY01/PeYABBY14, PeYABBY04/PeYABBY09, PeYABBY07/PeYABBY08, PeYABBY07/PeYABBY12, PeYABBY08/PeYABBY10, PeYABBY08/PeYABBY12, and PeYABBY14/PeYABBY16. In the Moso bamboo gene database, seven homologous PeYABBY gene pairs were found on scaffold3, scaffold5, scaffold11, scaffold12, scaffold13, scaffold15, scaffold21, scaffold23, and scaffold24. These results indicated that duplications were responsible for the diversity of the YABBY genes in P. edulis (Fig. 2).
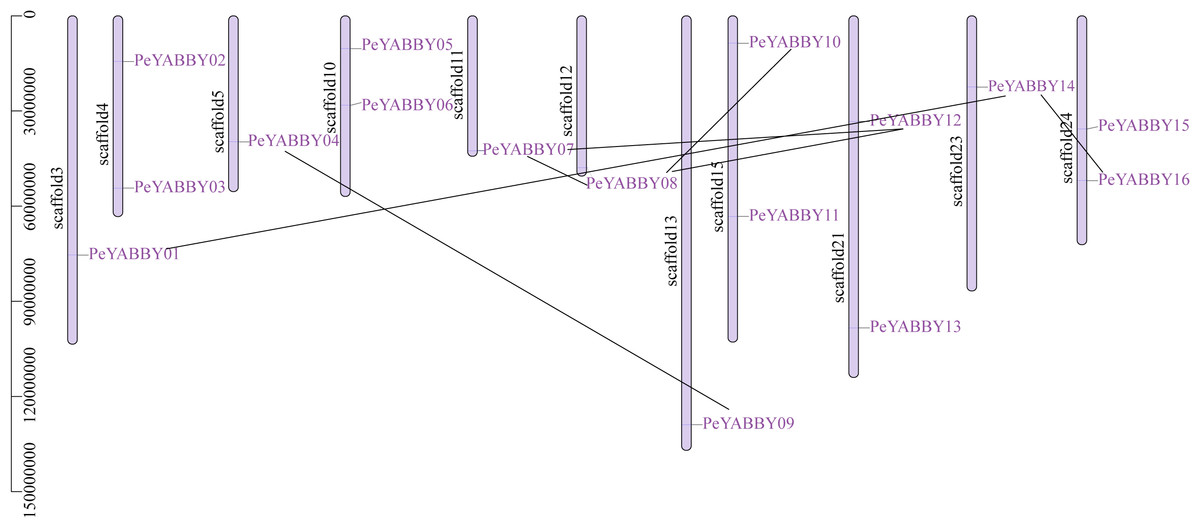
Figure 2: Chromosome location of YABBYgenes in Moso bamboo.
Positions of YABBY gene family members on Moso bamboo chromosomes. PeYABBY genes are numbered 1-16. The chromosome numbers and gene names are marked adjacent to the chromosome scaffolds and the gene pairs from segmental duplications are linked with black lines.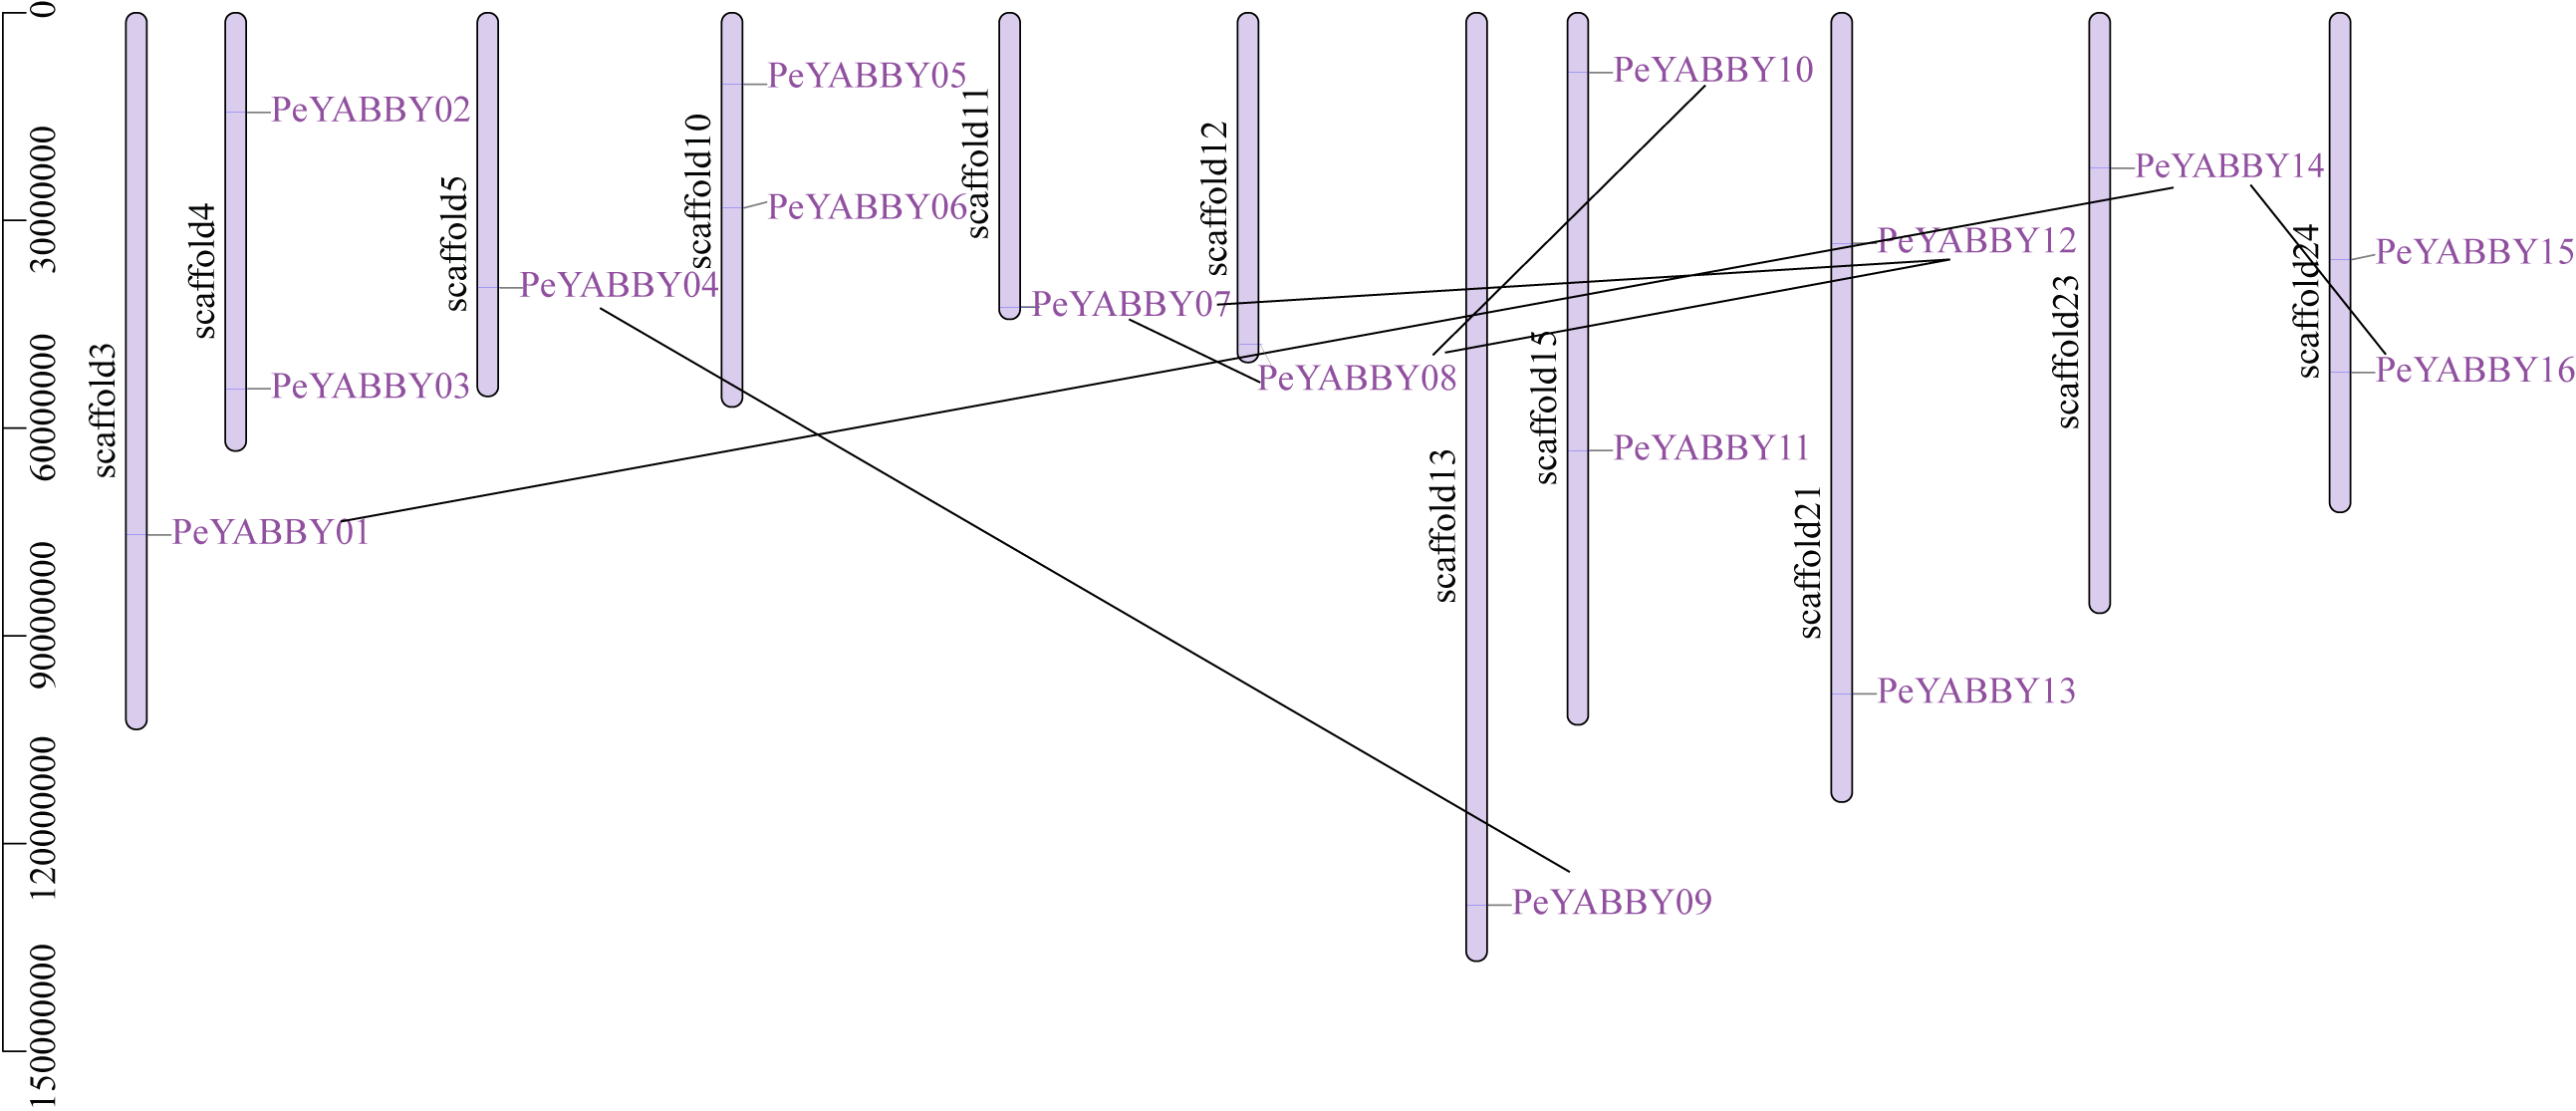
A collinearity analysis was performed in order to determine the gene duplication relationships in Moso bamboo compared to orthologous genes found in other species. This analysis identified several gene duplications in Moso bamboo relative to rice, but there was no collinearity relationship between Moso bamboo and A. thaliana. This gene duplication phenomenon suggested that the Moso bamboo YABBY complement was more closely related to monocotyledons (Figs. 3 and 4).
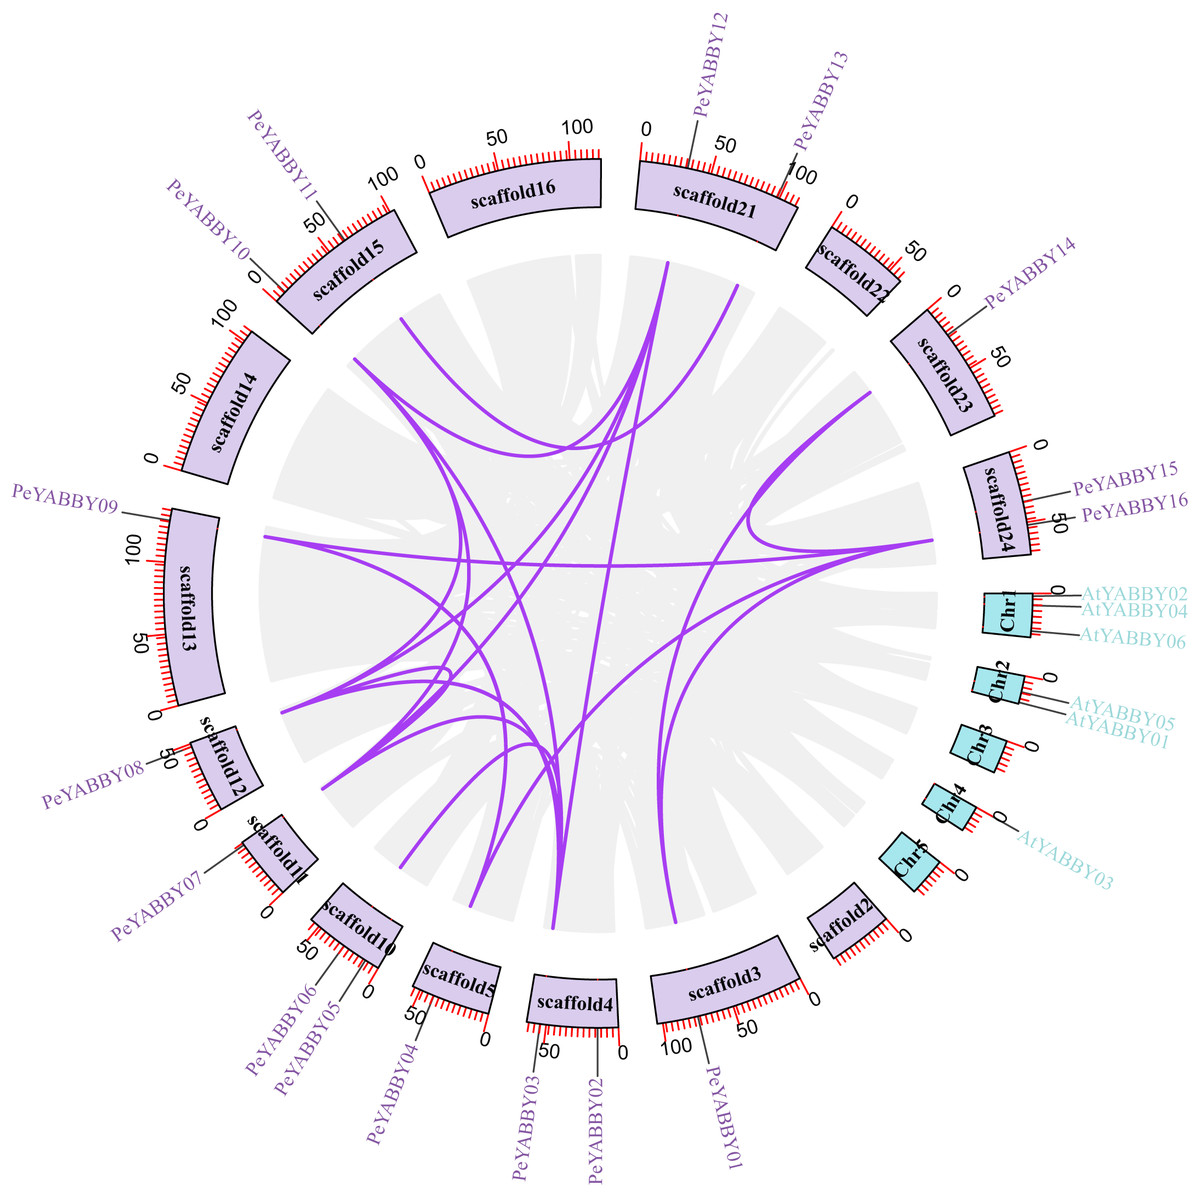
Figure 3: The synteny relationships between Moso bamboo and Arabidopsis.
Chromosomal distribution and expansion analysis of YABBY genes between two species, the lavender lines indicate the PeYABBY gene expansion of Moso bamboo.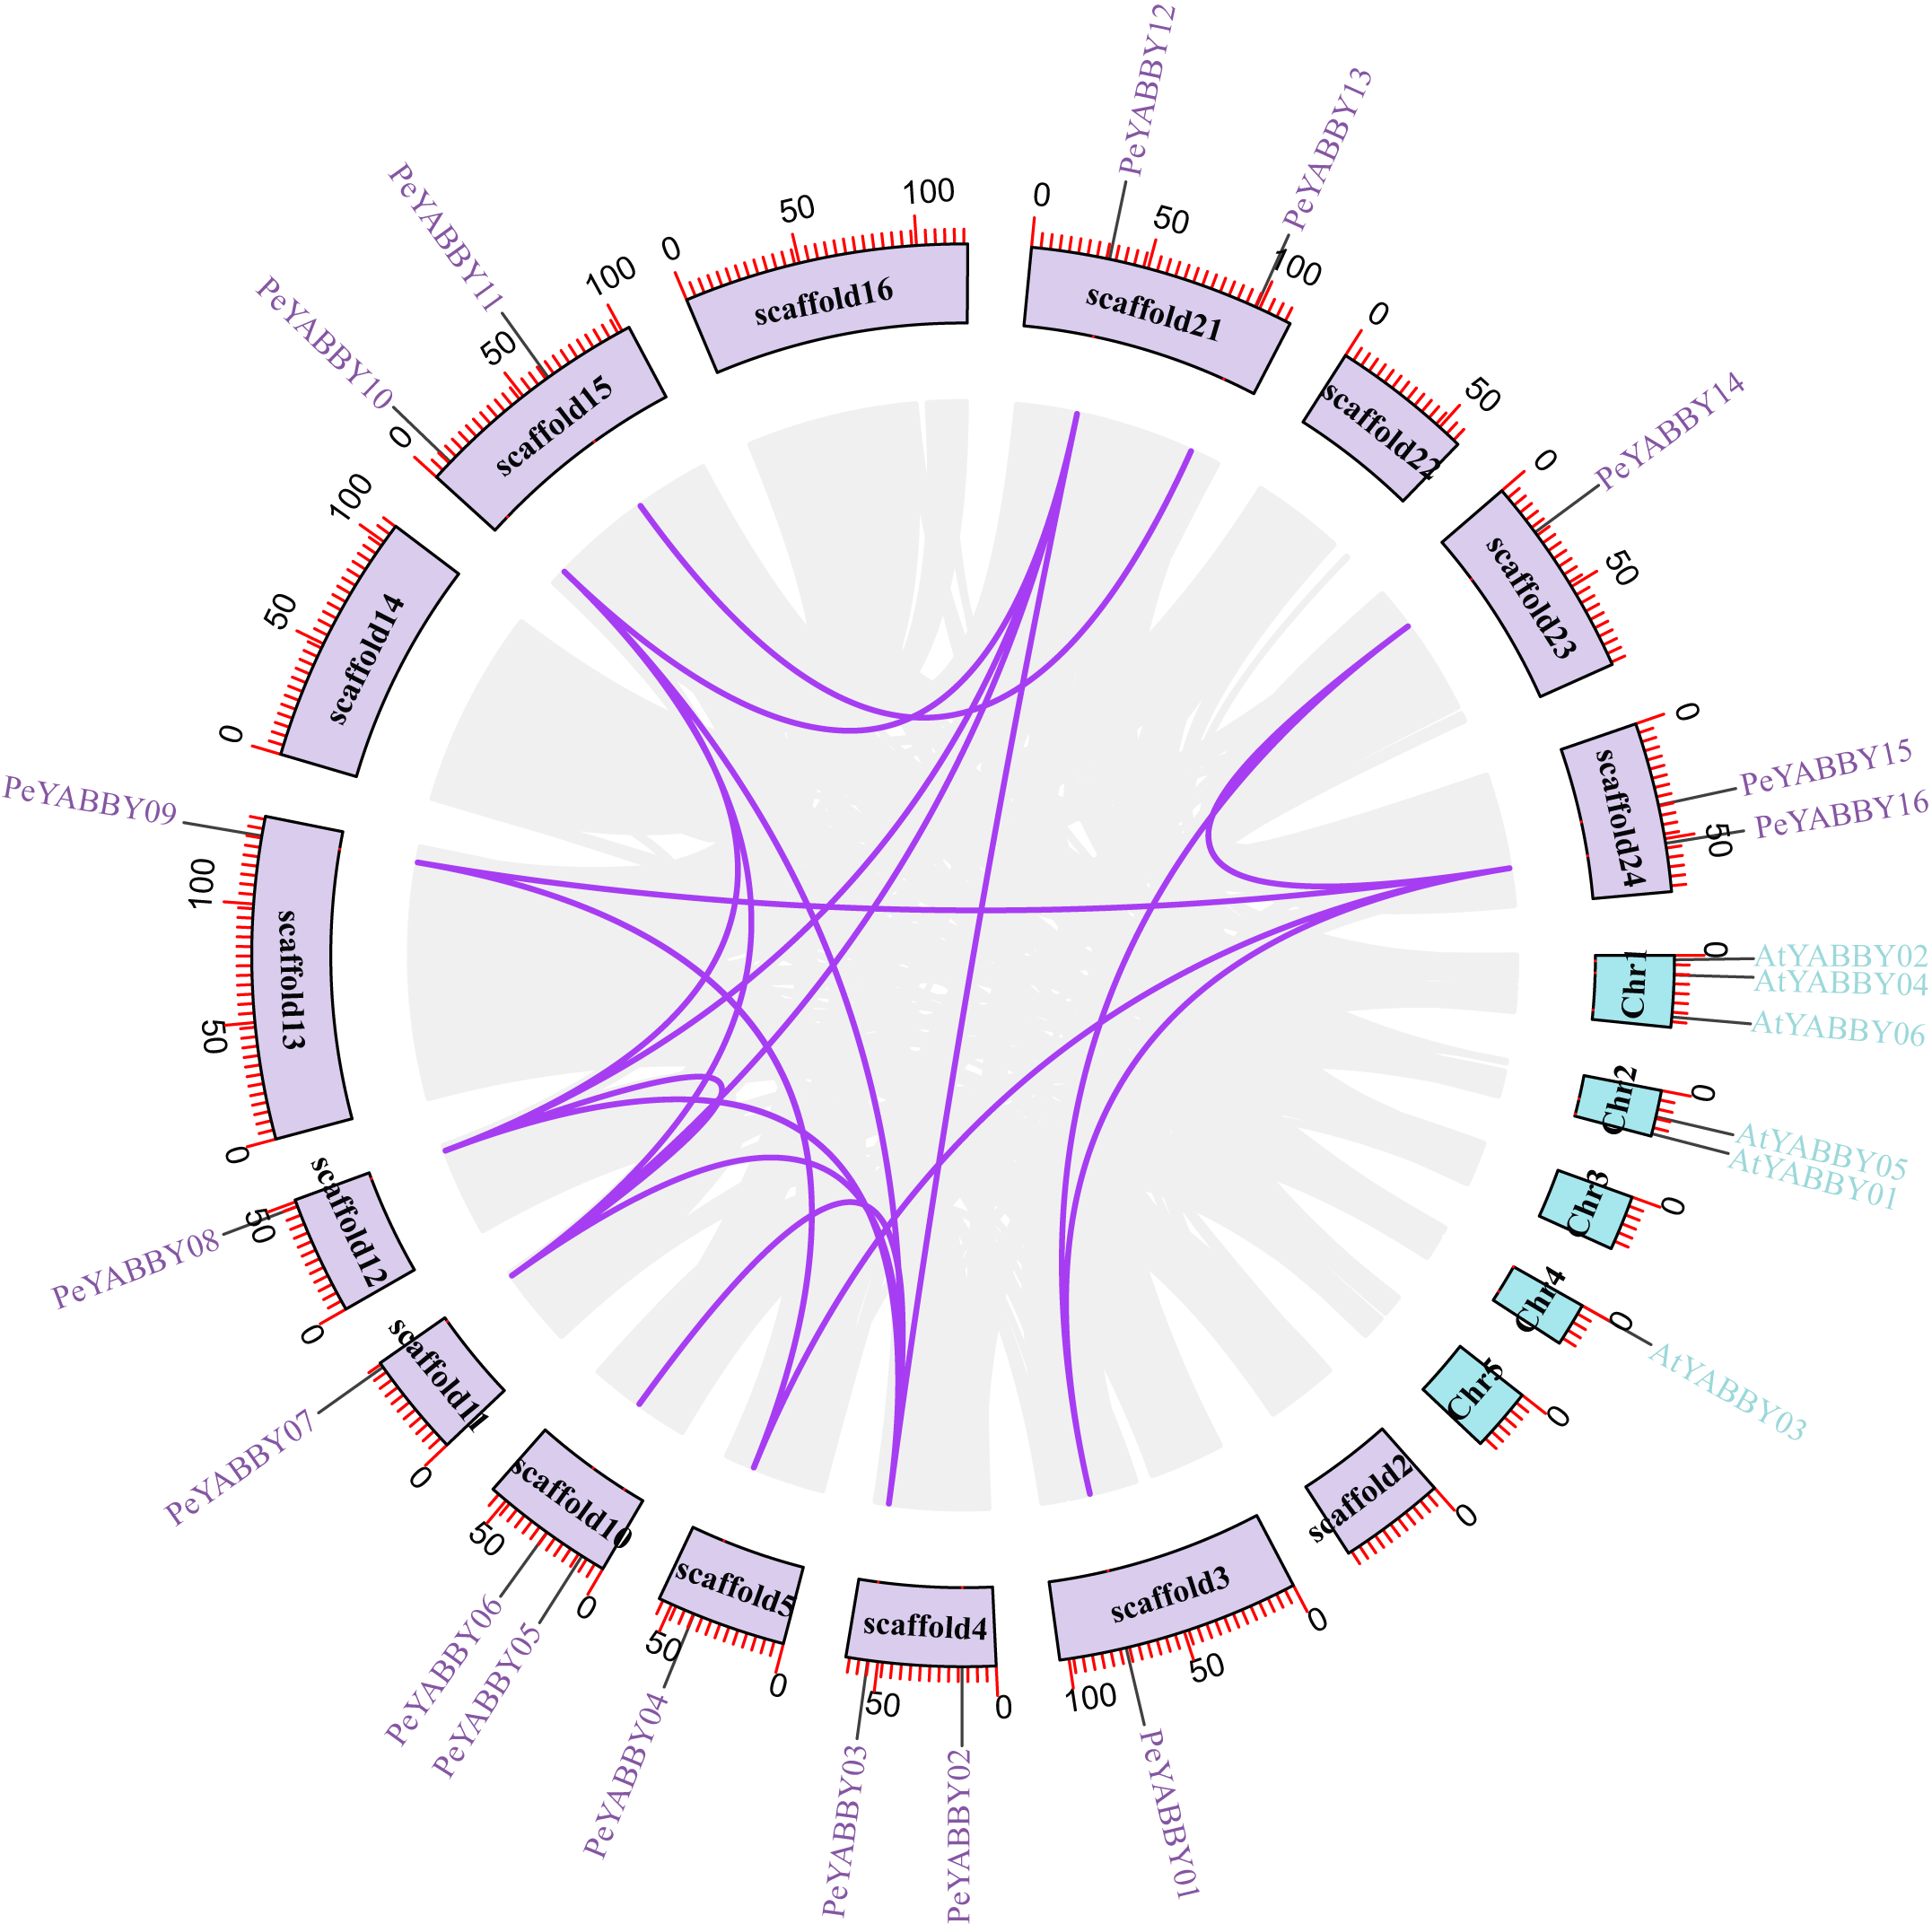
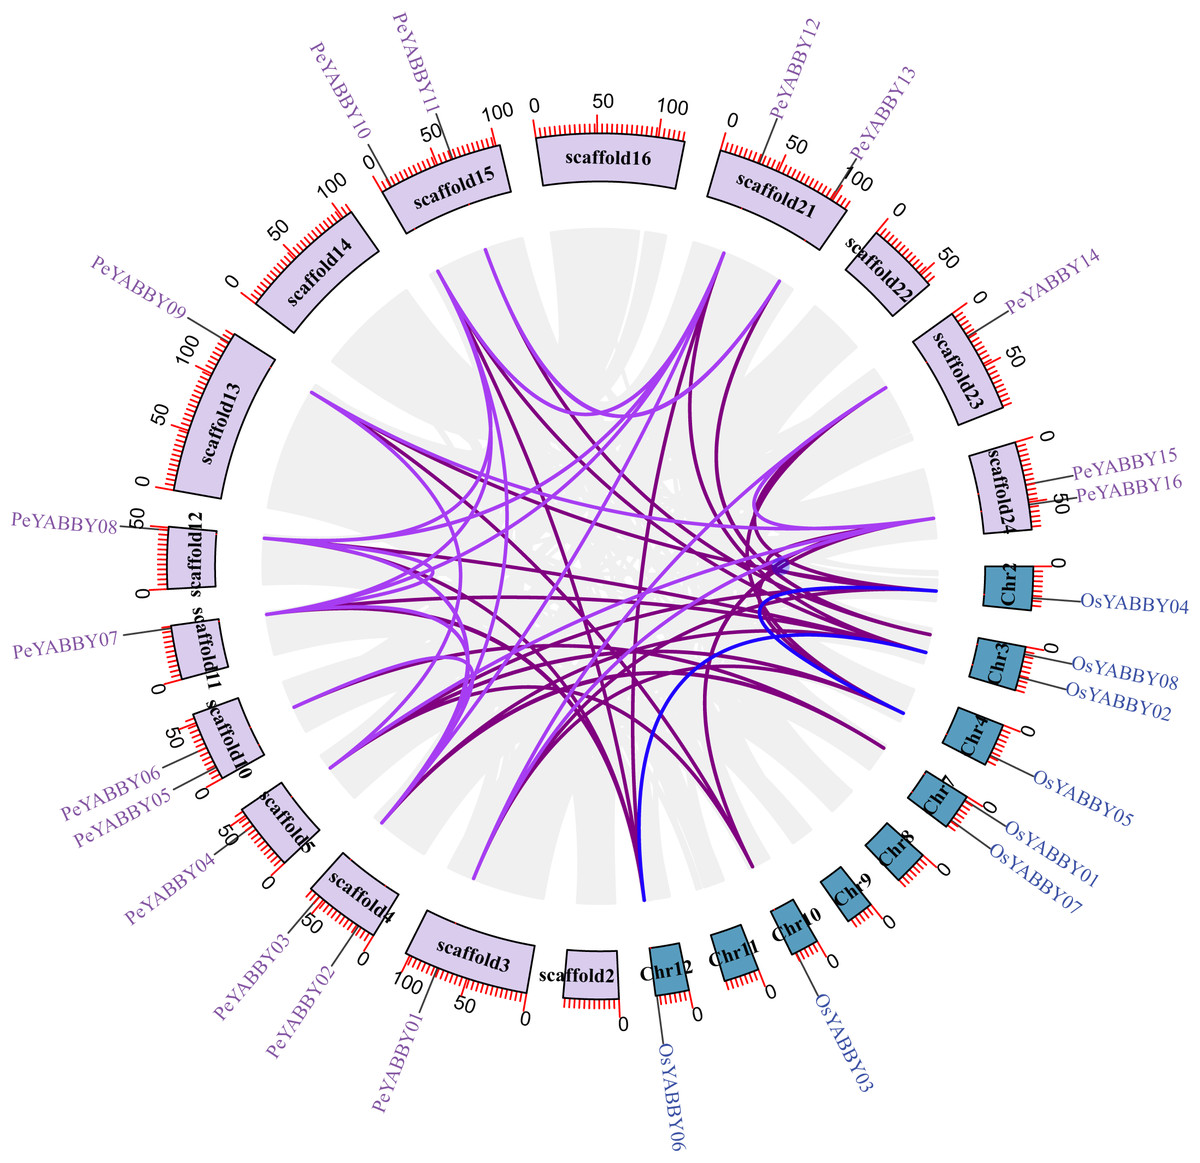
Figure 4: The synteny relationships between Moso bamboo and O. sativa.
Chromosomal distribution and expansion analysis of YABBY genes in two species. The lavender lines indicate the PeYABBY gene expansion of Moso bamboo, while the blue lines indicate the OsYABBY gene expansion of O. sativa. The modena lines indicate the YABBY genes expansion between Moso bamboo and O. sativa.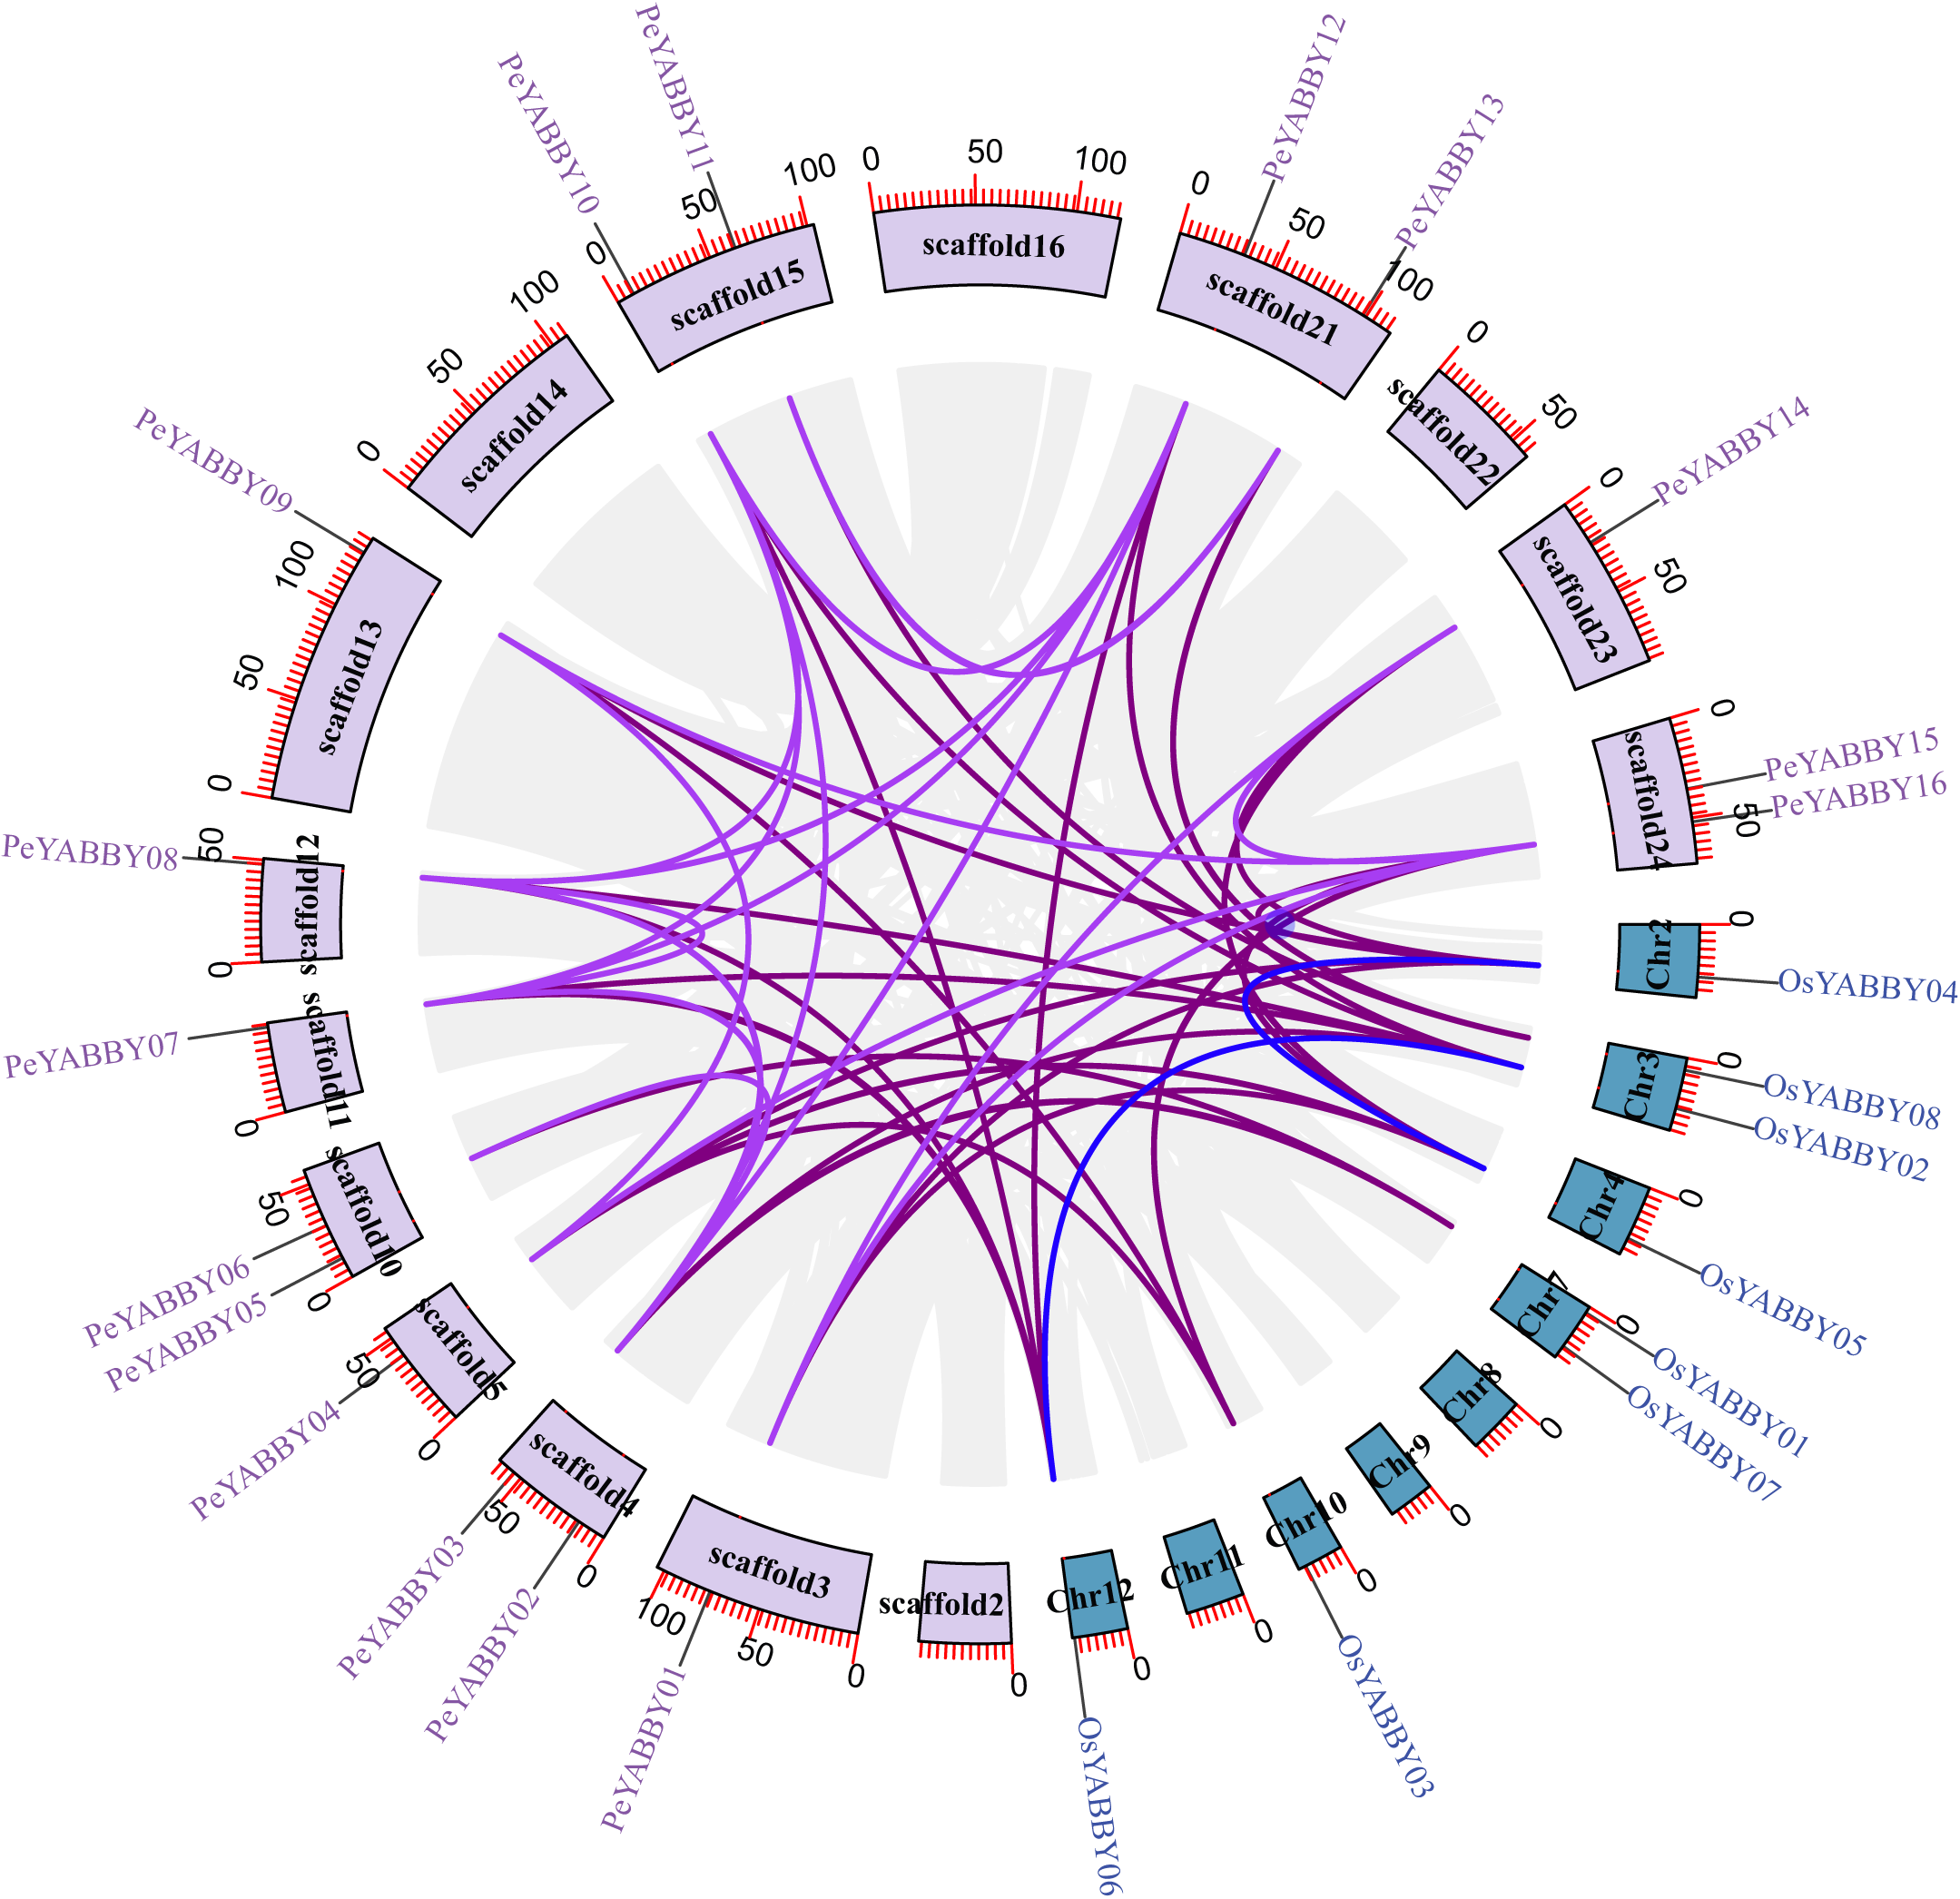
To further explore the relationship between purifying selection and YABBY family gene duplication and differentiation, the nonsynonymous (Ka), synonymous (Ks), and Ka/Ks substitution ratios were calculated for the duplicated gene pairs in order to estimate the age of the duplication events (Table 2). The Ks values for fragment replication ranged from 0.13 to 0.40. Thus, the inferred discrete time range was from 9.17 million years ago (Mya) to 77.84Mya. The Ka/Ks values of fragment replications were less than 1, indicating that they underwent purifying selection.
Gene structure, motifs and conserved domains-sequences ofYABBYinP. edulis
Sixteen genes were identified, which were divided into four subfamilies, including INO (INNER NO OUTER), CRC (CRABS CLAW), YAB3, and YAB2-I. The evolutionary aspects and structural diversity of the PeYABBY genes in bamboo were investigated by studying the exon-intron organization. All the PeYABBYs contained several introns, and the number of introns varied from 2 to 7 (Fig. S1). Additionally, two genes of the INO subfamily had no untranslated regions (UTR), while the CRC subfamily, which contained two genes (PeYABBY11 and PeYABBY13), contained a UTR at only one end. It was worth noting that the PeYABBY06 gene of the YAB3 subfamily lacked a UTR. The INO subfamily genes contained the shortest intronic regions and the YAB2-I subfamily genes included the longest intronic regions.
| Duplicated gene pairs | Ka | Ks | Ka/Ks | Purify selection | Time (Mya) |
|---|---|---|---|---|---|
| PeYABBY10/PeYABBY08 | 0.13 | 0.99 | 0.13 | Yes | 76.01 |
| PeYABBY12/PeYABBY07 | 0.14 | 1.01 | 0.14 | Yes | 77.84 |
| PeYABBY12/PeYABBY08 | 0.16 | 0.90 | 0.17 | Yes | 69.07 |
| PeYABBY14/PeYABBY01 | 0.25 | 0.69 | 0.36 | Yes | 53.29 |
| PeYABBY14/PeYABBY16 | 0.03 | 0.12 | 0.27 | Yes | 9.17 |
| PeYABBY04/PeYABBY09 | 0.12 | 0.31 | 0.40 | Yes | 23.48 |
| PeYABBY07/PeYABBY08 | 0.05 | 0.15 | 0.30 | Yes | 11.63 |
Notes:
- Ks
-
synonymous substitution rate
- Ka
-
nonsynonymous substitution rate
- Mya
-
million years ago
Motif analysis revealed that the INO subfamily genes only contained one motif. Although each member of the PeYABBY gene family contained a variable numbers of motifs, motif 2 was highly conserved (Fig. 5, Fig. S2). PeBBX06 of the YAB2-I subfamily had only two motifs, which may have resulted from deletion during evolution. The sequence logos of each motif were shown in Fig. 6. Among them, motif 2 and motif 3 contained more cysteine amino acids.
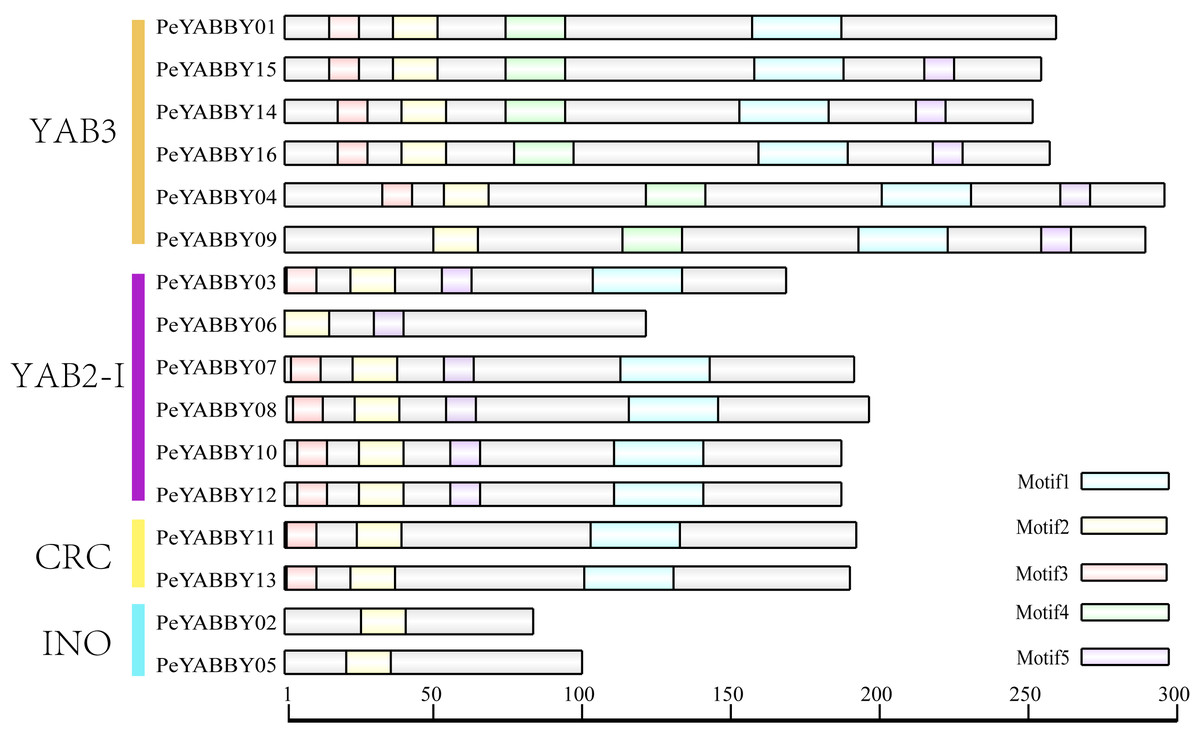
Figure 5: Analysis of YABBY motifs.
The proteins of PeYABBY are composed of five motifs. The conserved motifs were predicted using with MEME software (https://meme-suite.org/meme/). The bar represents protein sequence length.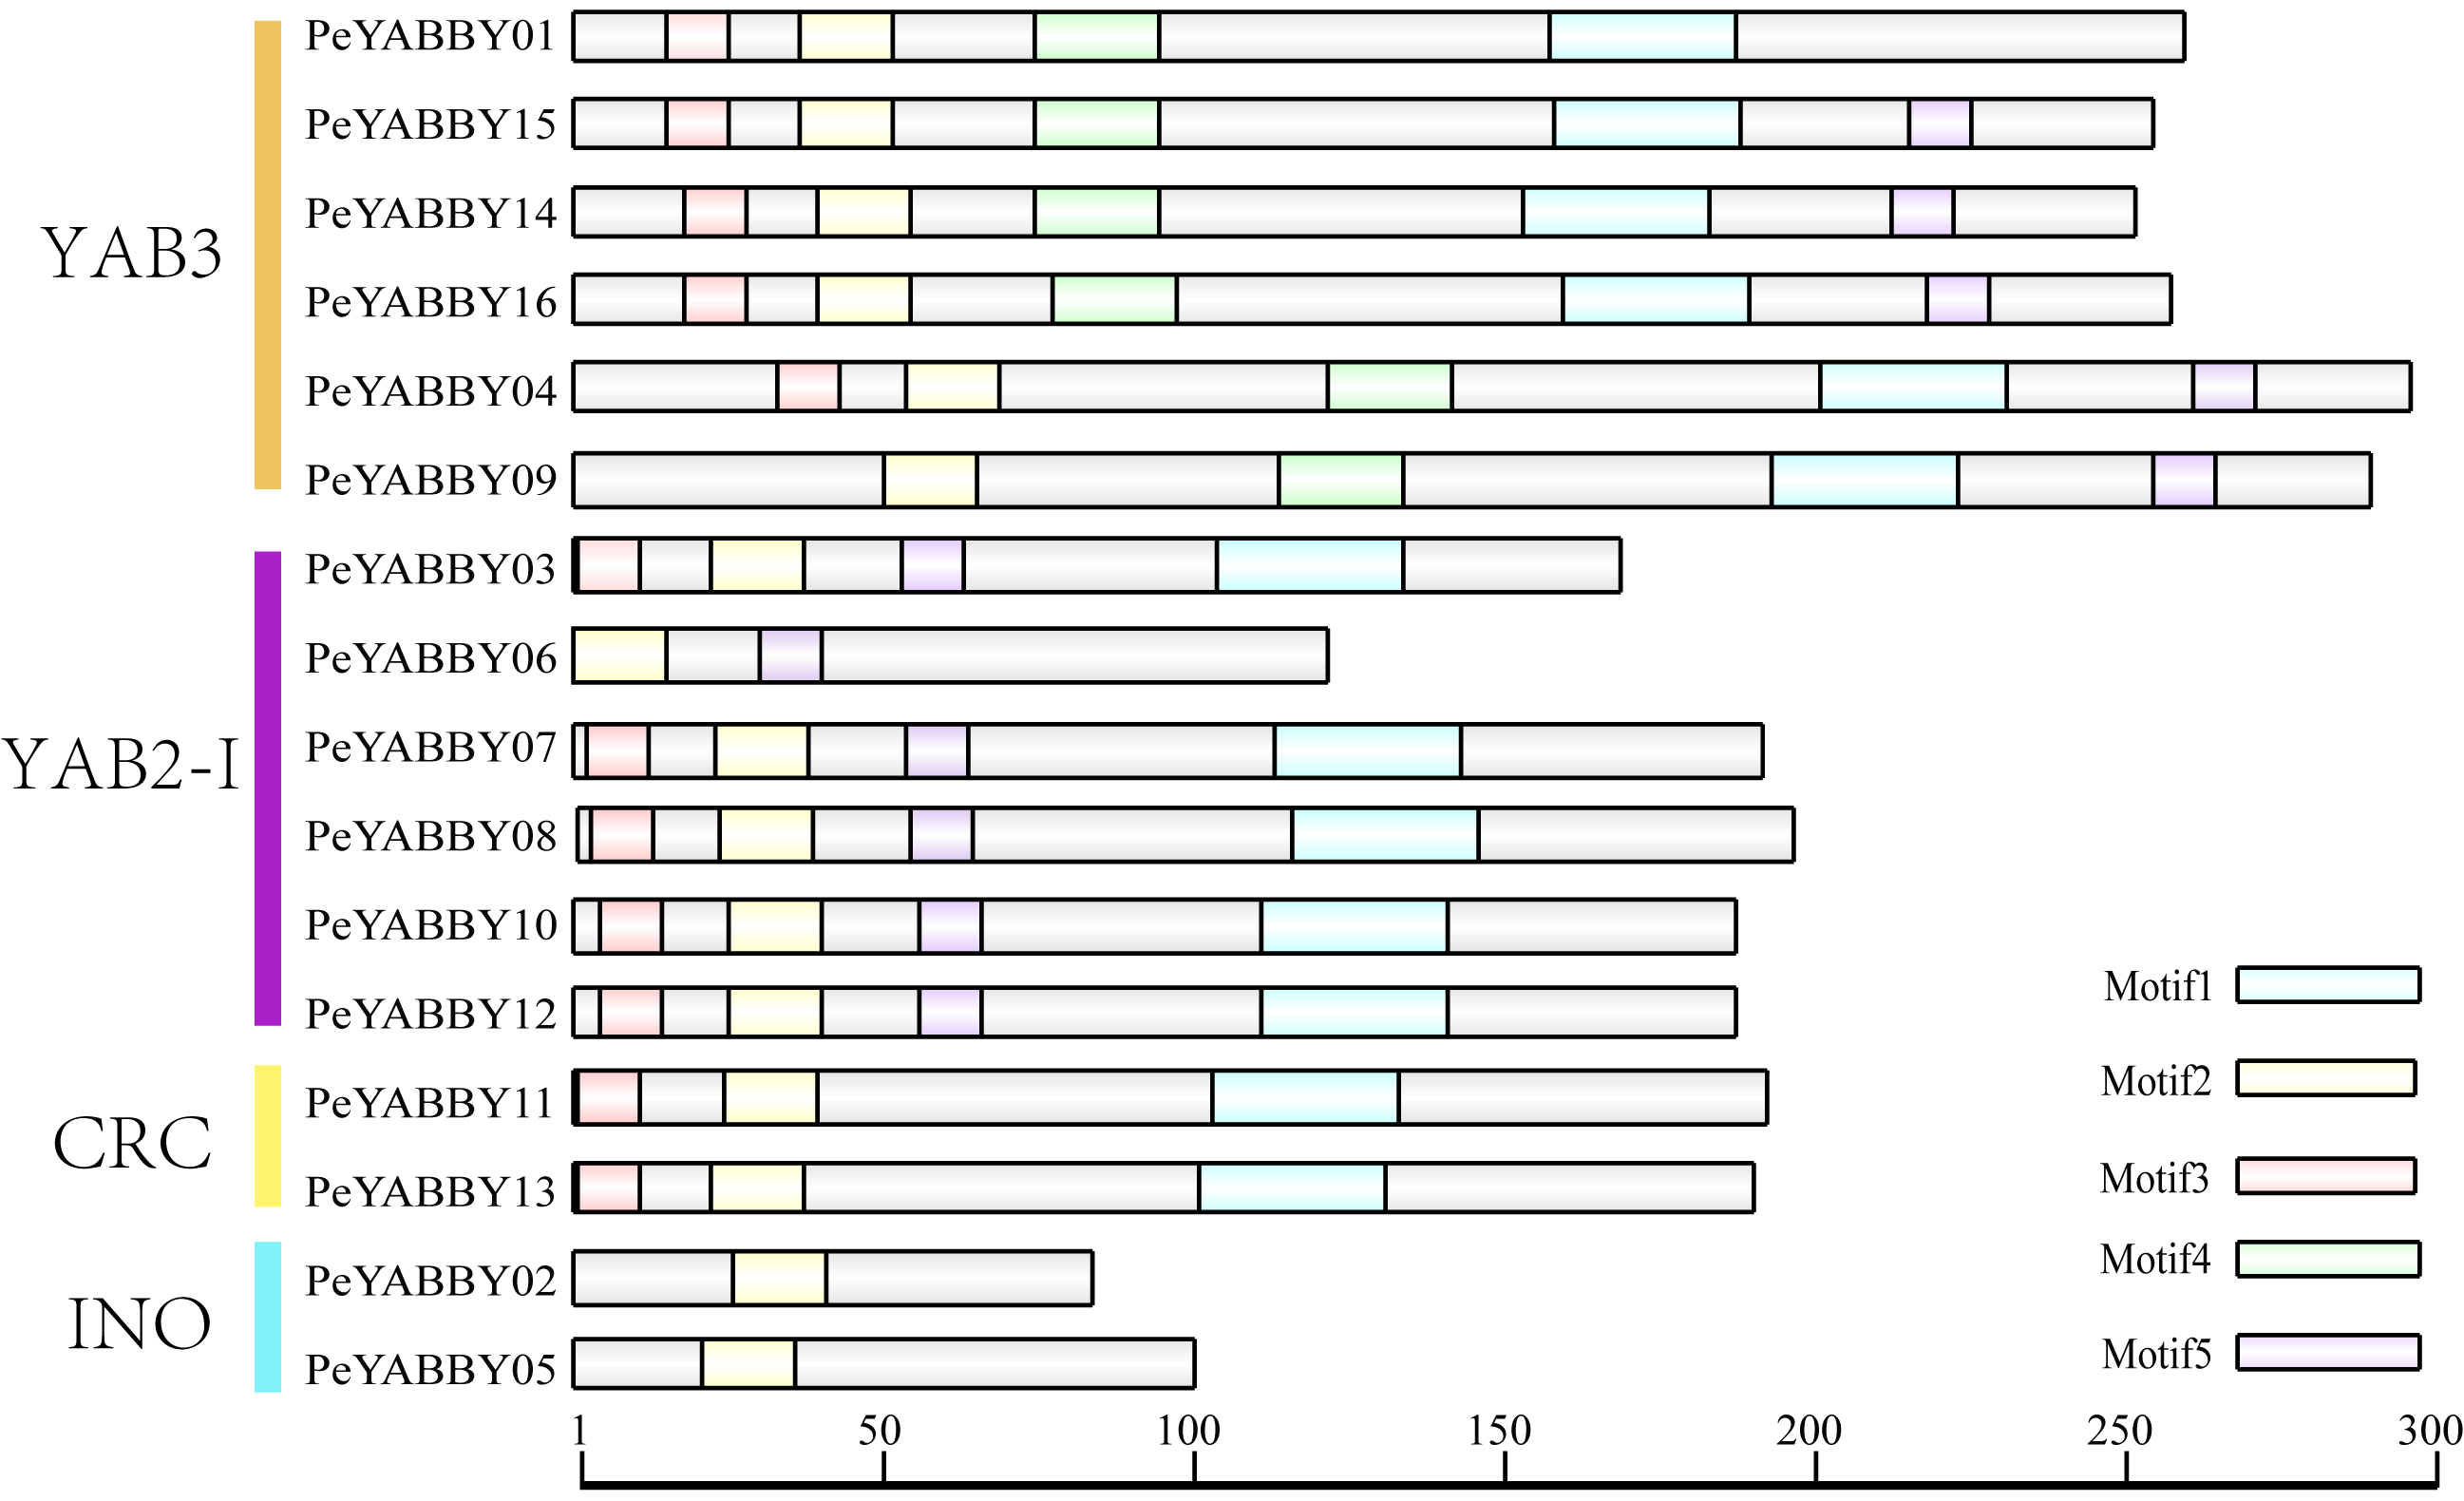
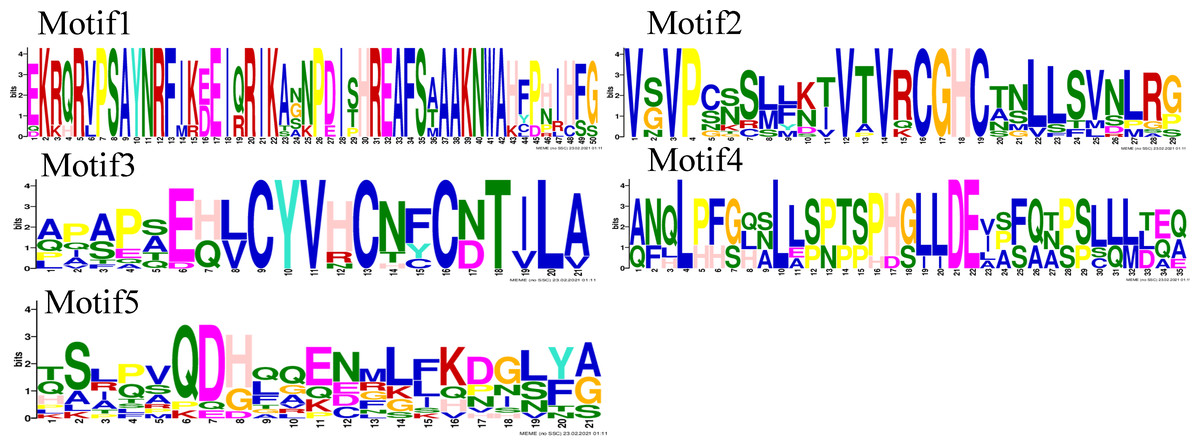
Figure 6: Motif sequence logos.
The name of the motifs are shown above the picture.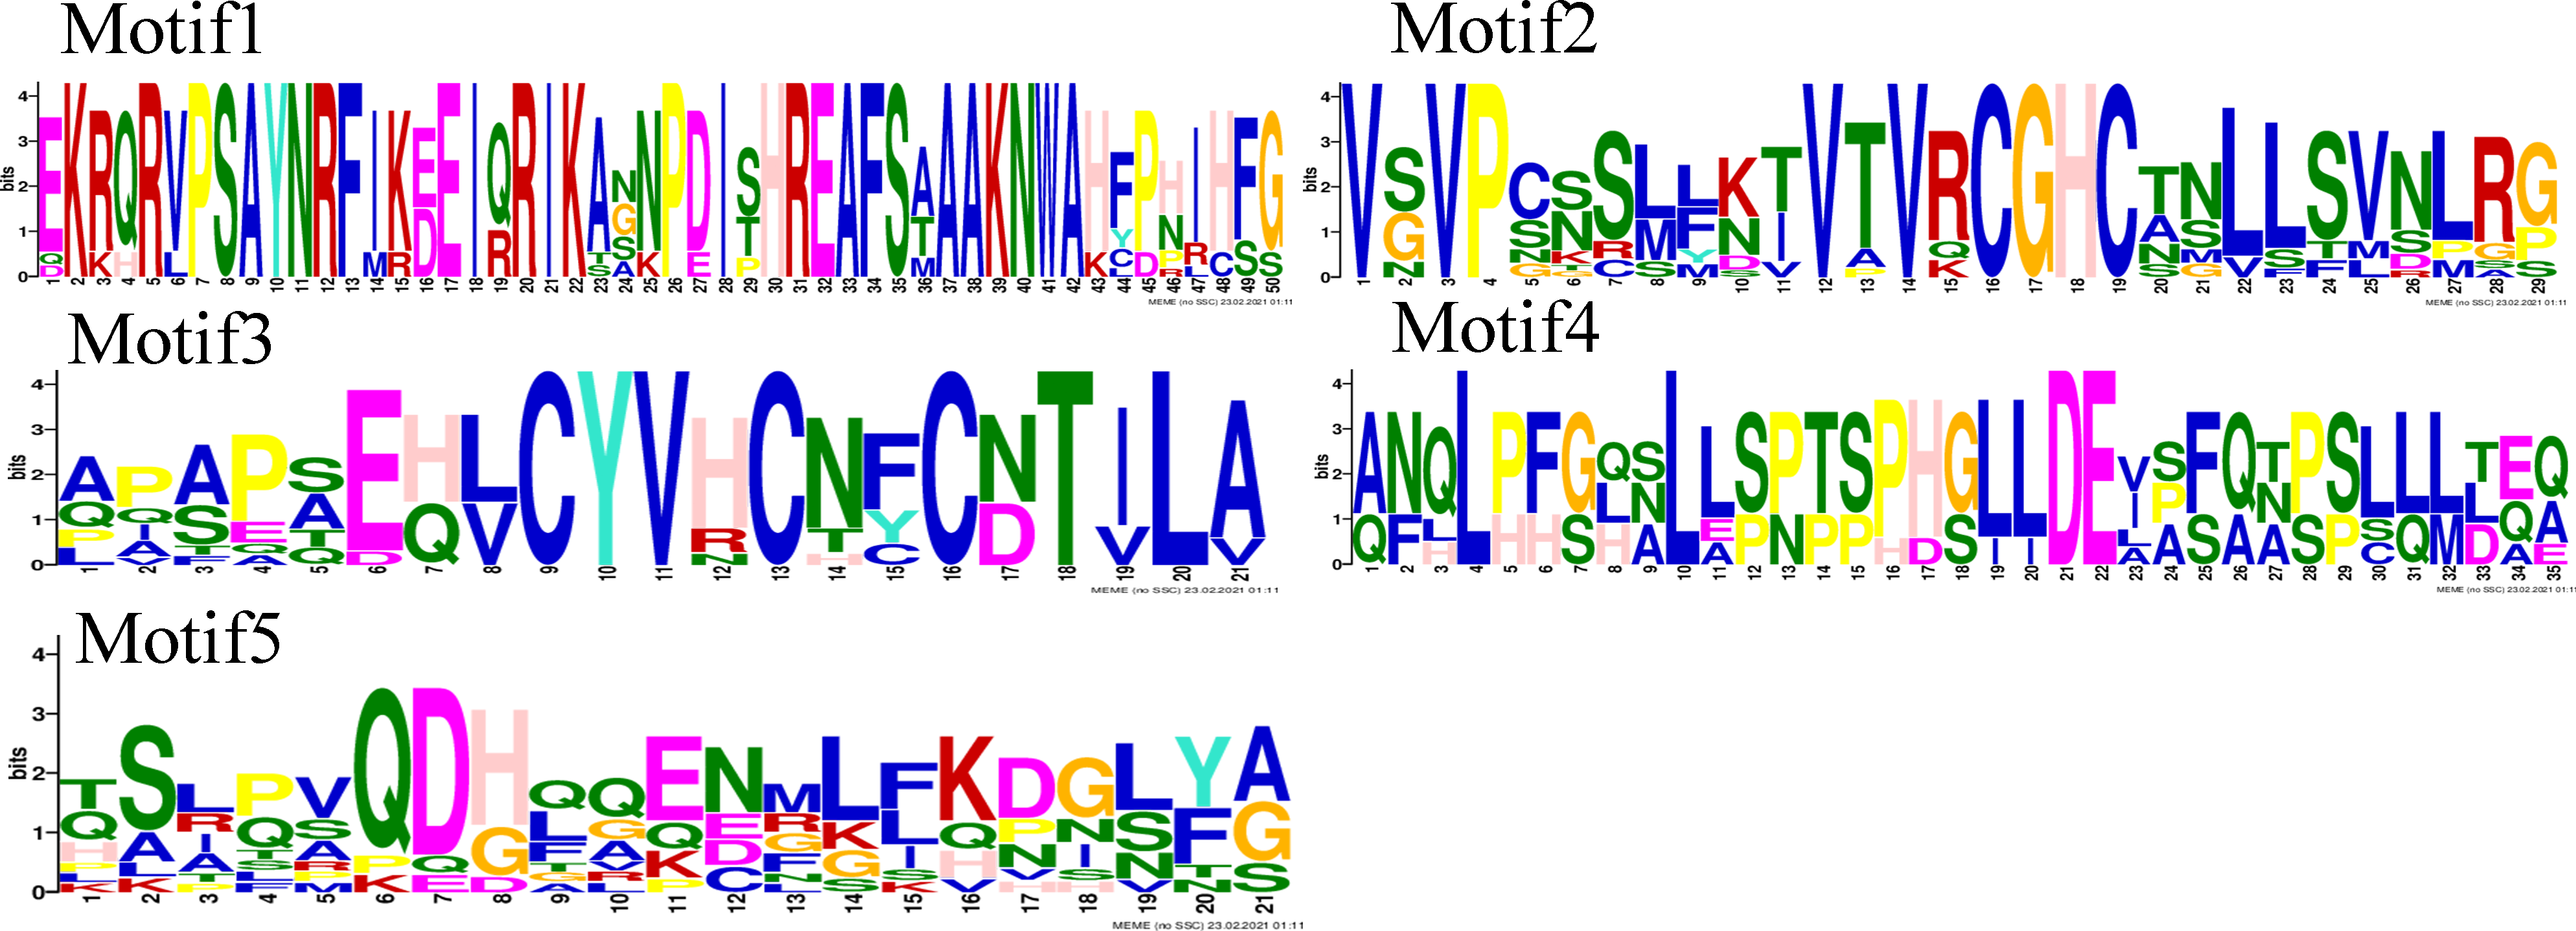
In order to analyze the homologous structural domain sequences in the C2-C2 zinc finger and YABBY domains and the degree of conservation of each amino acid residue, multiple sequence alignment analyses were performed. The results was shown in Fig. 7, which revealed a highly conserved C2-C2 zinc finger domain located at the N-terminal end of the protein sequences. In this region, the spatial configuration of the cysteine (C) and histidine (H) residues directly bound to Zn was conserved (C-X2-C-X20-CXL-HC). A 70-aa long YABBY domain was located near the carboxyl terminus, which was similar to the structure of other species’ YABBY proteins. However, the structures of the C2-C2 zinc finger domains for PeYABBY05, PeYABBY06, and PeYABBY09 were incomplete.
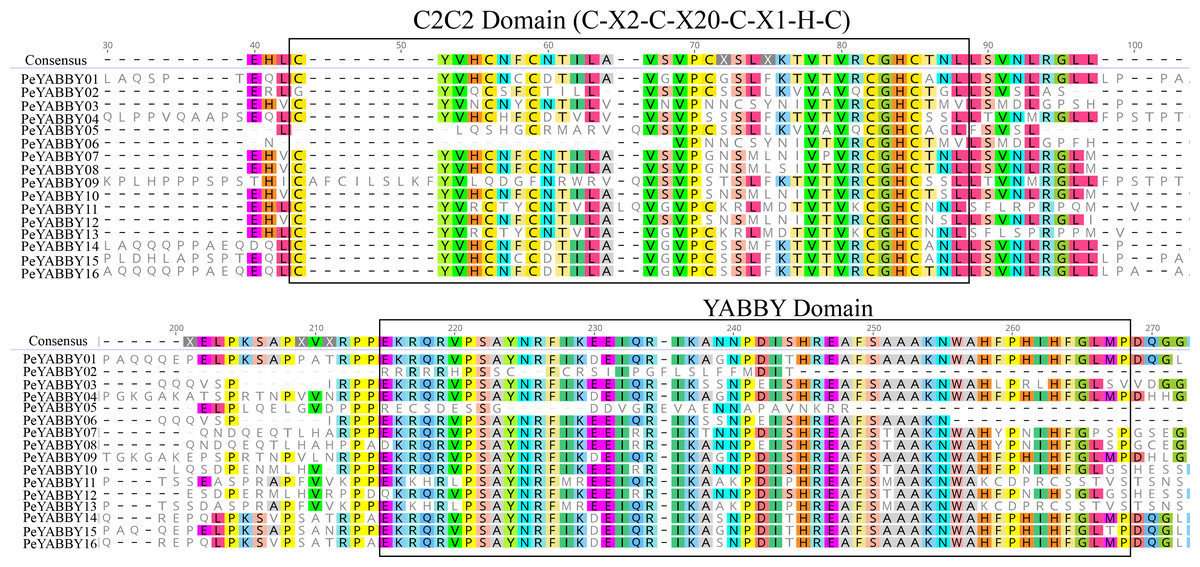
Figure 7: Conserved domains- sequence s analysis of the YABBY proteins.
Conservative YABBY structure domain by NCBI CDD software (https://www.ncbi.nlm.nih.gov/Structure/cdd/wrpsb.cgi) compare Pfam database for identification. The main domains are labeled, with the names of the domain displayed at the top of the sequences. On the left side, the name of the YABBY protein is displayed.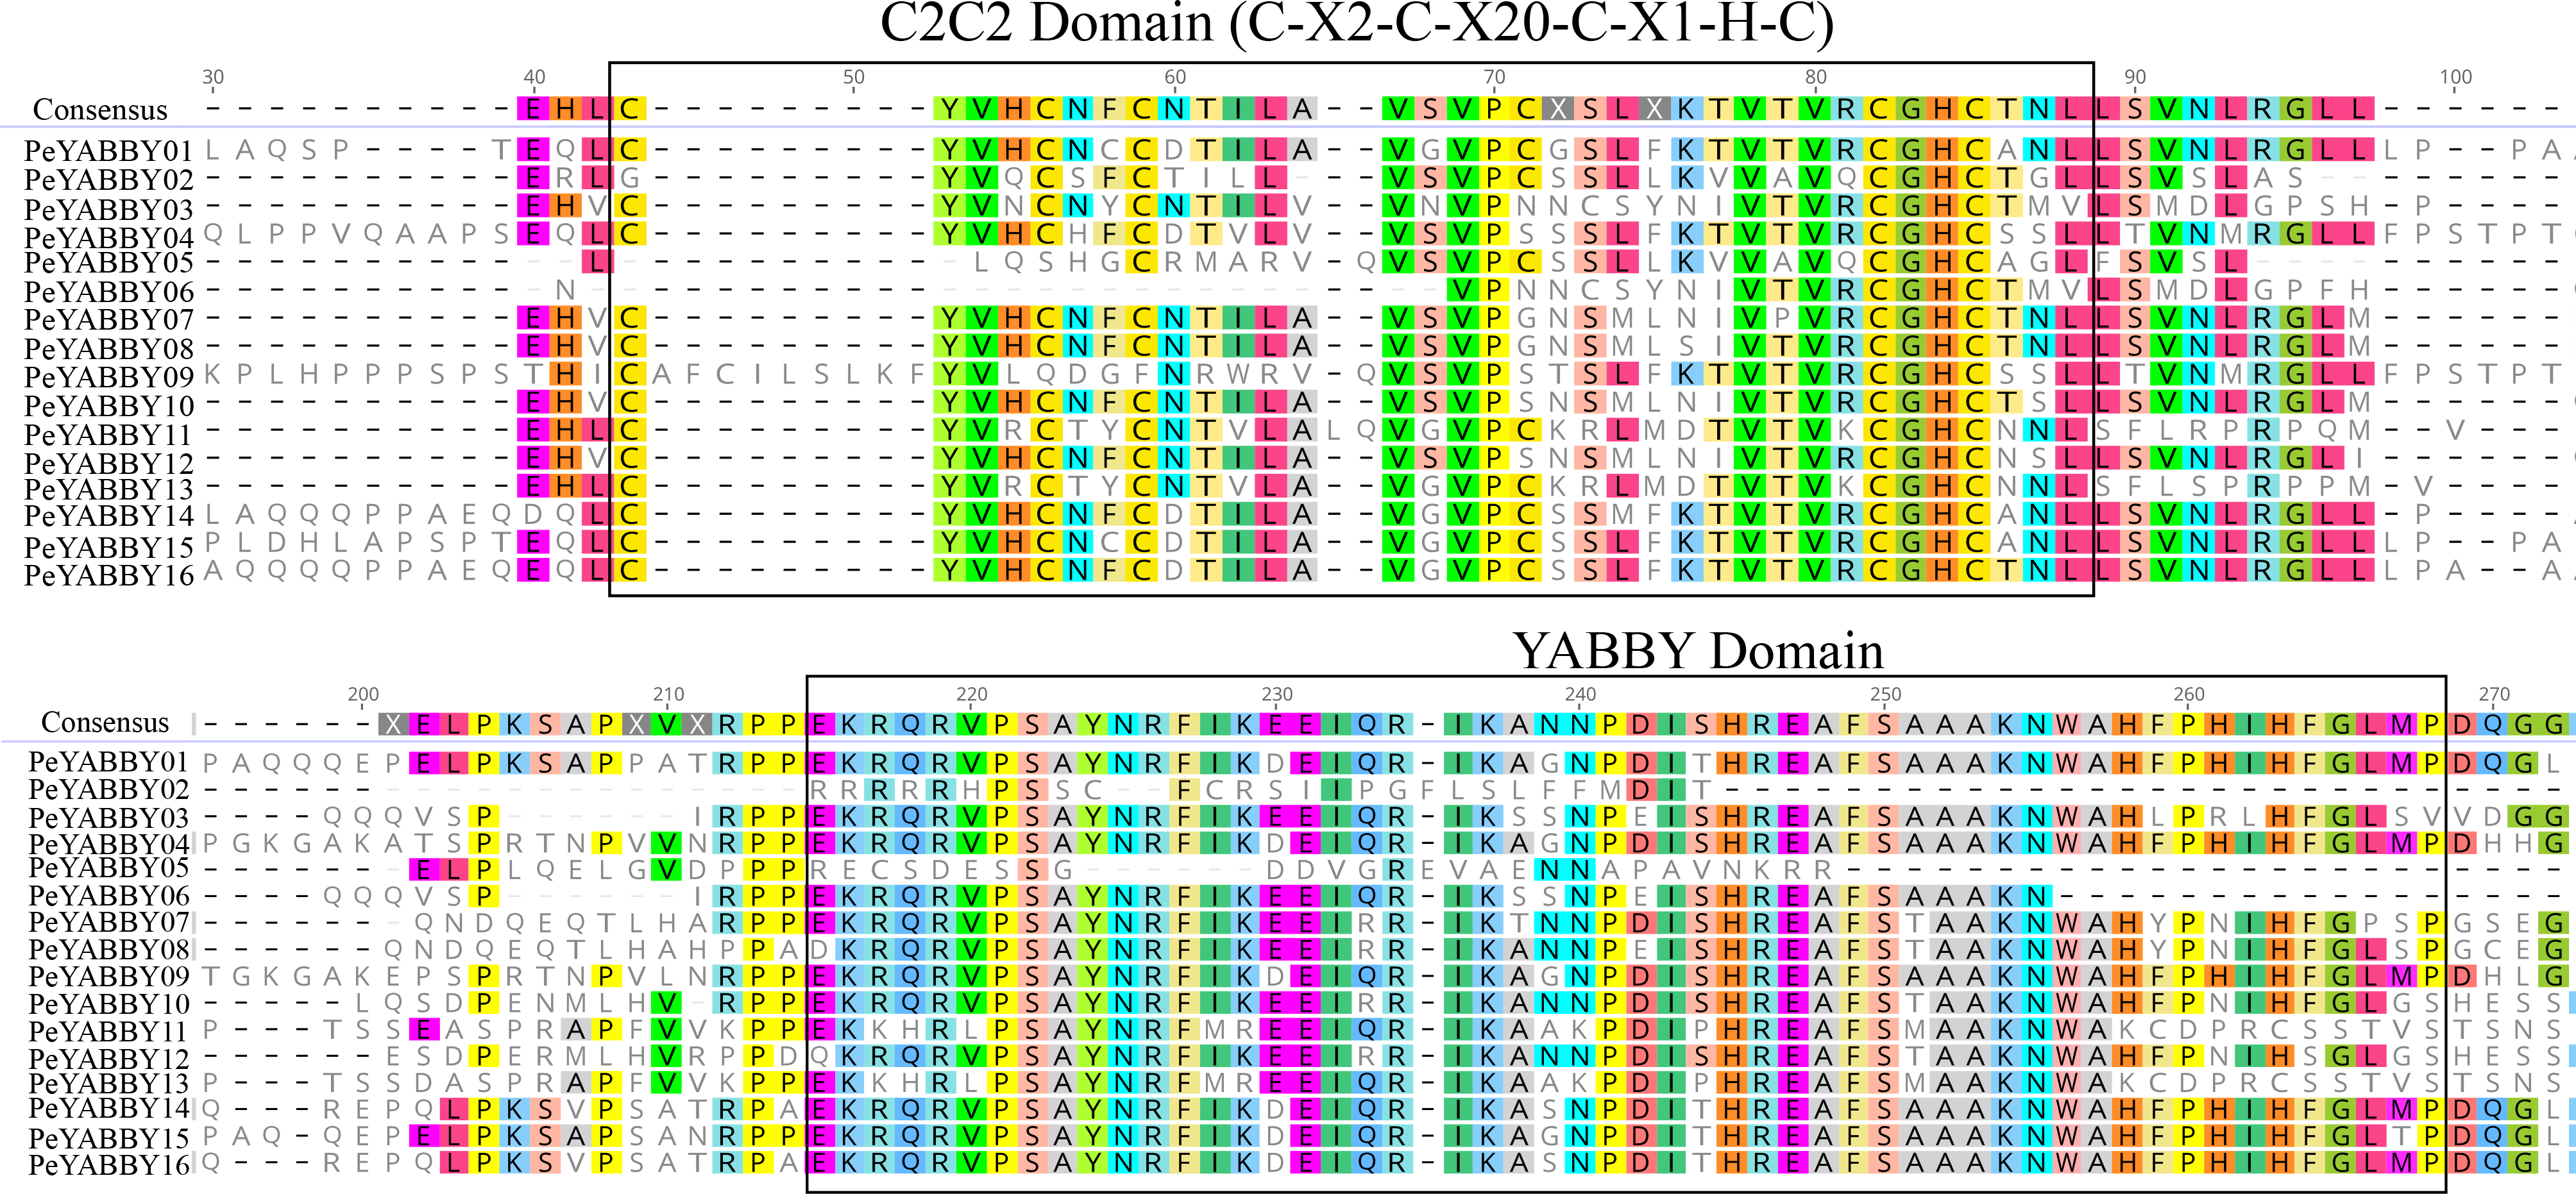
Promoter analysis of PeYABBY genes
Investigation of promoter region cis-acting regulatory elements (CRE) contributes to comprehend the regulation of gene transcription levels. In this study, the number of cis-acting elements associated with hormone (including MeJA, ABA, GA, salicylic acid (SA), auxin, and others), light, adversity, and developmental regulation was analyzed by searching the PlantCARE database to identify potential cis-acting elements in the 1500 bp upstream promoter region of the PeYABBY genes. The results were shown in the Fig. 8. Various hormone-responsive elements and light-responsive elements were found to exist in almost all promoters of PeYABBY genes. GA-responsive elements (GAREs), including a GARE-motif, P-box and TATC-box, were predicted to exist in the promoters of PeYABBY14, PeYABBY11, PeYABBY13, PeYABBY04, PeYABBY10, PeYABBY12, PeYABBY05, PeYABBY09, PeYABBY02, PeYABBY01, and PeYABBY06. GARE-motifs were predicted to be present in the promoters of PeYABBY14, PeYABBY11, PeYABBY13, PeYABBY02, and PeYABBY06. The TATC-box was predicted to exist in the promoters of PeYABBY04, PeYABBY10, and PeYABBY12. TCA-element, the SA responsiveness element, could be found in the promoter regions of PeYABBY16, PeYABBY03, PeYABBY11, PeYABBY15, PeYABBY05 and PeYABBY01. The abiotic stress-responsive TC-rich element was present in PeYABBY16 gene only, and the seed-regulated growth RY-element was present in the promoters of PeYABBY12 and PeYABBY06. At the same time, anaerobic response elements (ARE), drought-resistant elements (MBS) and low temperature response elements (LTR) were identified as cis-acting regulatory elements associated with abiotic stress.
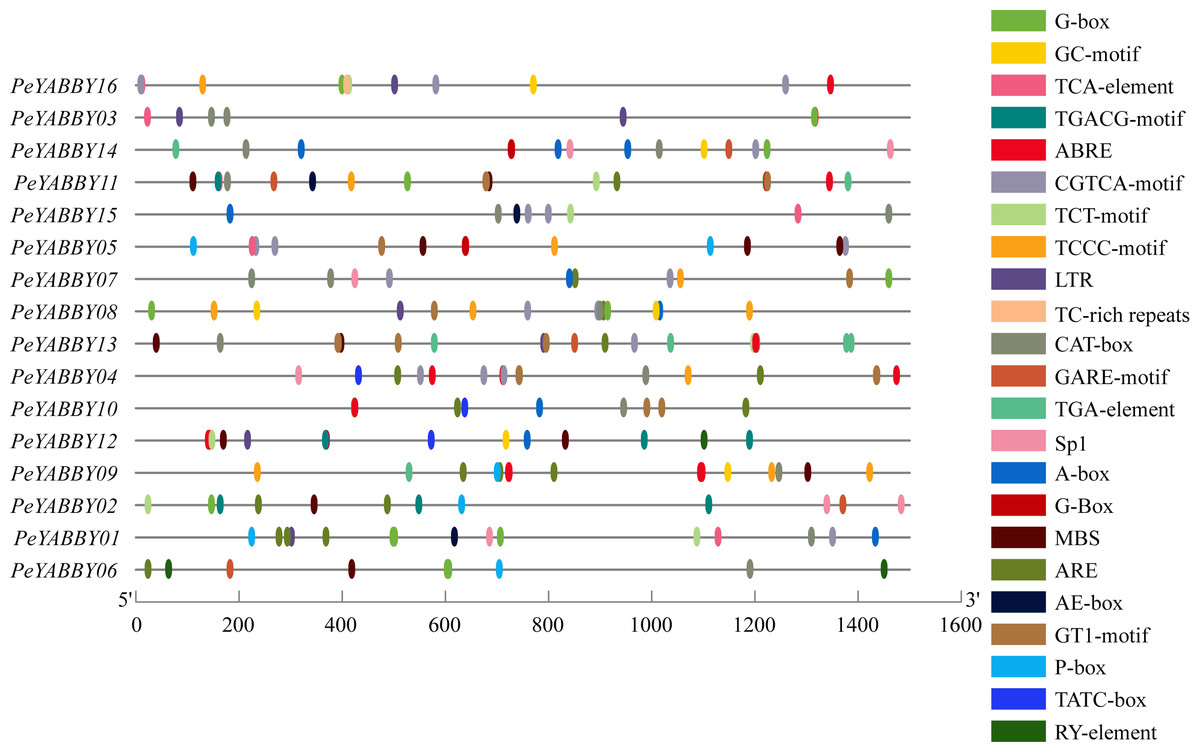
Figure 8: The cis.-acting regulatory elements analysis of PeYABBY genes.
The online analysis program PlantCARE (http://bioinformatics.psb.ugent.be/webtools/plantcare/html/) was used to investigate the 1,500 bp sequences upstream of the ATGs. Different cis-acting elements of Pe YABBY genes are displayed, with the different colored markers indicating different predicted cis-acting elements.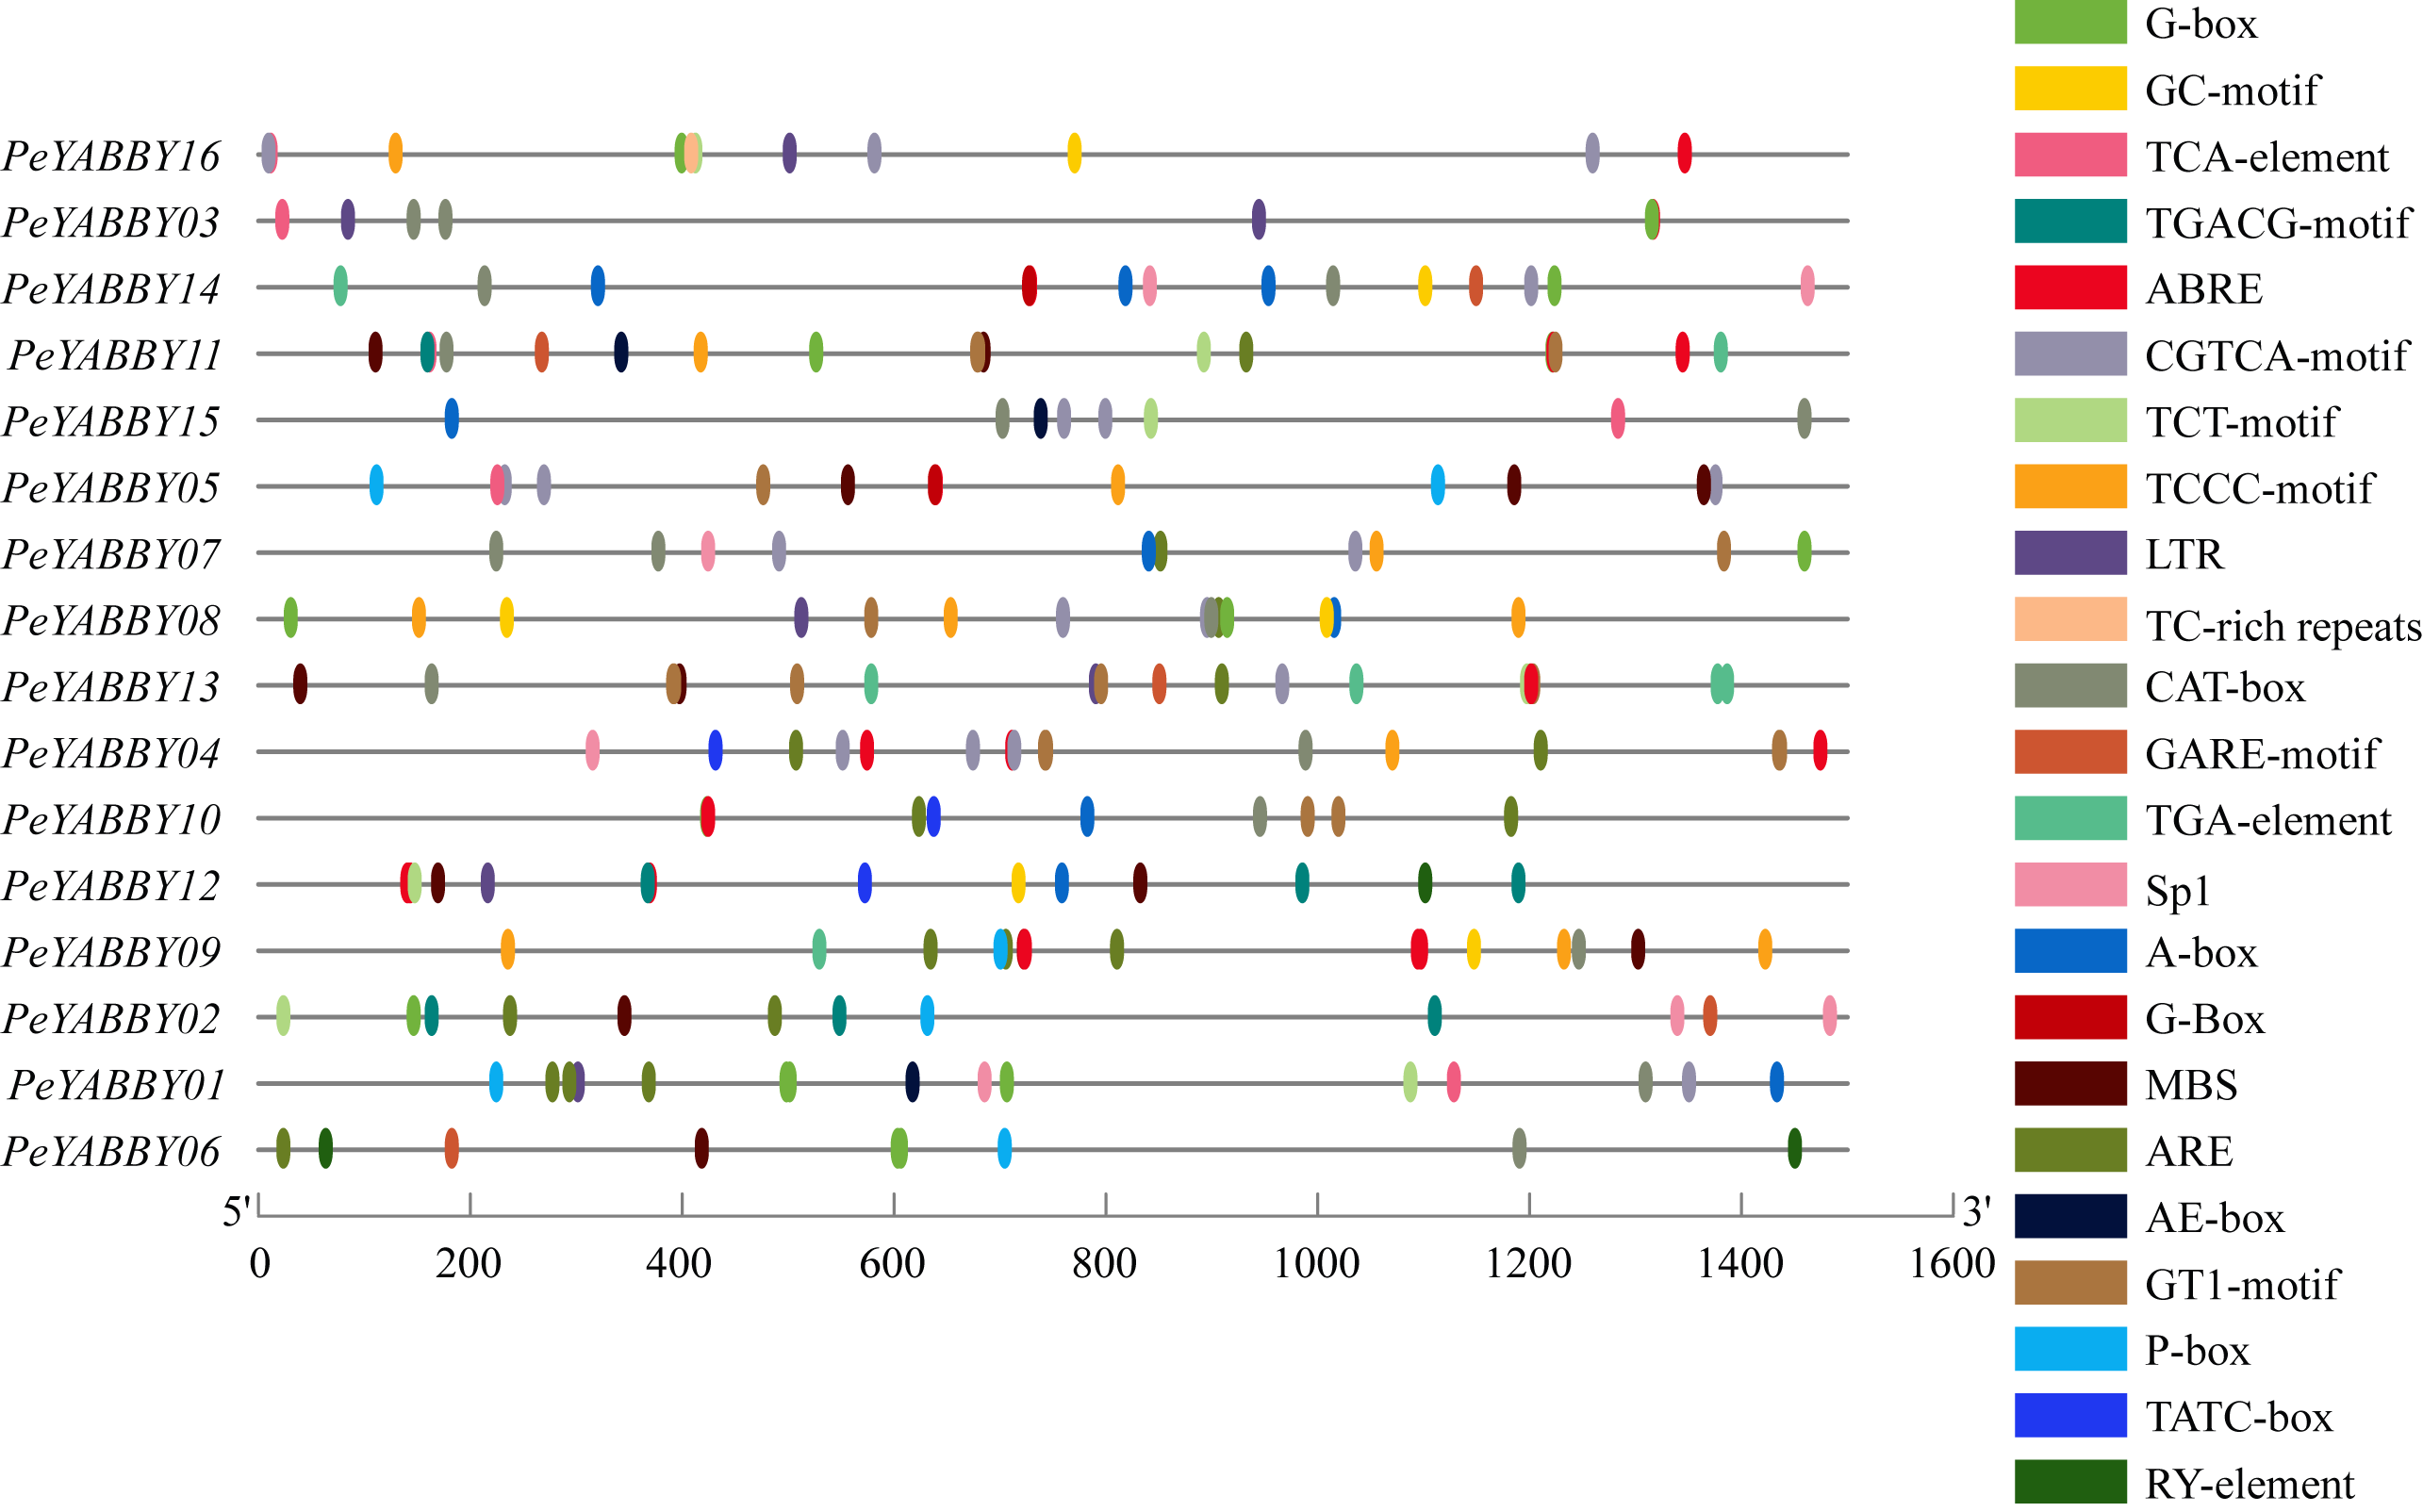
Expression patterns of the PeYABBY genes in different tissues and organs
To obtain the expression pattern of the YABBY genes in different tissues of Moso bamboo, we used the relevant transcriptome data available from the Genome Database website to examine the expression patterns of the Moso bamboo YABBY genes. In order to explore the potential function of PeYABBY genes in P. edulis, the expression levels of PeYABBYs in different tissues were examined, including root, rhizome, panicle, and leaf. Expression heatmaps were drawn using TBtools software with log2 TPM algorithm. The PeYABBY genes were shown to have clear tissue specificity (Fig. 9A, Table S3). Most PeYABBY genes had low root expression. PeYABBY06, PeYABBY08, PeYABBY03, PeYABBY10, and PeYABBY12 were highly expressed in leaves, panicles, and rhizomes despite having very low expression in roots. PeYABBY09 was significantly expressed in roots, leaves, panicles, and rhizomes, while PeYABBY02 was not expressed in roots, leaves, panicles, or rhizomes. PeYABBY11 and PeYABBY13 were significantly expressed in panicles.
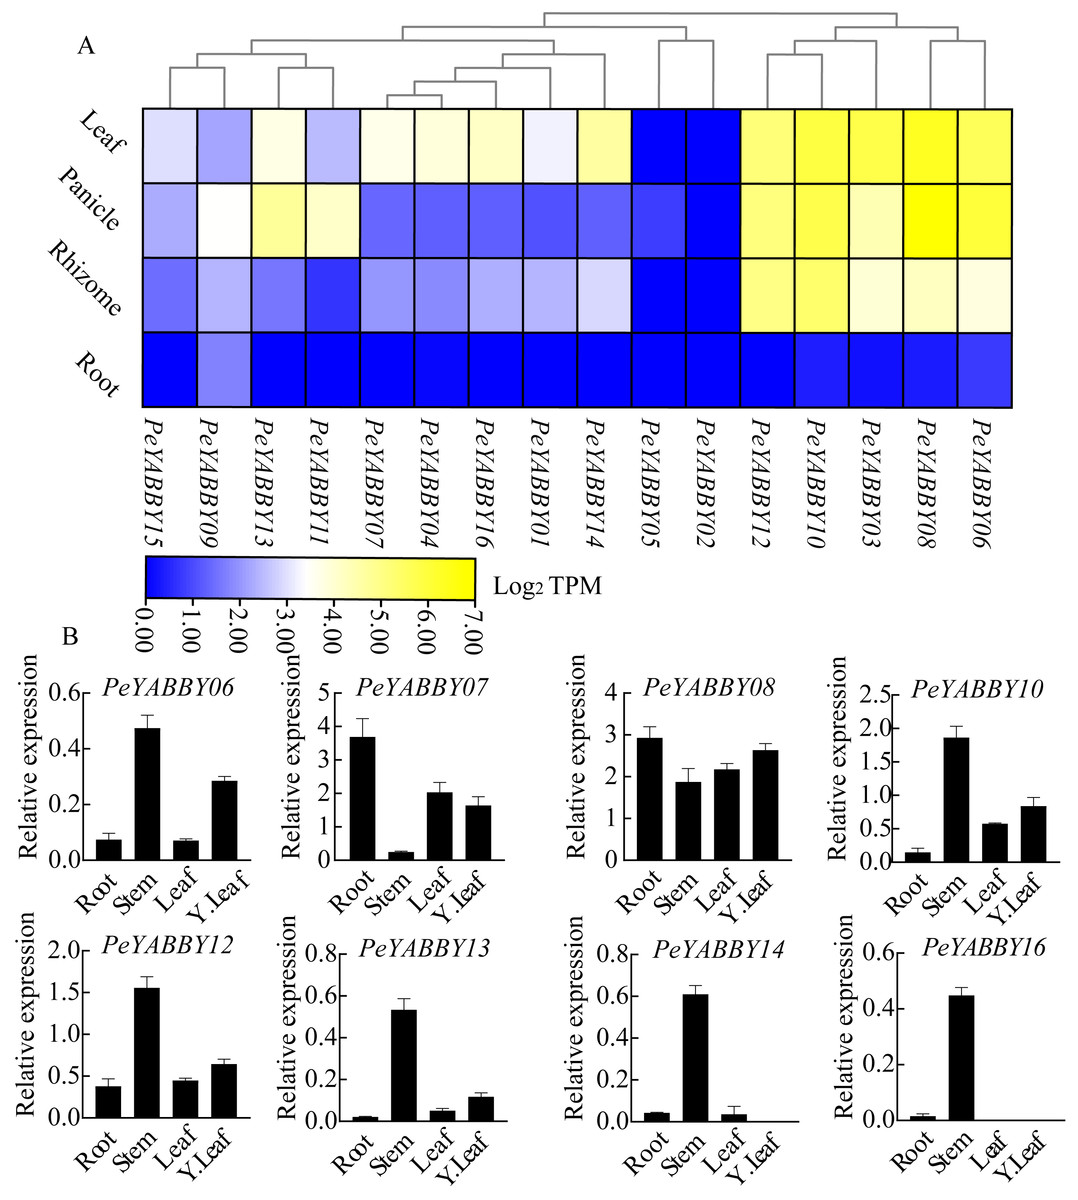
Figure 9: Expression profile cluster analysis of PeYABBY genes with differential tissue expression.
(A) Heatmap showing relative expression levels of PeYABBYs in roots, leaves, panicles, and rhizomes. The values are expressed with log2 TPM. (B) Expression of PeYABBY s in different tissues. Expression levels were calculated using the 2ΔCt method, this figure shows the eight PeYABBY genes with expression levels more than 0.5.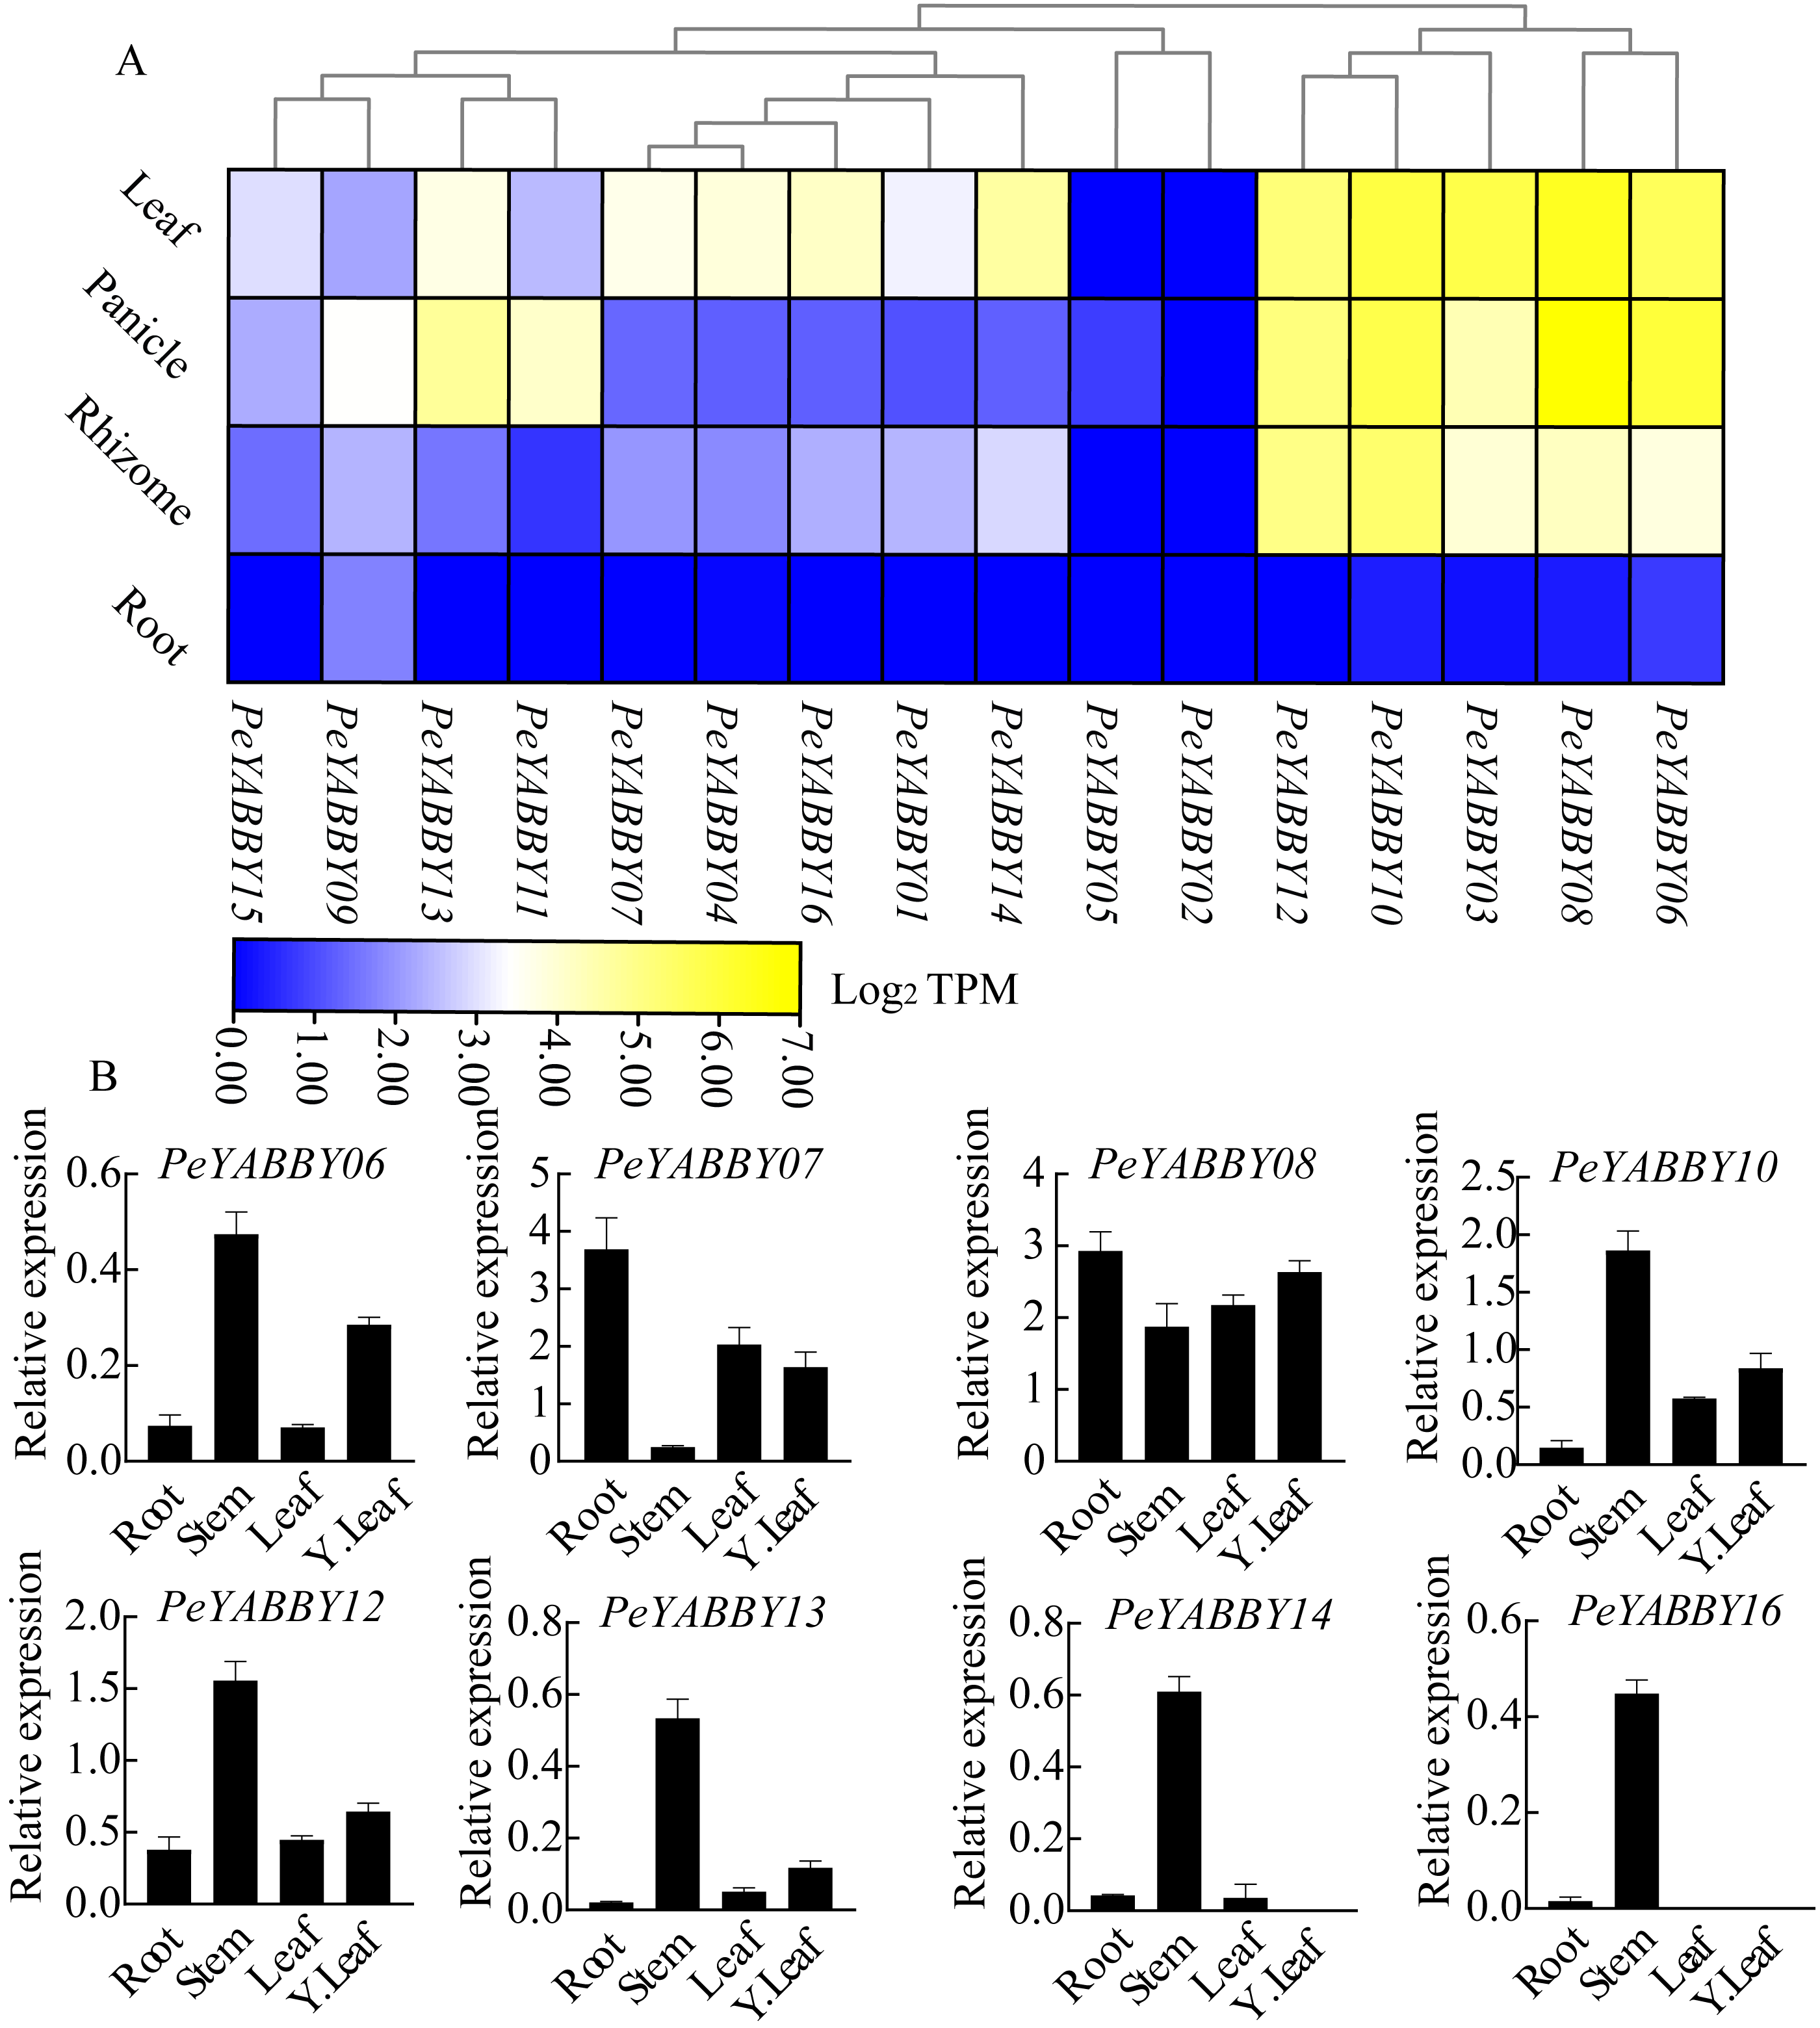
Next, the expression patterns of 16 members of the YABBY gene family in different tissues were then investigated using qRT-PCR. The results showed that PeYABBY16 were all expressed significantly in stems, but not in leaves, or young leaves. PeYABBY07 showed low expression in stems but significant expression in other tissues and the expression of PeYABBY08 was significant in four tissues. The expression patterns of PeYABBY06, PeYABBY10, PeYABBY12 and PeYABBY13 were similar in the four tissues, and it was obvious that the expression was most significant in the stem, followed by the young leaves, and then the tissues of leaves and roots (Fig. 9B). These results indicated that the genes of this family had obvious tissue specificity.
Responses of PeYABBY members under various phytohormonal treatments
The presence of predicted cis-acting regulatory elements in PeYABBY gene promoters indicated that they were likely involved in hormone responses. To test this hypothesis, we applied ABA and GA treatments to Moso bamboo seedlings. qRT-PCR was used to evaluate the relative expression levels of the PeYABBYs under phytohormonal treatments. Two genes (PeYABBY07 and PeYABBY08) were significantly up-regulated at 12 h after ABA treatment, while PeYABBY11 was up-regulated at 3 h after ABA treatment. Some PeYABBY genes were significantly down-regulated at each time point following ABA treatment, including PeYABBY02, PeYABBY03, PeYABBY06, PeYABBY10, and PeYABBY12 (Fig. 10A). As shown in Fig. 10B, PeYABBY06 was significantly up-regulated at each time point following GA treatment. The expression of PeYABBY13 was down-regulated by GA only at 12 h, 24 h, and 48 h after treatment. In addition, PeYABBY04 was down-regulated at all time points after GA treatment. Furthermore, PeYABBY03 was up-regulated at 12 h after GA treatment only but was down-regulated at all other time points following GA treatment. Taken together, these results indicate that YABBY family genes were highly responsive to different hormone treatments.
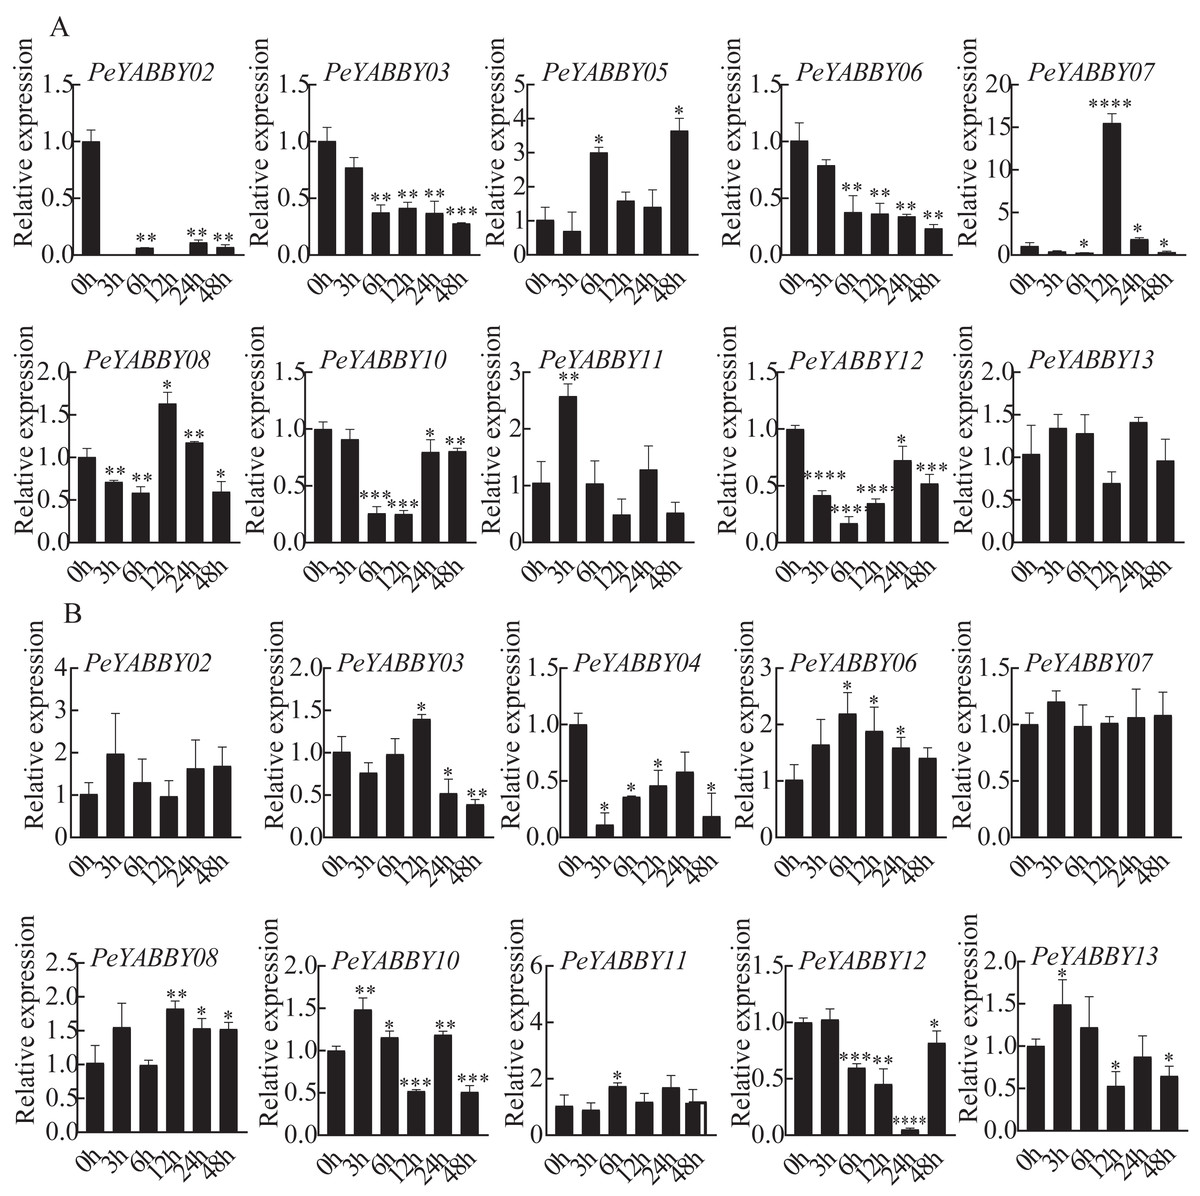
Figure 10: QRT-PCR analyses of PeYABBY. genes under phytohormone treatments.
(A) The expression patterns of PeYABBY s under ABA treatment. (B) The expression patterns of PeYABBY s under GA treatment. The concentration of ABA and GA was 100 µM and 50 µM, respectively. A single asterisk shows that the level of gene expression in the treatment group was substantially different from the control group (t-test, p < 0 .05). There was a much more significant difference (t-test, p < 0.01) when double asterisks were used. The 2−ΔΔCt method was used to look at the relative expression levels of the target genes. The standard deviations of the means of independent replicates are expressed by error bars.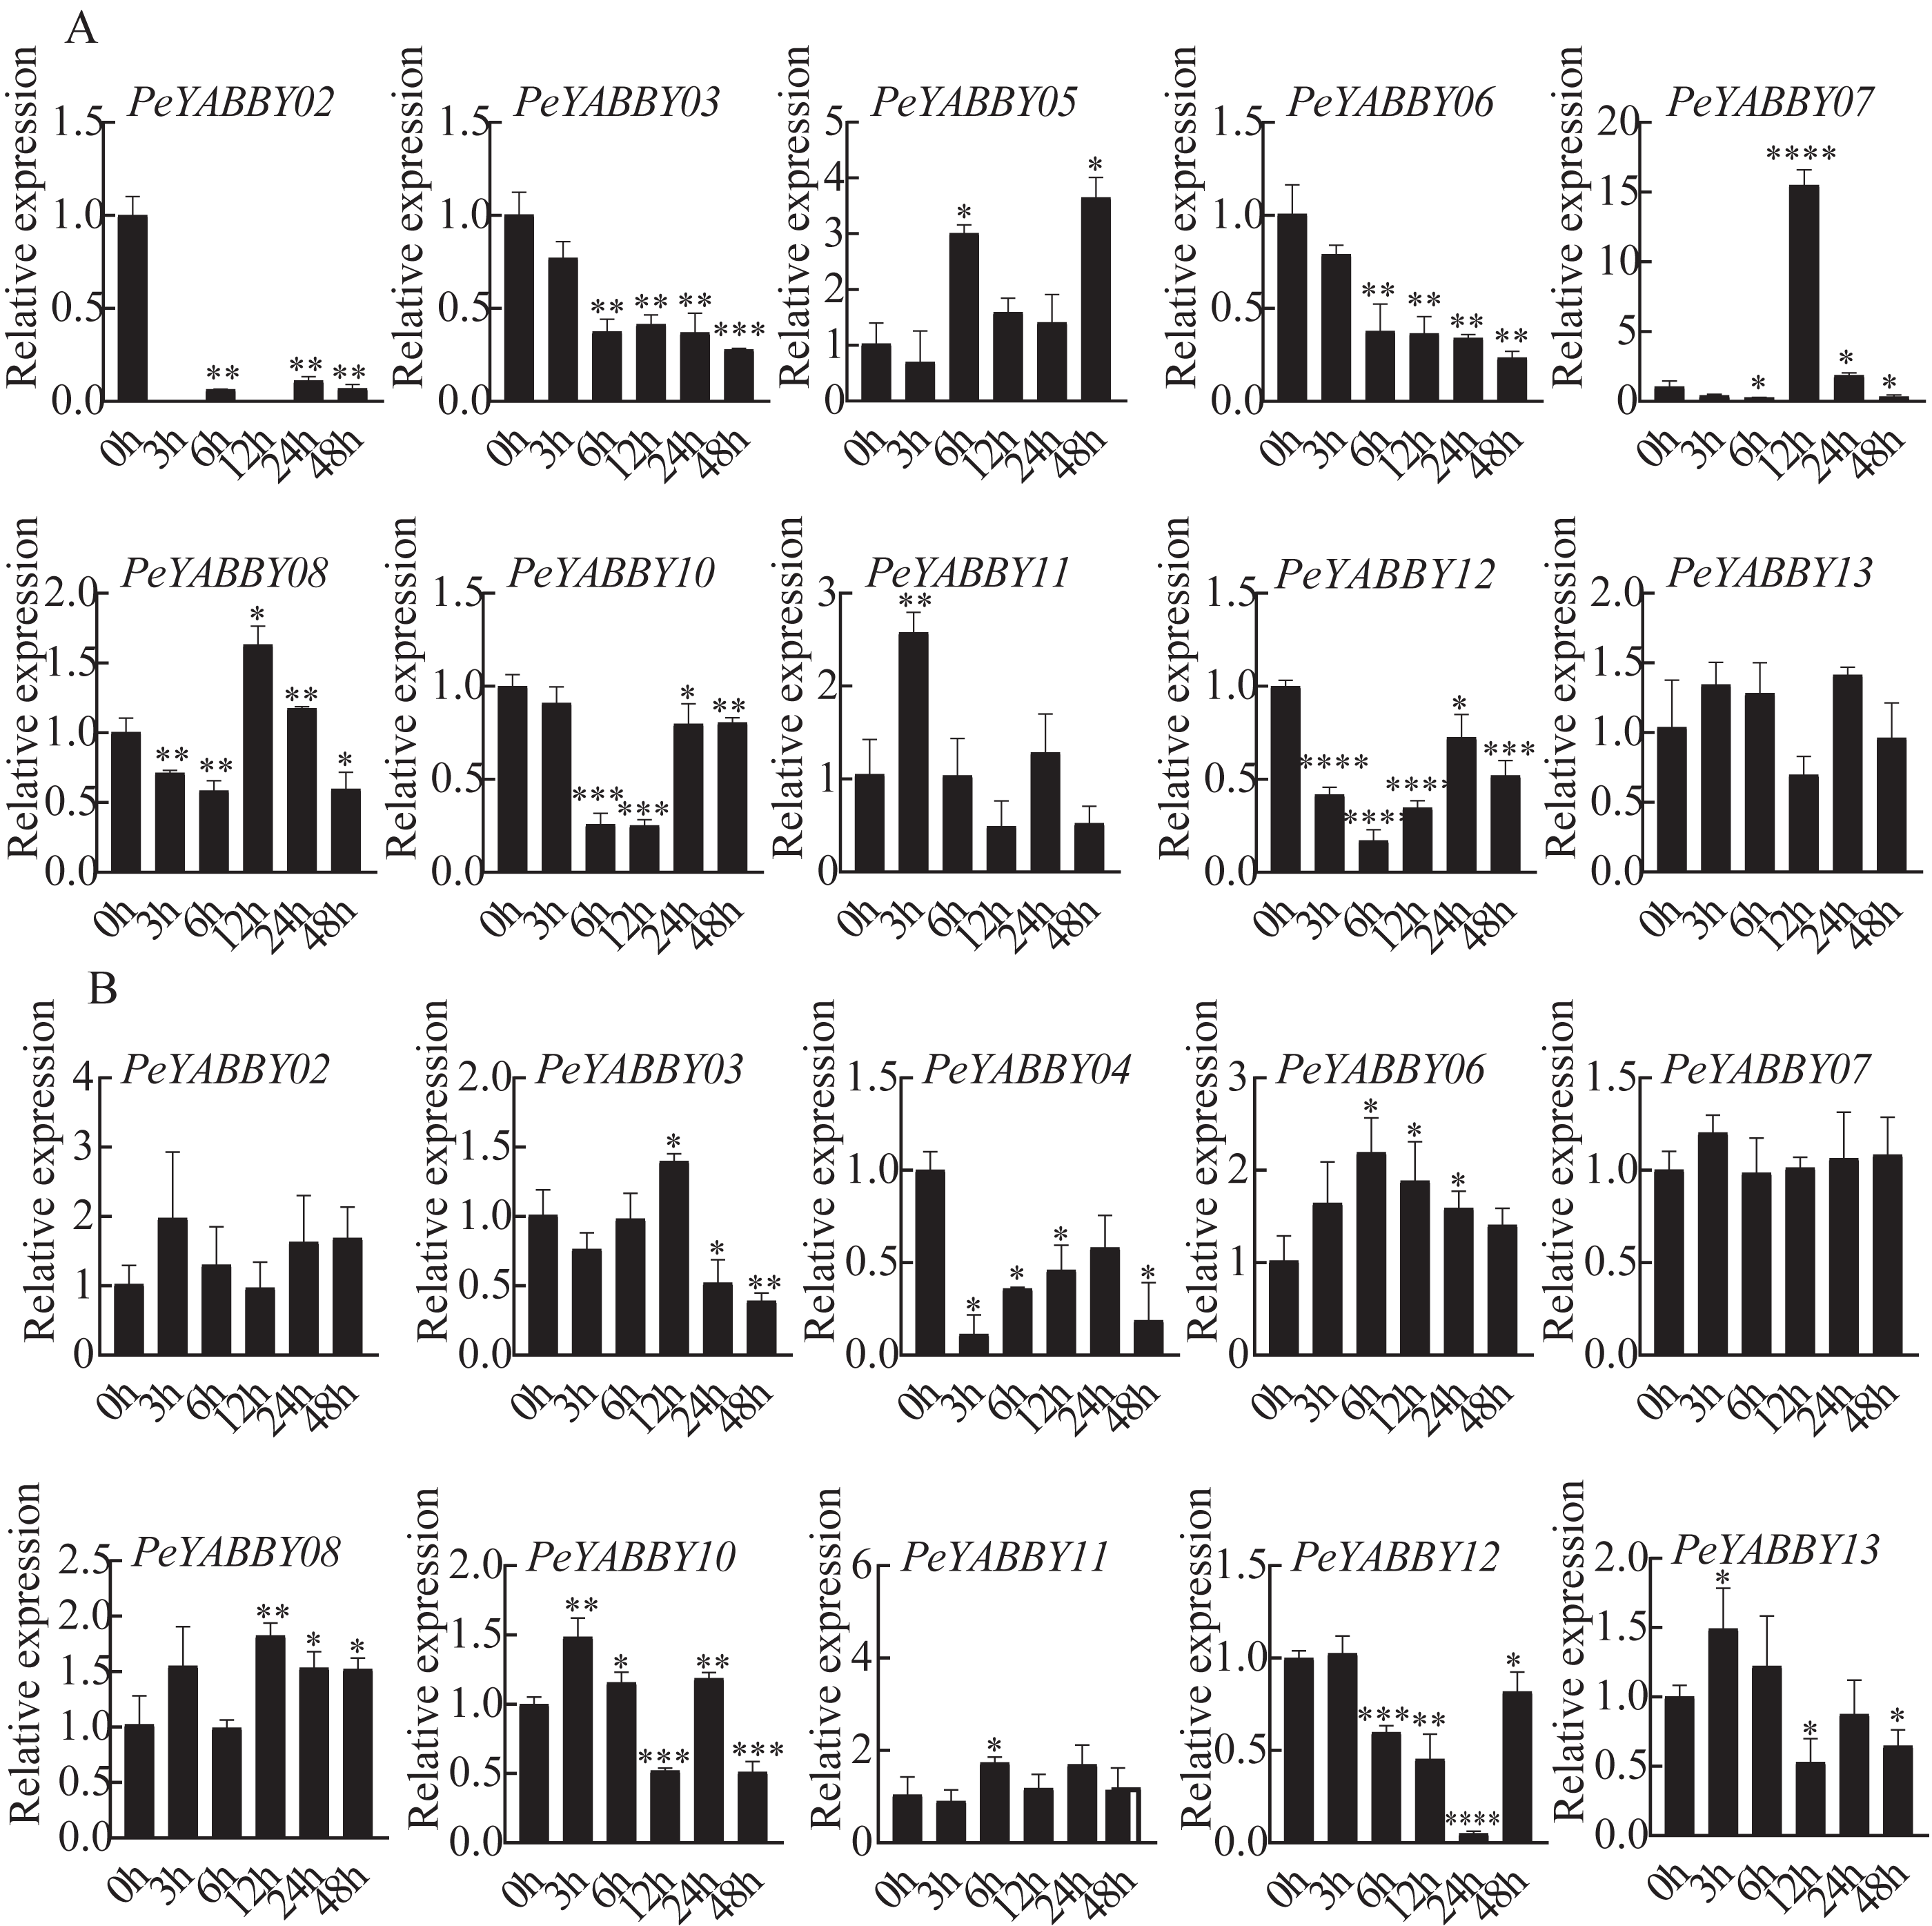
Protein interaction network and GO Enrichment
The STRING database was used to construct a network of protein relationships in order to better understand the potential functions, signaling, and metabolic interactions of the YABBY proteins (The corresponding gene IDs can be found in Table S5). FIL/YABBY2 and AS2/YABBY5 were predicted to regulate the initiation of embryonic shoot apical meristem (SAM) development. CRC/KAN and KAN2 were predicted to coordinate the regulation of carpel development. In addition, CRC was predicted to interact with other unspecified proteins to regulate leaf polarity and the formation of floral organs (Fig. 11).
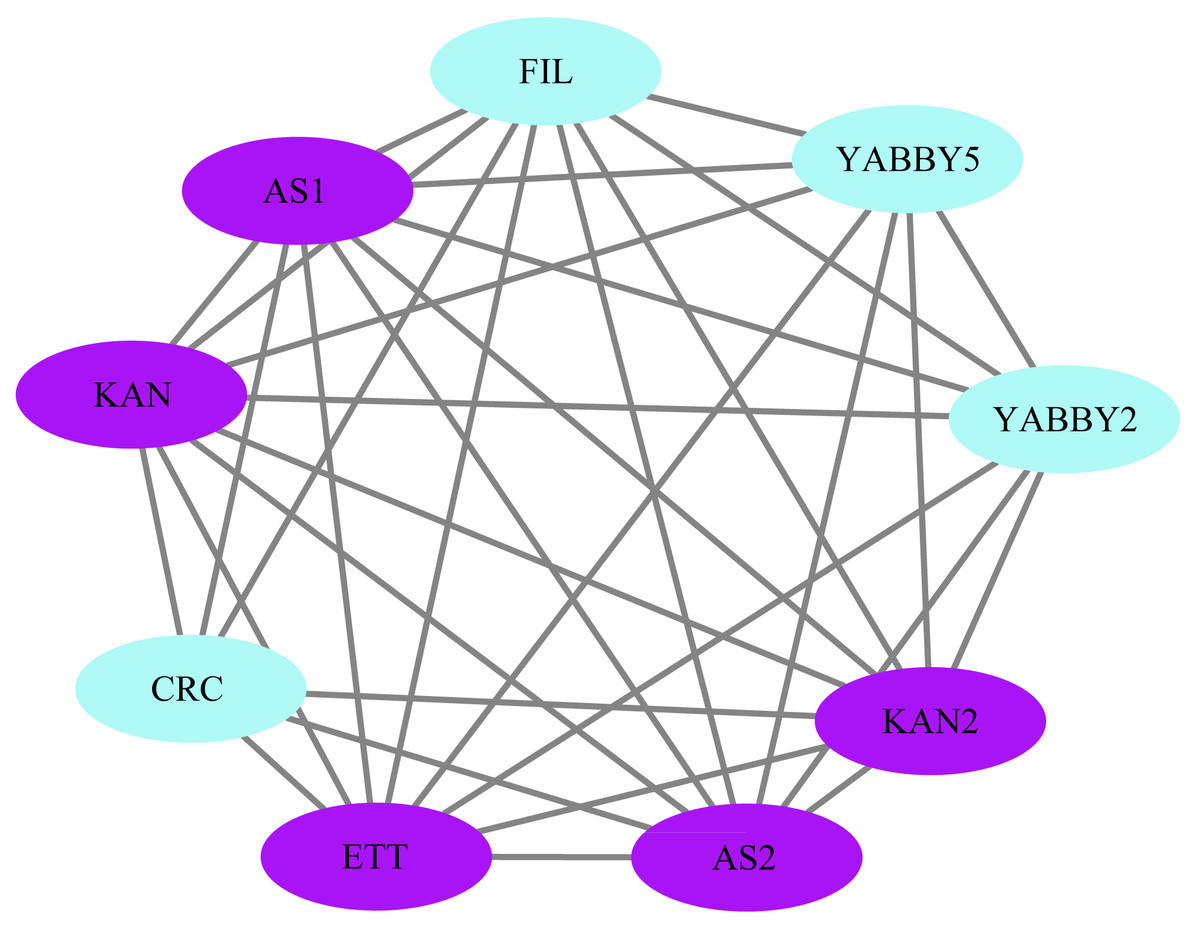
Figure 11: Analysis of protein interaction networks.
Using the STRING online database, YABBY genes were selected and used to construct a PPI network. Nodes represent proteins, while black lines indicate interactions between nodes.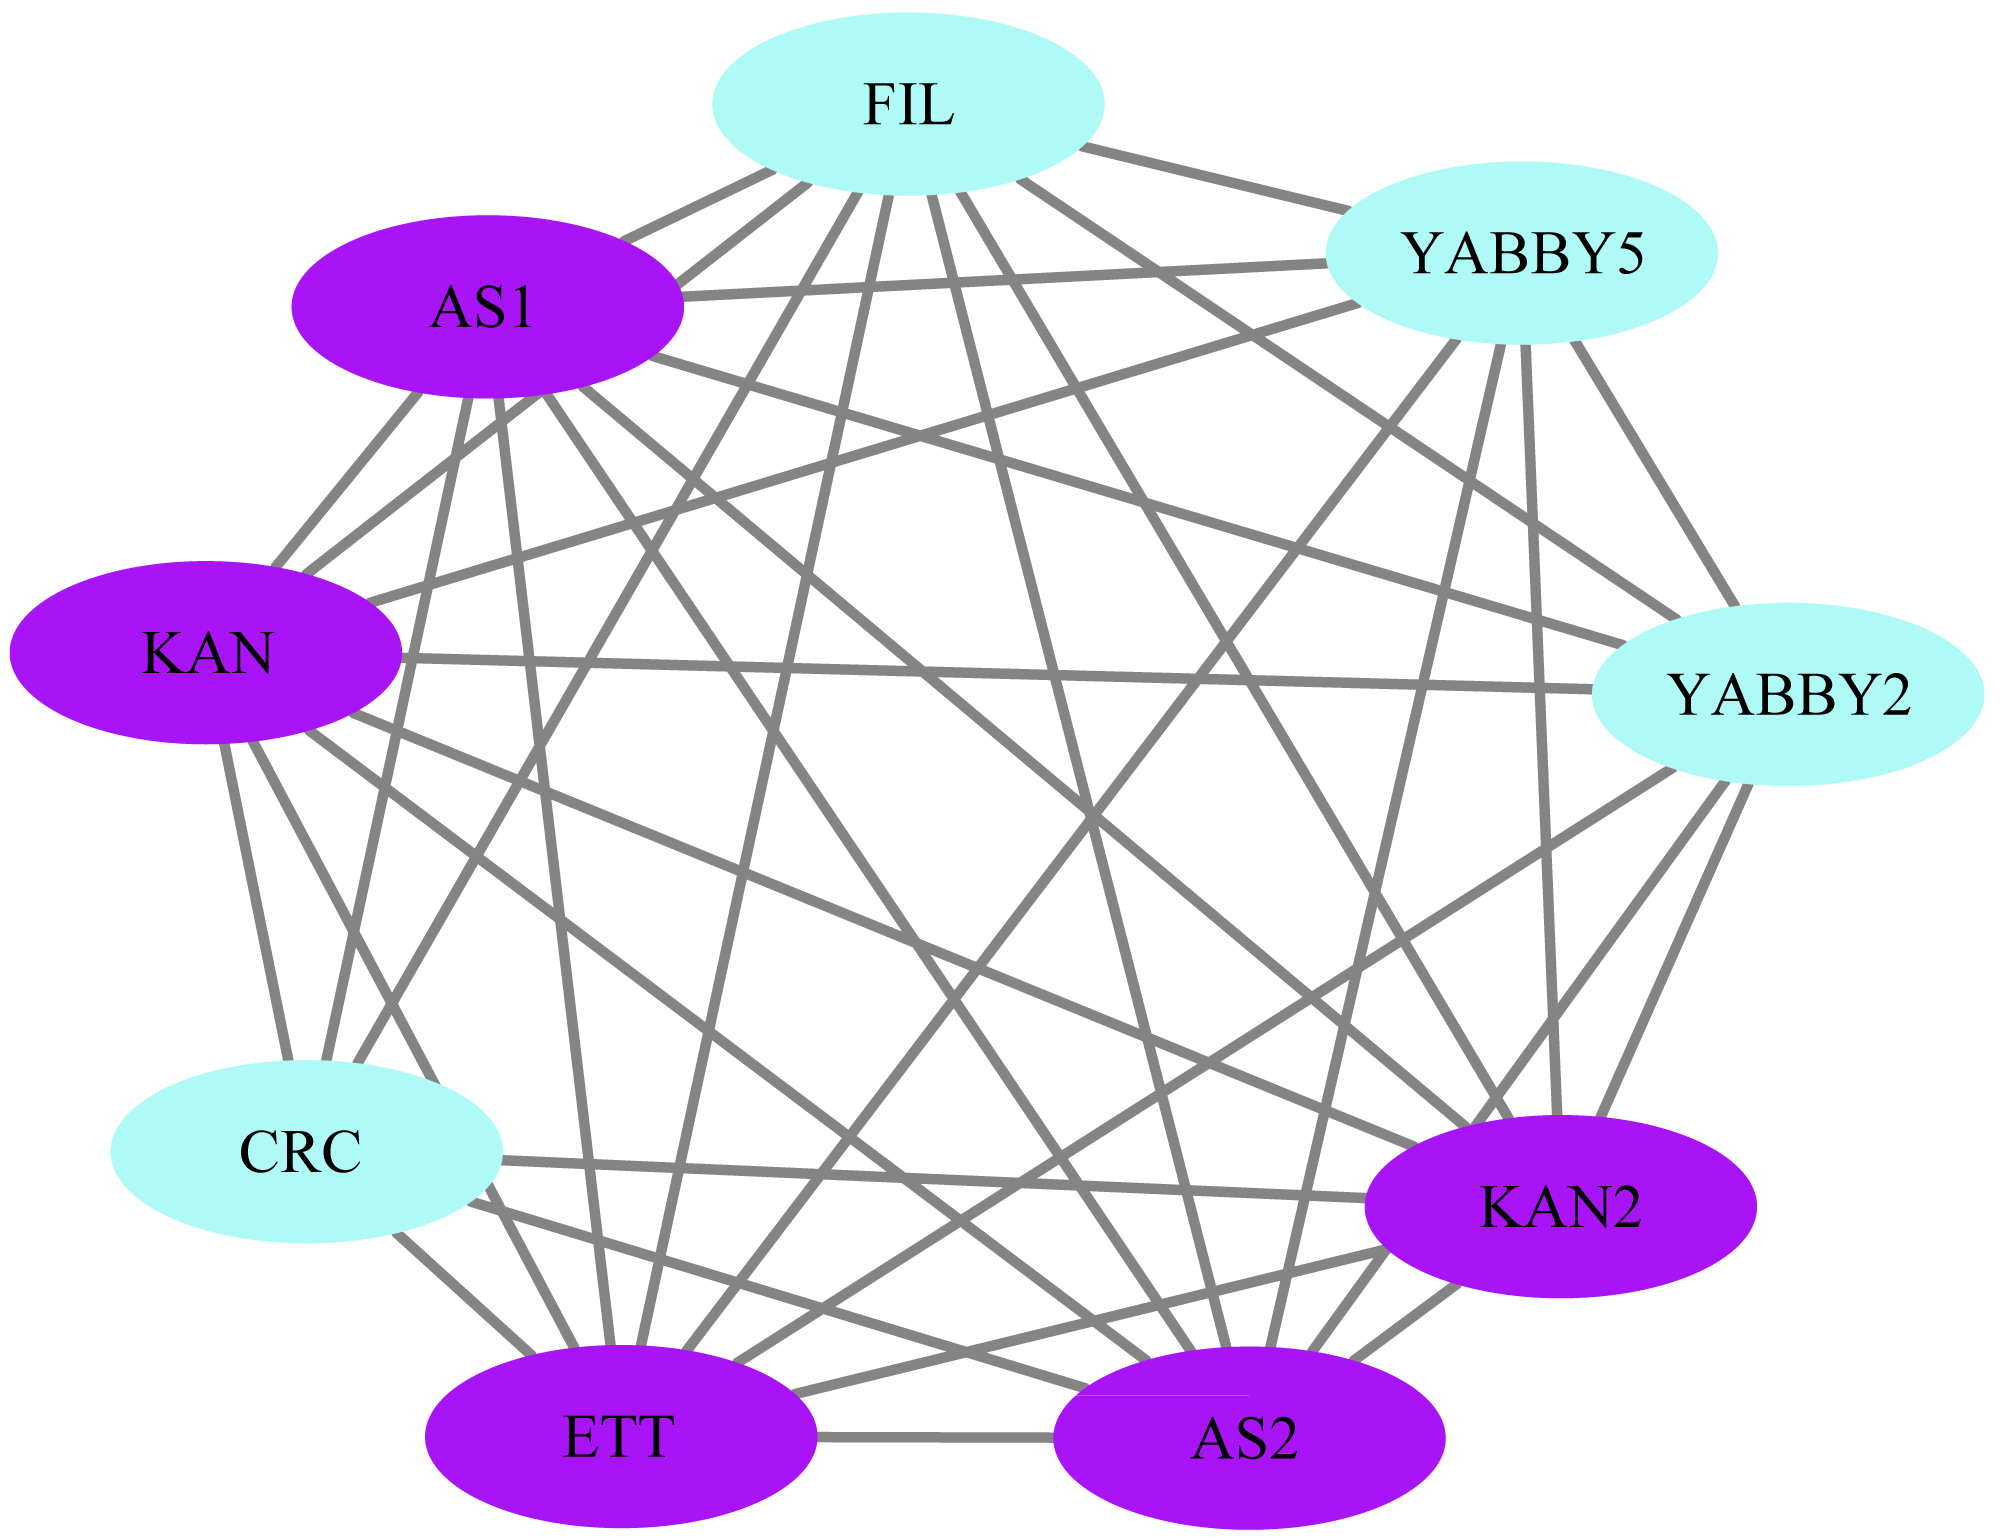
Transcription factors play a critical role in the growth and development of plants. In order to better understand what processes PeYABBY genes were involved in, we performed GO enrichment analysis (Fig. 12, Table S6). In total, 8 of the PeYABBY genes were involved in abaxial cell fate specification (GO: 0010158), 10 PeYABBY genes regulated anatomical structure development (GO: 0048856), and 14 PeYABBY genes were involved in multicellular biological processes (GO: 0032502). At the CC level, it could be seen that the PeYABBY family genes of Moso bamboo were mainly involved in forming the nucleus (GO: 0005634), and their molecular functions were mainly focused on binding metal and cations (GO: 0046872 and GO: 0043169).
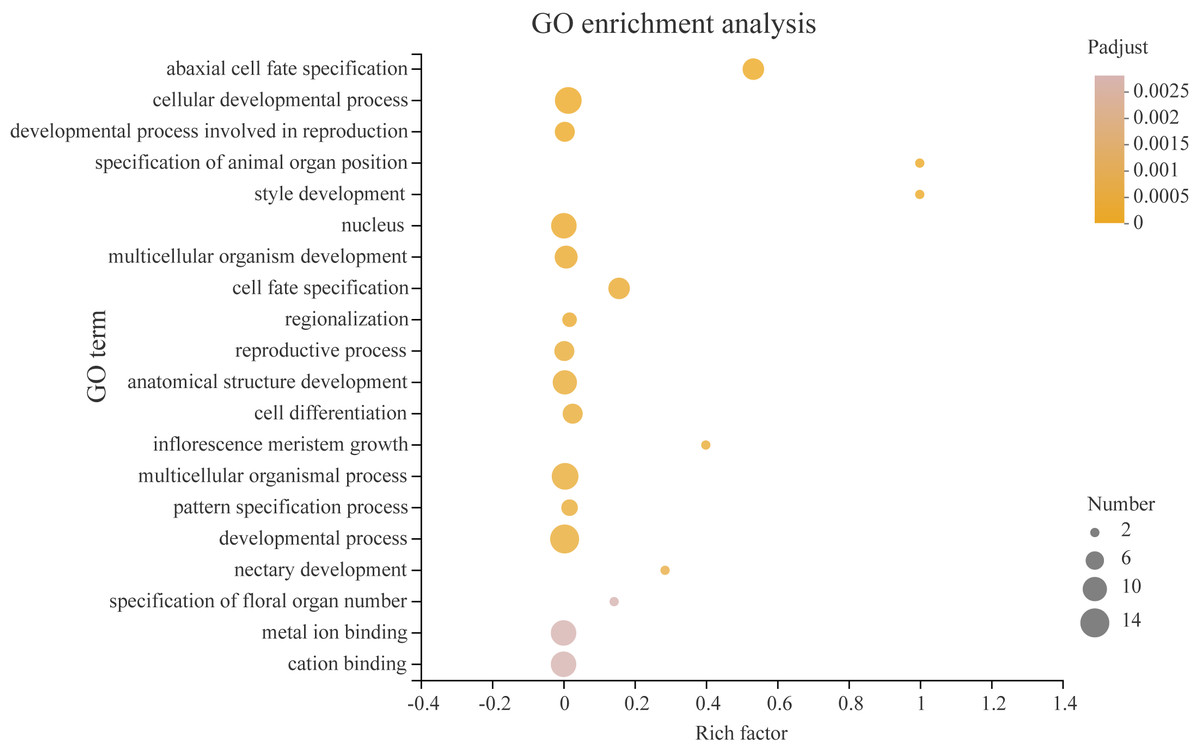
Figure 12: Gene ontology (GO) enrichment analysis.
Comparative analysis using the GO database. The horizontal axis indicates the enrichment factor, and the size of the circle indicates the number of genes annotated with a given GO term. Padjust less than 0.05 was considered to be significant enrichment. The analysis results show the top 20 significantly enriched information for functional annotations.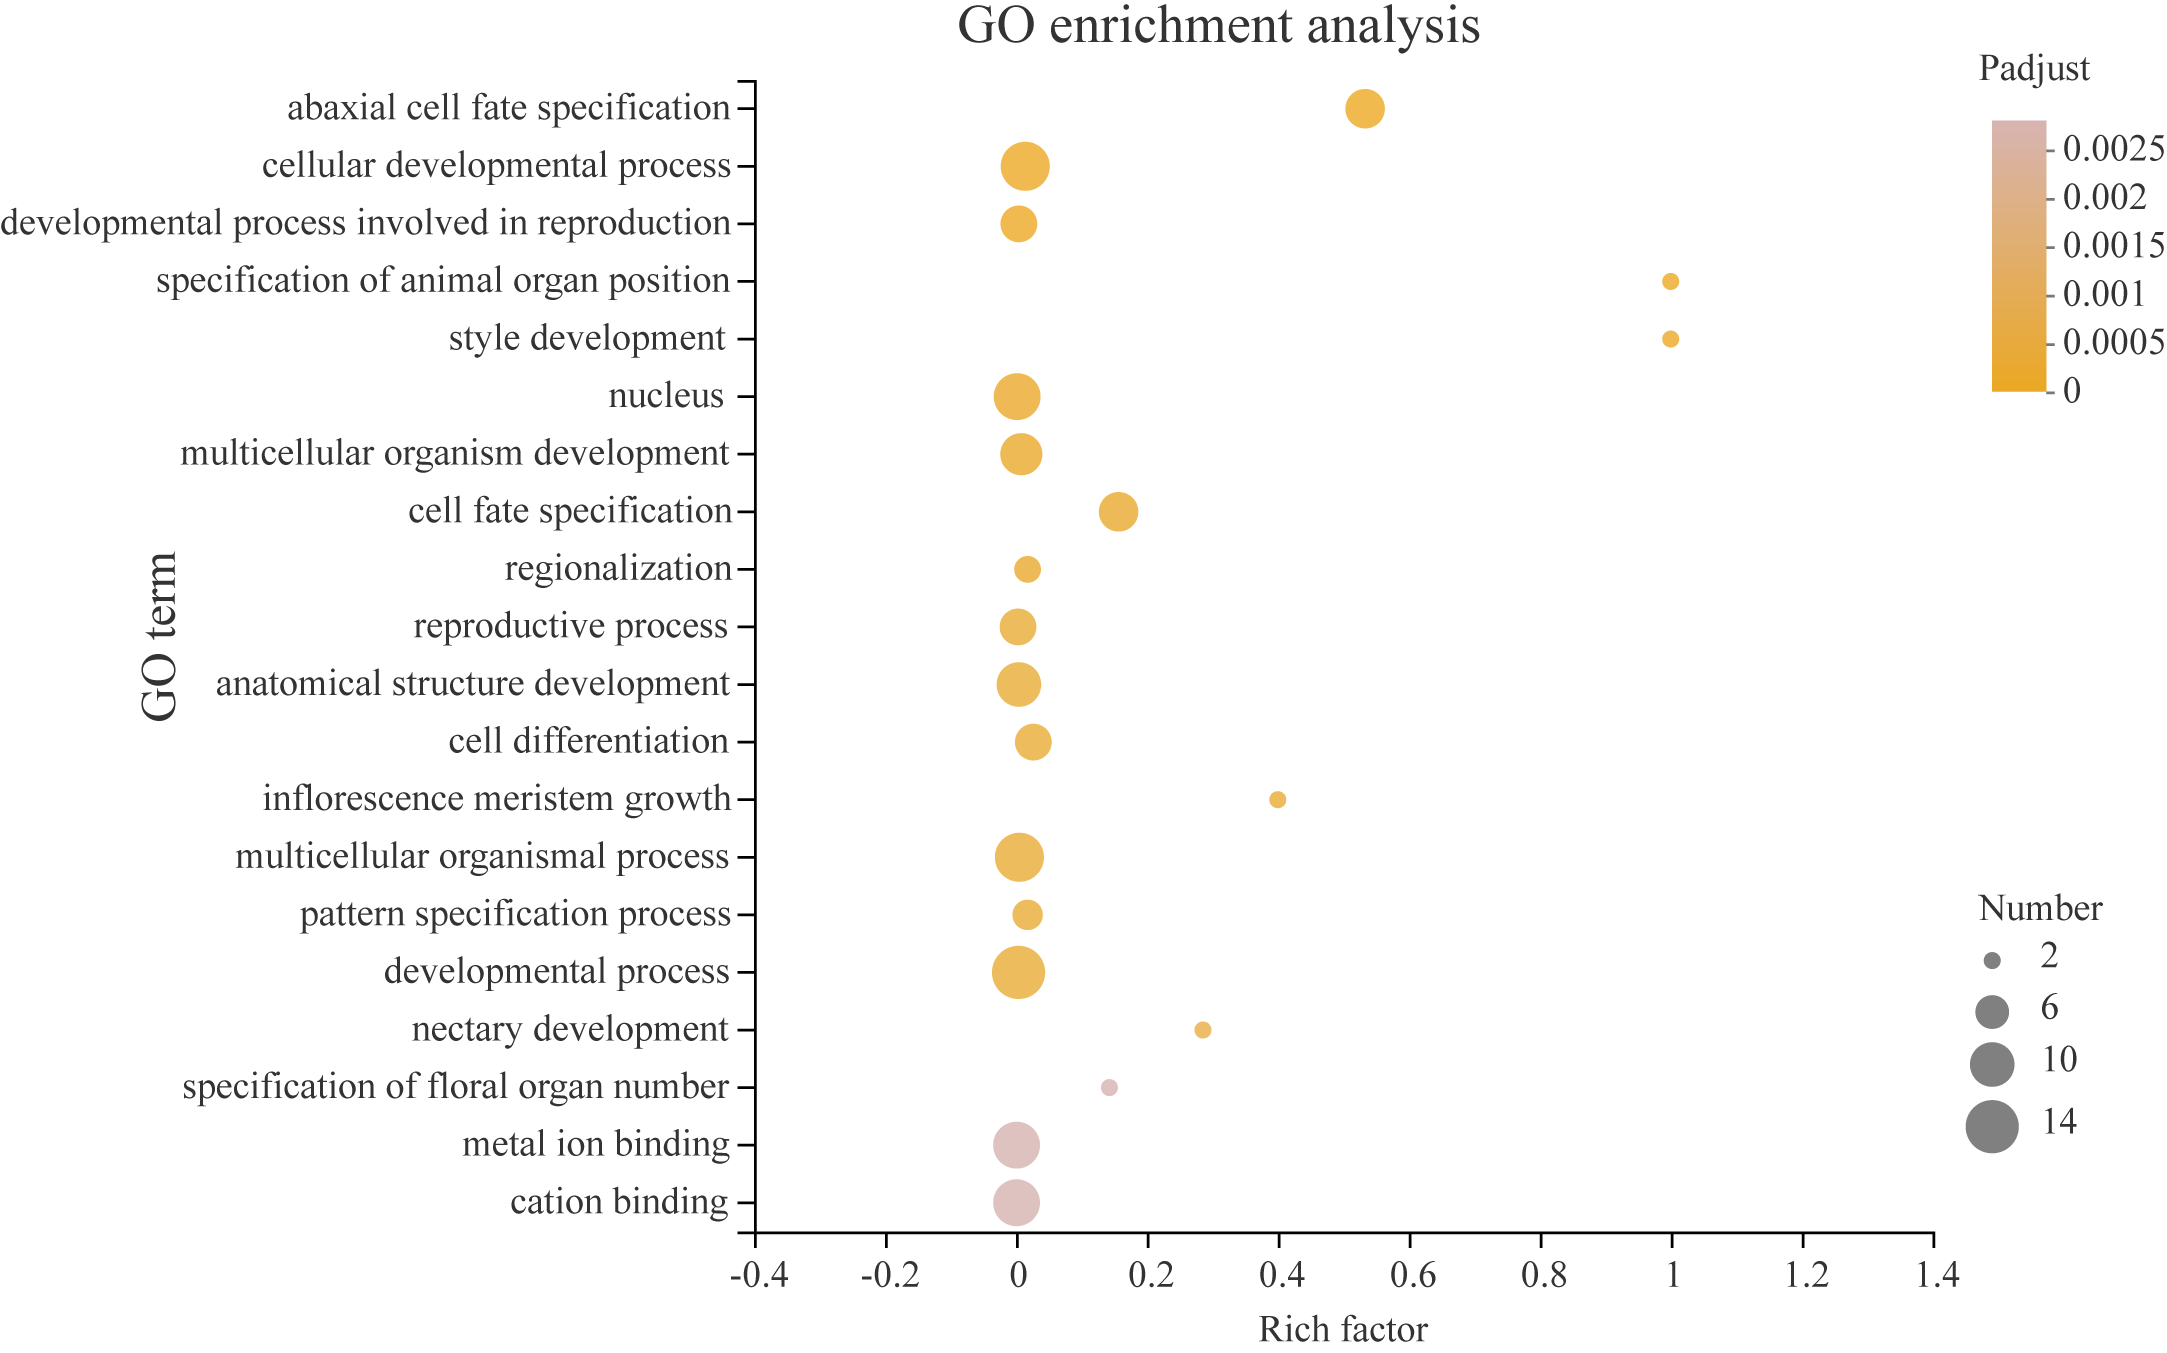
Homologous modeling of protein structures of PeYABBYgenes
The secondary structure of the YABBY family of proteins in Moso bamboo consists mainly of irregular coiling, while α-helix, extended chain (Ee), and β-turn angle are scattered throughout the protein. Tertiary structure analysis revealed that the subfamily members were similar in structure, with two α-helices and one loop (See the S3.Fig). There were also differences in the structure of different subfamily genes. For example, PeYABBY05 had a β-fold structure, while the structure of PeYABBY11 consisted mainly of three α-helices. (Fig. 13).
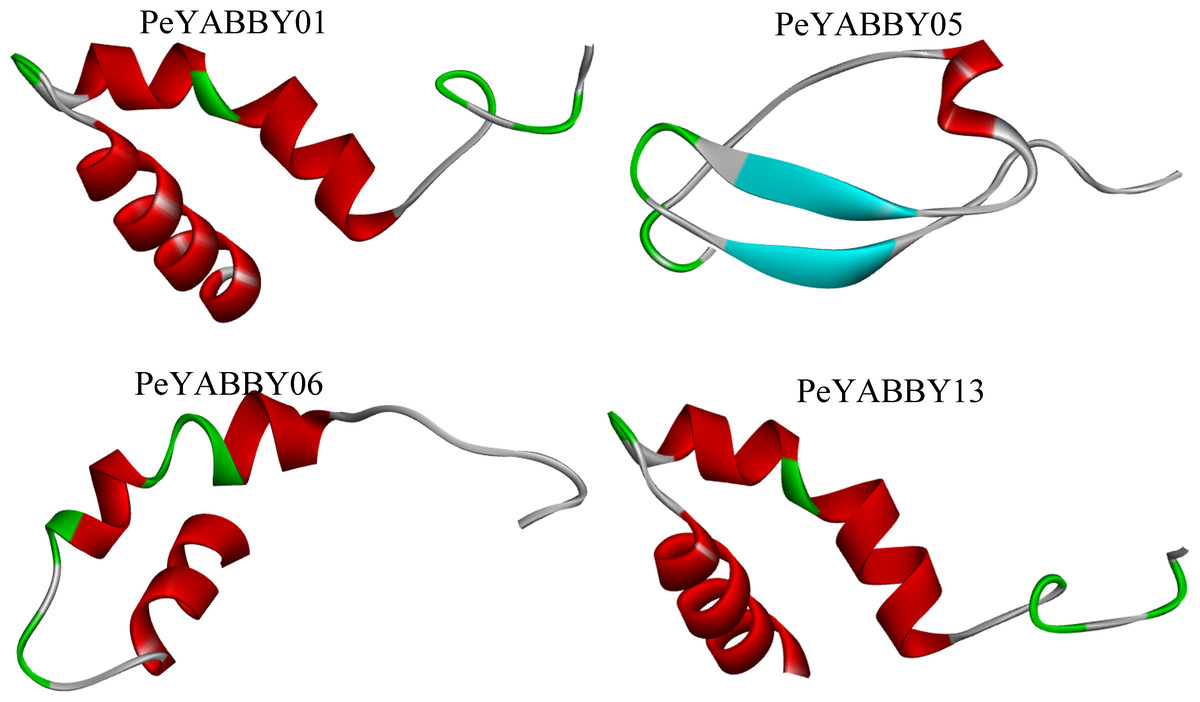
Figure 13: Tertiary structure analysis of YABBY proteins.
The diagram shows the tertiary structure of four YABBY proteins from four subfamilies. The protein of PeYABBY01 belongs to the YAB3 subfamily, while the protein of PeYABBY05 belongs to the INO subfamily, PeYABBY06 belongs to the YAB2-I subfamily, and PeYABBY11 belongs to the CRC subfamily.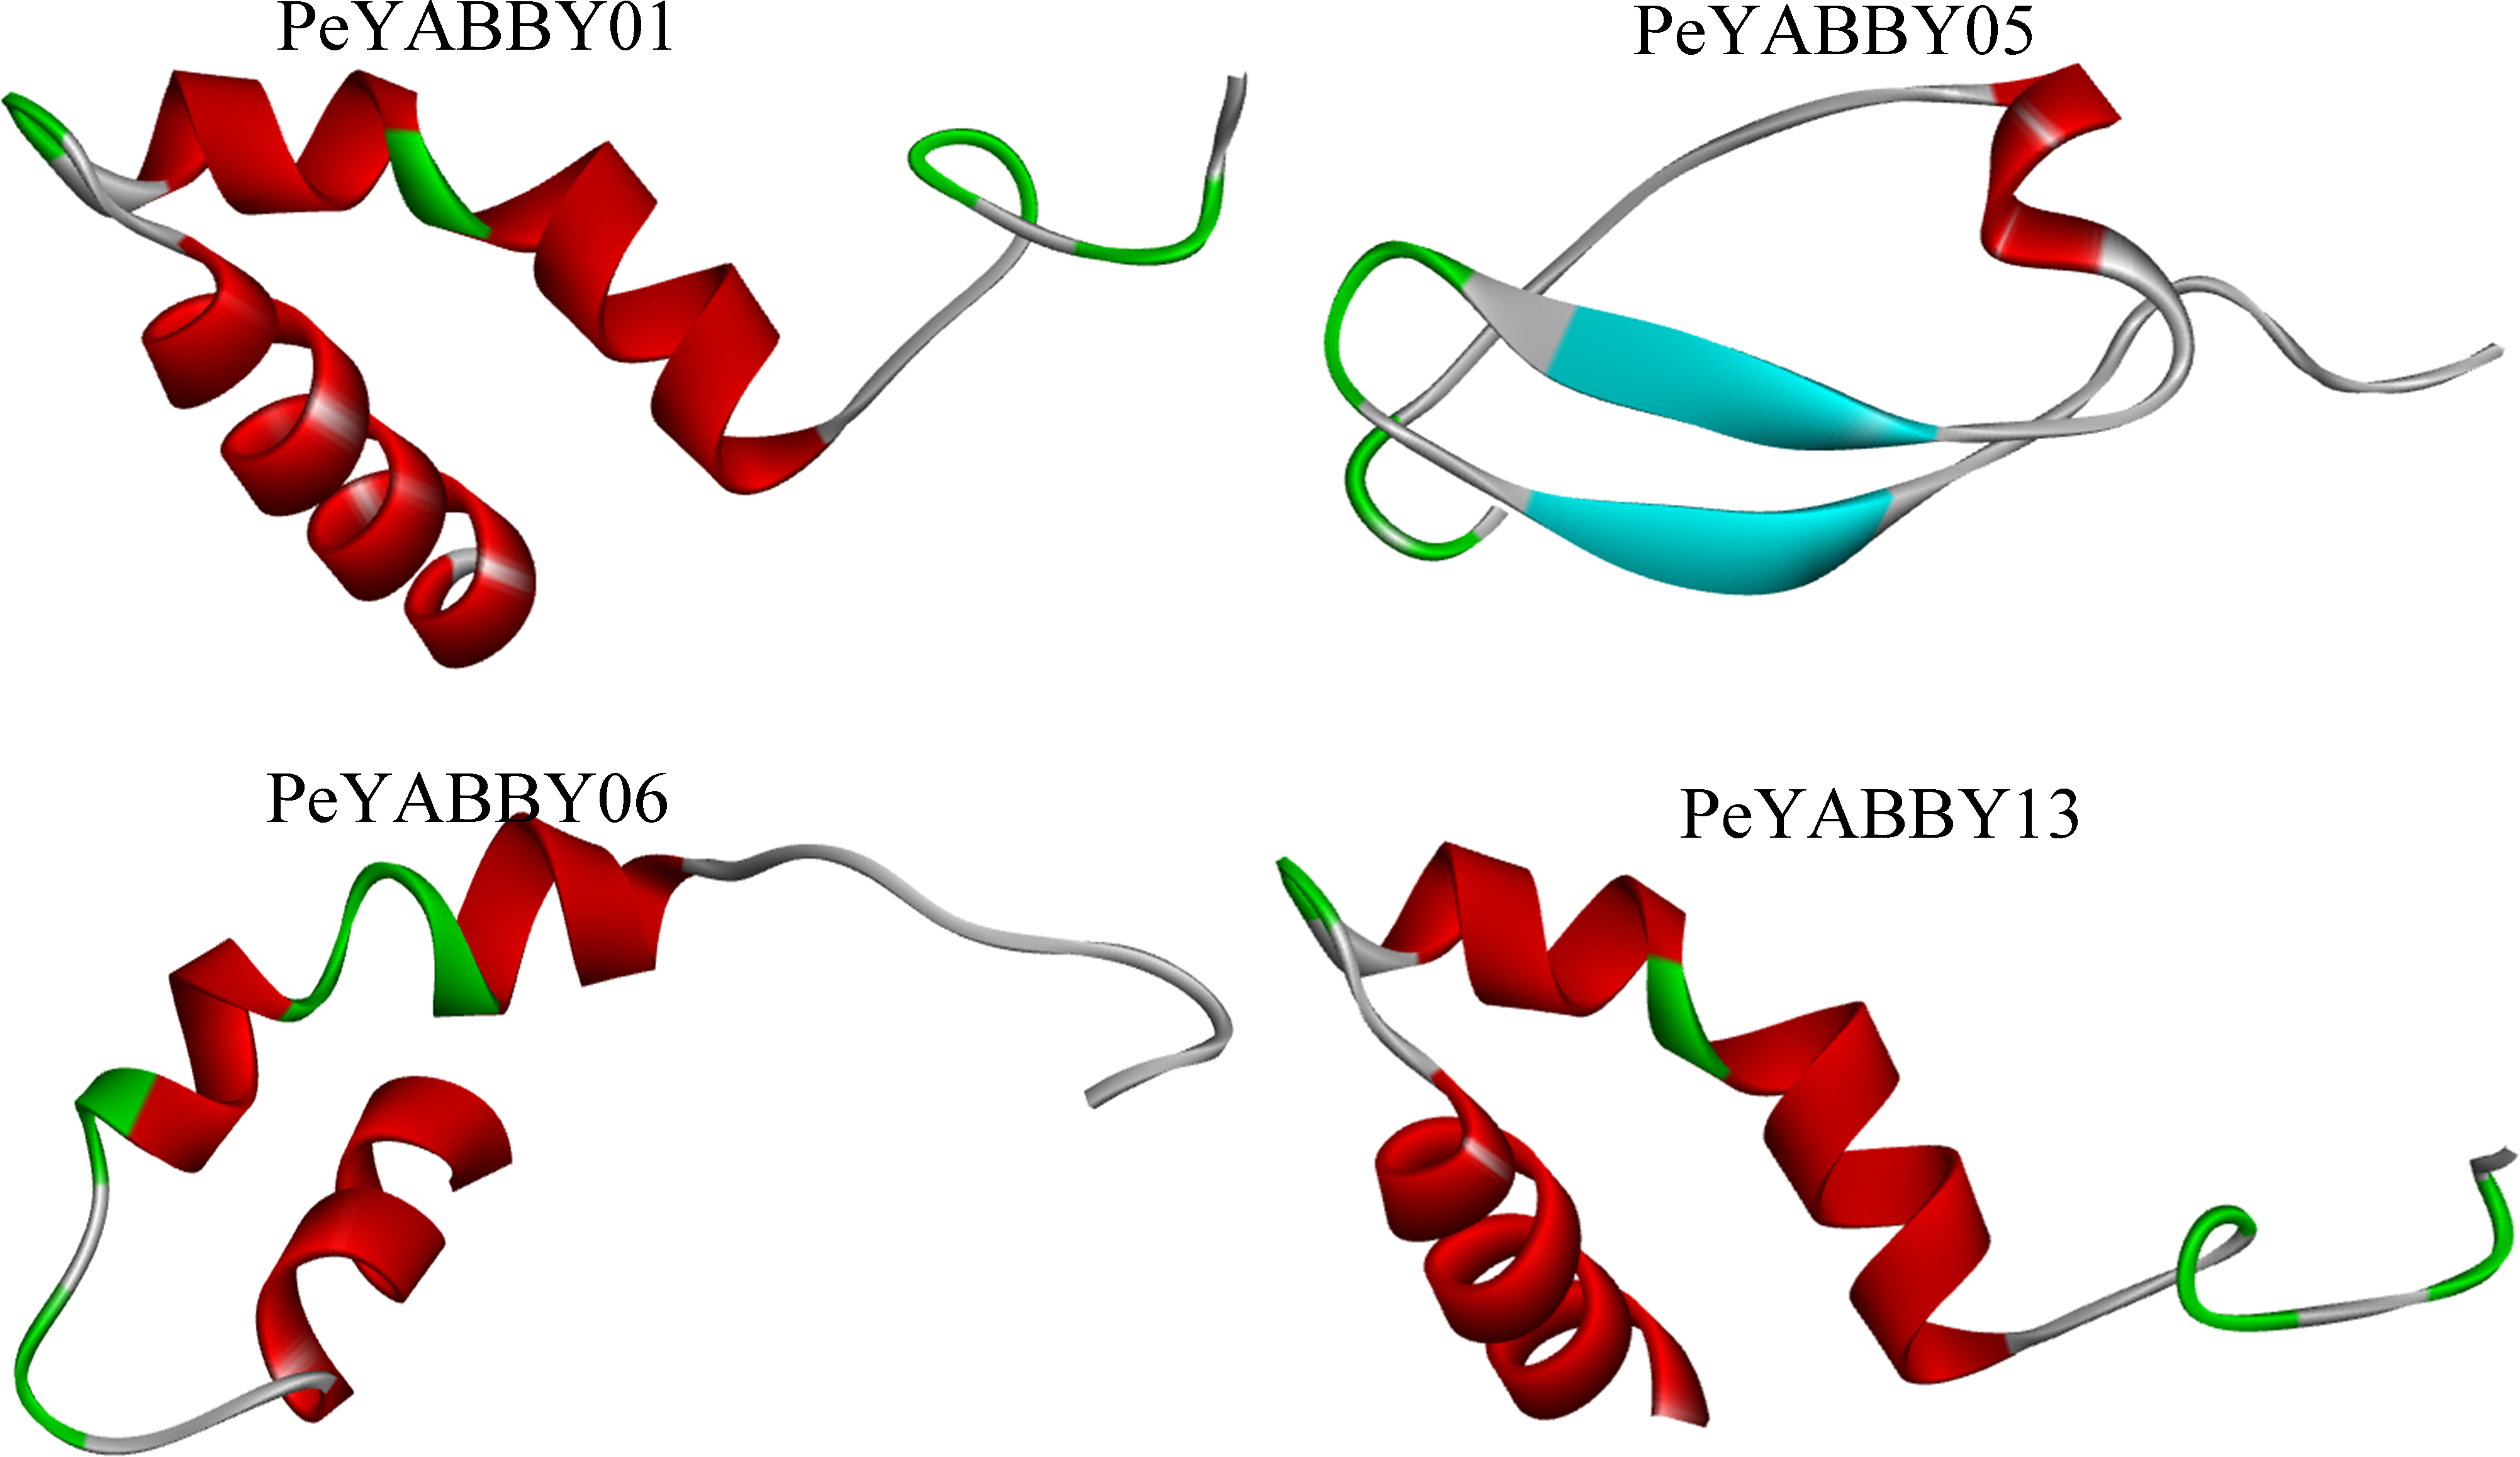
Discussion
The YABBY family of genes, with typical zinc finger and YABBY conserved domains, is a plant-specific transcription factor involved in the growth and development of flowers, seeds, leaves, and buds (Shamimuzzaman & Vodkin, 2013; Bartholmes, Hidalgo & Gleissberg, 2012; Cong, Barrero & Tanksley, 2008; Alvarez & Smyth, 1999). In addition, it was shown that YABBY was bifunctional transcription factor as a repressor or activator (Stahle et al., 2009). MSYABBY5 negatively regulates triticale biosynthetic processes and activates MSWRKY75 in spearmint (Wang et al., 2016). The number of YABBY genes varies among species, with six members present in A. thaliana (Finet et al., 2016; Villanueva et al., 1999), eight YABBY genes identified in rice (Eckardt, 2010; Toriba et al., 2007), seven in grapes, seventeen in soybeans (Glycine max) and nine in pineapple (Ananas comosus L.) (Zhang et al., 2019; Zhao et al., 2017b; Li et al., 2019). Despite their importance in growth and development, there has been no report examining the YABBY gene family in P. edulis. In this study, we conducted a comprehensive analysis of the YABBY genes of P. edulis, leading to a deeper understanding of their functional characteristics.
Identification and classification of YABBY gene families in P. edulis
We identified 16 YABBY genes in Moso bamboo, which encoded proteins ranging from 80 to 300 aa. In order to determine the phylogenetic relationship between YABBY proteins and other species, a phylogenetic tree was constructed, which revealed that no YABBY proteins were found belonging to the YAB5 subfamily, but PeYABBY genes belonging to four subfamilies were found, including YAB3, YAB2, CRC, and INO. The monocotyledonous plant species pineapple has also been reported to not contain YAB5-like genes (Li et al., 2019). These genes were all similar in structural composition, indicating that the genetic structure of the YABBY subfamily was highly conserved. The different subfamilies of YABBY have been proposed to play different roles in plant growth and development. FIL, YAB2, and YAB3 are all expressed in aboveground lateral organ primordia and specifically determine the fate of stem cells at the distal end of lateral organs. FIL, YAB3, and YAB5 show functional redundancy during Arabidopsis leaf development and are mainly expressed in nutrient storage tissues (Stahle et al., 2009; Sarojam et al., 2010; Eckardt, 2010), while CRC and INO are specifically expressed in floral organs (Eckardt, 2010). CRC genes mainly regulate the development of carpels and nectaries in Arabidopsis (Bowman et al., 1999; Fourquin et al., 2007), and INO genes play an important function during outer integument development in Arabidopsis (Yang et al., 2018).
The YABBY gene family expanded and evolved
In plant growth processes, gene duplication plays an important role, YABBY genes may have undergone functional divergence after duplication, and some may have lost their original function, acquired new function, or retained the original functional delineation (Wang et al., 2014; Xu et al., 2012; Zhao et al., 2017a). In the PeYABBY gene family, there were no tandem gene duplications, but seven gene pairs generated via segmental duplications were found. Gene duplication is thought to be a significant contributor to the evolutionary process, and these duplications may have allowed for an expansion of YABBY gene function in plants (Huang et al., 2013). Additionally, multiple homologous pairs of genes were identified between Moso bamboo and O. sativa, suggesting that YABBY genes in these two species originated from the same ancestral genes that had differentiated prior to species divergence. However, no gene duplication was found in Moso bamboo and Arabidopsis, likely because of the relatively large evolutionary distance between monocotyledons and dicotyledons. The evolutionary tree showed that the YABBY genes of Moso bamboo and the YABBY genes of O. sativa were clustered in one branch, again indicating that these species shared a common ancestor which had a similar complement of YABBY genes (Wu et al., 2014).
Ka/Ks ratios can be used to assess whether protein-coding genes have undergone positive selection (Ka/Ks ratio >1), neutral selection (ratio = 1), or purifying selection (ratio <1) (Hurst, 2002). Our analysis showed that the Ka/Ks ratios of the YABBY homologous pairs were less than 1, indicating that purifying selection was primarily impetus for YABBY family during evolution (Yang et al., 2018). The dates of segmental duplication events (9.17–77.84 Mya) indicated that segmental duplication of the PeYABBY genes has occurred after the differentiation of monocot-dicot split, and which were observed at 170–235 Mya (Inal et al., 2017; Gupta et al., 2015).
Functional analysis of the YABBY gene family
Under both biotic and abiotic stresses, cis-acting regulatory elements act as molecular switches that are closely related to the regulation of gene expression (Tian et al., 2019). In the YABBY gene family, we found a large variety of cis-acting elements, many of which were associated with responses to GA and ABA hormones. Each gene contained hormone-responsive elements, in which PeYABBY02, PeYABBY05, and PeYABBY06 contained more GA hormone-responsive elements. The PeYABBY genes showed significant differences in gene expression patterns when treated with ABA or GA hormone. Furthermore, the PeYABBY genes (PeYABBY07, PeYABBY08, PeYABBY10, PeYABBY12, PeYABBY03 and PeYABBY06) that was responsive to GA was found to be a close homolog of OsYABBY1, which has previously been implicated in the feedback regulation of GA metabolism in O. sativa (Toriba et al., 2007; Dai et al., 2007b). In total, ten PeYABBY genes responded to GA/ABA hormone treatment, suggesting that this gene family plays an important role in hormone regulation.
YABBY genes have previously been proven to play an essential role in plant growth and organ development, with a particular enrichment for roles in the development of trophic organs (Kumaran, Bowman & Sundaresan, 2002; Ha, Jun & Fletcher, 2010; Soundararajan et al., 2019; Zhao et al., 2020). Heatmap expression analysis revealed that the PeYABBY genes were expressed at a lower level in the roots, PeYABBY06, PeYABBY10 and PeYABBY12 genes were expressed at high levels in leaves, rhizomes and panicles, which suggesting that these genes might be involved in different developmental processes, which was consistent with the study by Dai et al. (2007a).
The YABBY genes have tissue expression specificity, it was shown that two genome members, CRABS CLAW and INNER NO OUTER, were expressed only in the floral organs. In contrast, members of the FILAMENTOUS FLOWER, YABBY2, and YABBY5 genomes were also expressed in the leaves (Eckardt, 2010; Bartholmes, Hidalgo & Gleissberg, 2012). The rice OsYAB1 protein is highly homologous to YAB2 and YAB5 in Arabidopsis. These genes have flower-specific expression, and OsYAB1 has been shown to play an important role in the development of rice meristematic tissues, as well as the developmental processes of stamens and carpels (Jang et al., 2004). A TOB1 gene encoding the YABBY protein, which is closely related to Arabidopsis FIL in rice, is expressed in the lateral organ progenitor but is not detectable in meristematic tissues. Wang et al. (2009) also found that LiYAB1 was more strongly expressed in lily carpels and weakly expressed in leaves. The qRT-PCR expression data revealed that there were two genes (PeYABBY14, PeYABBY16) that were not expressed in the young leaves, while all eight PeYABBY genes were expressed in the stems. Therefore, analysis of the expression patterns of these PeYABBY genes indicated that many had tissue-specific expression patterns.
GO (Gene Ontology) analysis of YABBY proteins showed that they were involved in numerous developmental processes and show a resistance to environmental stress (Buttar et al., 2020). Kelley, Skinner & Gasser (2009) reviewed that two major polarity determinants were the KANADI and YABBY gene families, that the KANADI and YABBY gene families are two major polarity determineors, which are thought to be involved in integument development. Two KAN members (KAN1 and KAN2) of KANADI were found to be involved in the development of the outer integument together with the YABBY gene family member INO and were essential regulators of lamellar extension of the outer tegument (Simon et al., 2012). The PPI network prediction revealed that YABBY interacted with KANADI family proteins to co-regulate plant growth and development. Moreover, Boter et al. (2015) has been shown that YABBY interacts with transcriptional repressors (JASMONATE-ZIM DOMAIN [JAZ] proteins) through its N-terminal domain and is involved in the regulation of jasmonate (JA)-related pathways. After JA triggering, the SCF receptor complex (SCFCOI1) degrades JAZ3 and releases YABs, which activate a subset of JA-regulated genes in leaves, leading to anthocyanin accumulation, chlorophyll loss, and reduced bacterial defense (Boter et al., 2015).
An evolutionary theory of the YABBY gene in angiosperms has been reported. Bartholmes, Hidalgo & Gleissberg (2012) proposed that “trophic” YABBY (FIL/YAB3, YAB2 and YAB5) do not form monophyletic branches and that CRC and FIL evolved from a common ancestral gene of which is sister of INO gene. Tertiary homology modeling revealed that the INO subfamily was structurally specific and did not contain the helix-loop-helix structure, such as PeYABBY5 contained atypical structural β-folded lamellaes, which might be due to functional mutations that occurred during evolution.
Conclusions
In this study, 16 PeYABBY genes were identified and systematically analyzed. The results of the study showed that YABBY genes from Moso bamboo could be classified into three different subfamilies, which was different from the classification of other plants. Each sequence had unique sequence features beyond the conserved amino acid structural domain. Chromosomal/segmental duplication, tandem gene duplication, might contribute to the expansion of the YABBY gene family. Transcriptome expression files indicated that the YABBY gene family determined important functions in leaves and panicles of development and growth. And most of the genes could be responsive to hormone treatments. In conclusion, our data provide a basis for clarification of the function and evolution of the YABBY members of the Moso bamboo and provide fundamental information about the YABBY family in the Moso bamboo. And revealed the potential role of PeYABBYs in hormone response during the development of Phyllostachys edulis.
Supplemental Information
Raw data exported from the transcriptome database used for data analysis and to prepare the gene expression patterns shown in Fig. 5
raw data
Gene annotation file for rice
The data was downloaded from the rice database and used to construct a phylogenetic tree and to demonstrate interspecific colinearity.
Protein sequence files of rice
The data was downloaded from the rice database, and used to construct a phylogenetic tree.