
Effective ribosomal RNA depletion for single-cell total RNA-seq by scDASH
- Published
- Accepted
- Received
- Academic Editor
- Joseph Gillespie
- Subject Areas
- Bioengineering, Bioinformatics, Biotechnology, Genomics
- Keywords
- Single-cell transcriptomics, scRNA-seq, rRNA depletion, CRISPR
- Copyright
- © 2021 Loi et al.
- Licence
- This is an open access article distributed under the terms of the Creative Commons Attribution License, which permits using, remixing, and building upon the work non-commercially, as long as it is properly attributed. For attribution, the original author(s), title, publication source (PeerJ) and either DOI or URL of the article must be cited.
- Cite this article
- 2021. Effective ribosomal RNA depletion for single-cell total RNA-seq by scDASH. PeerJ 9:e10717 https://doi.org/10.7717/peerj.10717
Abstract
A decade since its invention, single-cell RNA sequencing (scRNA-seq) has become a mainstay technology for profiling transcriptional heterogeneity in individual cells. Yet, most existing scRNA-seq methods capture only polyadenylated mRNA to avoid the cost of sequencing non-messenger transcripts, such as ribosomal RNA (rRNA), that are usually not of-interest. Hence, there are not very many protocols that enable single-cell analysis of total RNA. We adapted a method called DASH (Depletion of Abundant Sequences by Hybridisation) to make it suitable for depleting rRNA sequences from single-cell total RNA-seq libraries. Our analyses show that our single-cell DASH (scDASH) method can effectively deplete rRNAs from sequencing libraries with minimal off-target non-specificity. Importantly, as a result of depleting the rRNA, the rest of the transcriptome is significantly enriched for detection.
Introduction
Since it was first demonstrated in 2009 (Tang et al., 2009), single-cell RNA sequencing (scRNA-seq) has evolved to become a highly accurate, sensitive, and comprehensive way to profile the whole transcriptome of individual cells, and thus capturing the cellular heterogeneity in a multitude of biological contexts. Many technological advances for this approach have emerged over the past decade (Wu et al., 2017), such as the recently published Smart-seq3 method that allows isoform reconstruction from short read sequencing while still being quantitative in its single-cell transcript counting (Hagemann-Jensen et al., 2020). However, there remain unaddressed challenges for this technology (Saliba et al., 2014). One specific problem is that the abundance of RNA species that are not of interest in total RNA-sequencing, such as ribosomal RNA (rRNA), can occupy too much sequencing capacity. This is particularly problematic in the context of scRNA-seq, since overly-abundant rRNA transcripts could crowd out other low abundance transcripts of interest, thereby compromising the sensitivity and accuracy of detection. Furthermore, this means that unnecessarily high depth and cost of sequencing are going towards uninformative reads. While strategies for depleting these abundant but unwanted RNA species have been developed for bulk RNA-seq applications (Herbert et al., 2018), they have not been adapted for routine use in single-cell applications due to technical difficulties. As such, a solution that is compatible with single-cell approaches is highly desired.
Ribosomal RNA accounts for 80–90% of the total RNA content in typical mammalian cells (Eun, 1996). Conventional methods for eliminating rRNA from total RNA samples include enrichment of polyadenylated (poly(A)) transcripts, and targeted depletion of rRNA. The former leverages the absence of a poly(A) tail on rRNA, allowing the isolation of poly(A) mRNA via oligo(dT) hybridisation. Due to its convenience and simplicity, poly(A) enrichment is adopted in most scRNA-seq methods nowadays including Smart-seq2/3 (Picelli et al., 2013; Hagemann-Jensen et al., 2020) and CEL-Seq2 (Hashimshony et al., 2016). However, this approach is liable to bias as it excludes a sizable fraction of the whole transcriptome beyond just rRNA. This leads to the loss of not only transcripts that are non-polyadenylated such as long non-coding RNA (lncRNA) and small regulatory non-coding RNAs but also mRNA with a degraded 3′ tail. The other approach, rRNA-specific depletion, is usually achieved by either rRNA pull-out using biotinylated sequence-specific probes (e.g., Illumina’s Ribo-Zero and Thermo Fisher’s RiboMinus) or RNase H-mediated degradation (e.g., NEB’s NEBNext). Although these targeted methods preserve the non-rRNA, non-polyadenylated fraction, their input requirement is 10 ng to 1 µg, which is orders of magnitude higher than the 10 to 30 pg total RNA content in a single cell, and thus precludes their use in scRNA-seq protocols. A more recently developed commercial rRNA depletion protocol, DSN-seq (Fang & Akinci-Tolun, 2016), attempts to circumvent this input requirement by placing the depletion step after cDNA synthesis and amplification. It leverages duplex-specific nuclease (DSN) to digest preferentially re-hybridised double-stranded rRNA after an initial denaturation step, but since many other transcript sequences could also form duplexes which then become susceptible to DSN action, this approach has undesirable off-target effects (Zhao et al., 2014).
With the goal of depleting rRNA from scRNA-seq libraries with minimal off-target effects, we adapted a protocol first developed by Gu et al. (2016) named Depletion of Abundant Sequences by Hybridisation (DASH). DASH uses the clustered regularly interspaced short palindromic repeats (CRISPR) technology: guided by a single-stranded RNA (sgRNA) with specificity against a 20-nt long genomic target, Streptococcus pyogenes CRISPR-associated nuclease 9 (SpCas9) induces a double strand break upon recognition of a trinucleotide of protospacer adjacent motif (PAM) site (5′ NGG 3′ for SpCas9) located immediately downstream of the target sequence. The CRISPR-Cas9 induced cleavage can easily be multiplexed by simply introducing multiple sgRNAs against different target sequences; thus, a library of sgRNAs that target the rRNA enables specific Cas9 digestion of rRNA fragments in the cDNA library, while leaving the rest of the transcriptome untouched. Subsequently, the uncleaved fragments are enriched by PCR through the adaptor sequences that were added during cDNA synthesis. Note that, using this strategy, the CRISPR-Cas9 induced cleavage of rRNA takes place after cDNA library synthesis and amplification, where the total amount of cDNA in the reaction is no longer single-cell level, thus the input requirement usually required by conventional pre-treatment strategies is circumvented by the DASH approach. With this method, the authors demonstrated a significant reduction in human mitochondrial rRNA reads, first as a proof of principle in an RNA-seq library of a cell line, then also in cerebrospinal fluid (CSF) samples taken from meningoencephalitis patients. DASH treatment of CSF samples successfully increased the detection sensitivity of reads from pathogen in a metagenomic dataset (Gu et al., 2016).
While Gu et al. only demonstrated the method in the context of mitochondrial rRNA, we further expand the applicability of DASH by designing and constructing a library of sgRNAs to deplete human cytoplasmic rRNAs from scRNA-seq libraries. According to HUGO Gene Nomenclature Committee (HGNC), human cytoplasmic rRNAs are categorised into three gene groups based on their sedimentation velocity and genomic localisation: 5S rRNAs, ribosomal 45S RNA clusters, and non-clustered ribosomal 45S RNA genes. The 45S rDNA that encode for the ribosomal 45S RNA clusters are made up of 30–40 tandem repeats, found at multiple loci on the p arms of five different chromosomes, that are transcribed as a single unit to produce the precursor rRNA that is then later processed to generate the 18S, 5.8S, and 28S rRNA (Agrawal & Ganley, 2018). Using the recently sequenced reference of the 45S rDNA on human chromosome 21 (GenBank accession KY962518.1) (Kim et al., 2018), we were able to design a library of sgRNA for our single cell DASH (scDASH) protocol to target cDNA fragments arising from the ribosomal 45S cluster for cleavage, thus depleting this highly abundant rRNA from sequencing libraries. For other rRNA types that have lower copy numbers in the genome, the number of sgRNA required and the associated costs would likely yield diminishing returns, though it is feasible to add additional sgRNA(s) to the scDASH protocol if the need arises.
We tested scDASH in a scRNA-seq protocol called MATQ-seq (Sheng et al., 2017). MATQ-seq uses a polyN priming strategy, which can catch all transcripts regardless of whether they have a poly(A) tail, thus capturing total RNA including rRNA in the resulting library. Therefore, we can use scDASH on MATQ-seq generated scRNA-seq libraries to assess the change in rRNA level before and after applying scDASH. Using this approach, we were able to effectively deplete the cytoplasmic rRNAs from as low as 1 ng input of pooled libraries, and this in turn results in the enrichment of informative RNA species (Fig. 1).
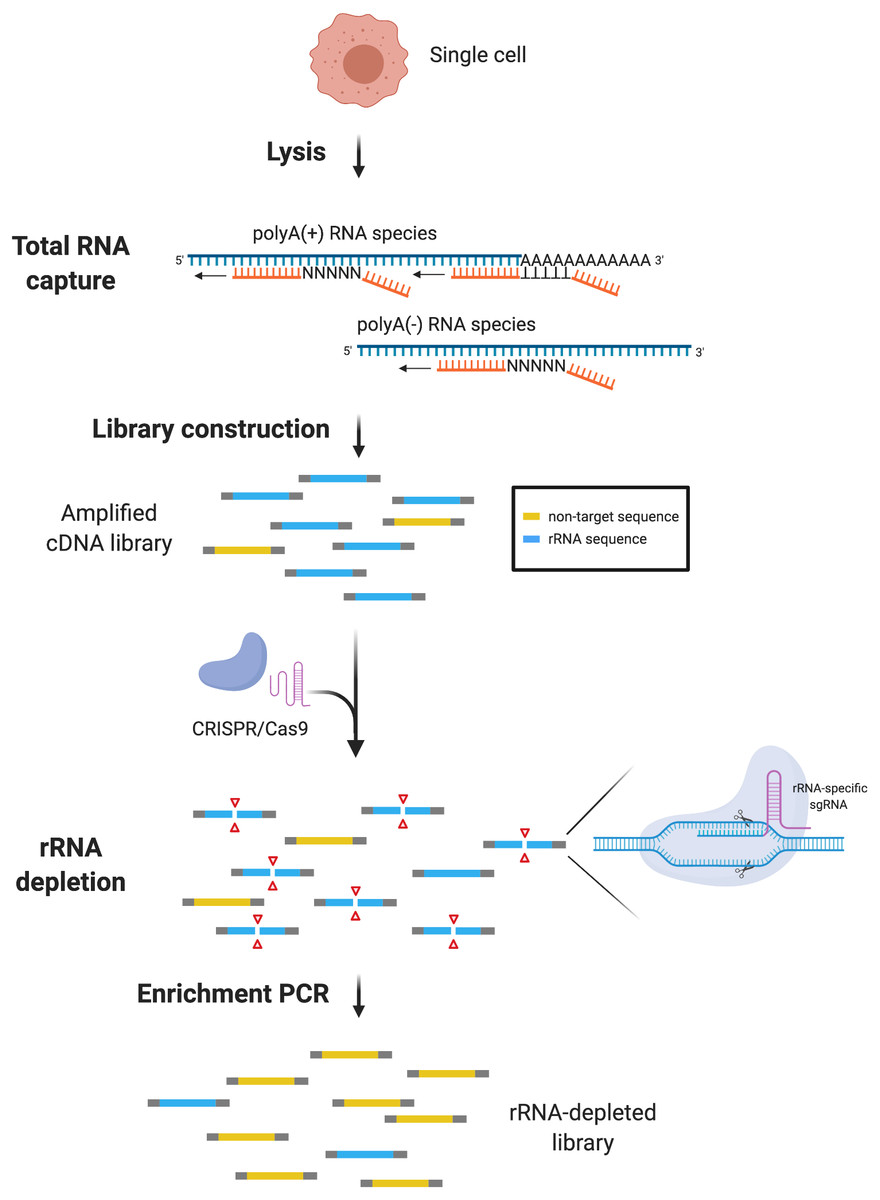
Figure 1: scDASH workflow.
Total RNA from single cells is reverse-transcribed by oligo(d)T and random priming alongside. scRNA-seq libraries are amplified, pooled and subjected to scDASH treatment. Only rRNA sequences (blue) are targeted by rRNA-specific sgRNAs and cleaved by Cas9. Non-target sequences (yellow) remain intact and therefore can be enriched by PCR subsequently. (Image was created with BioRender.com.)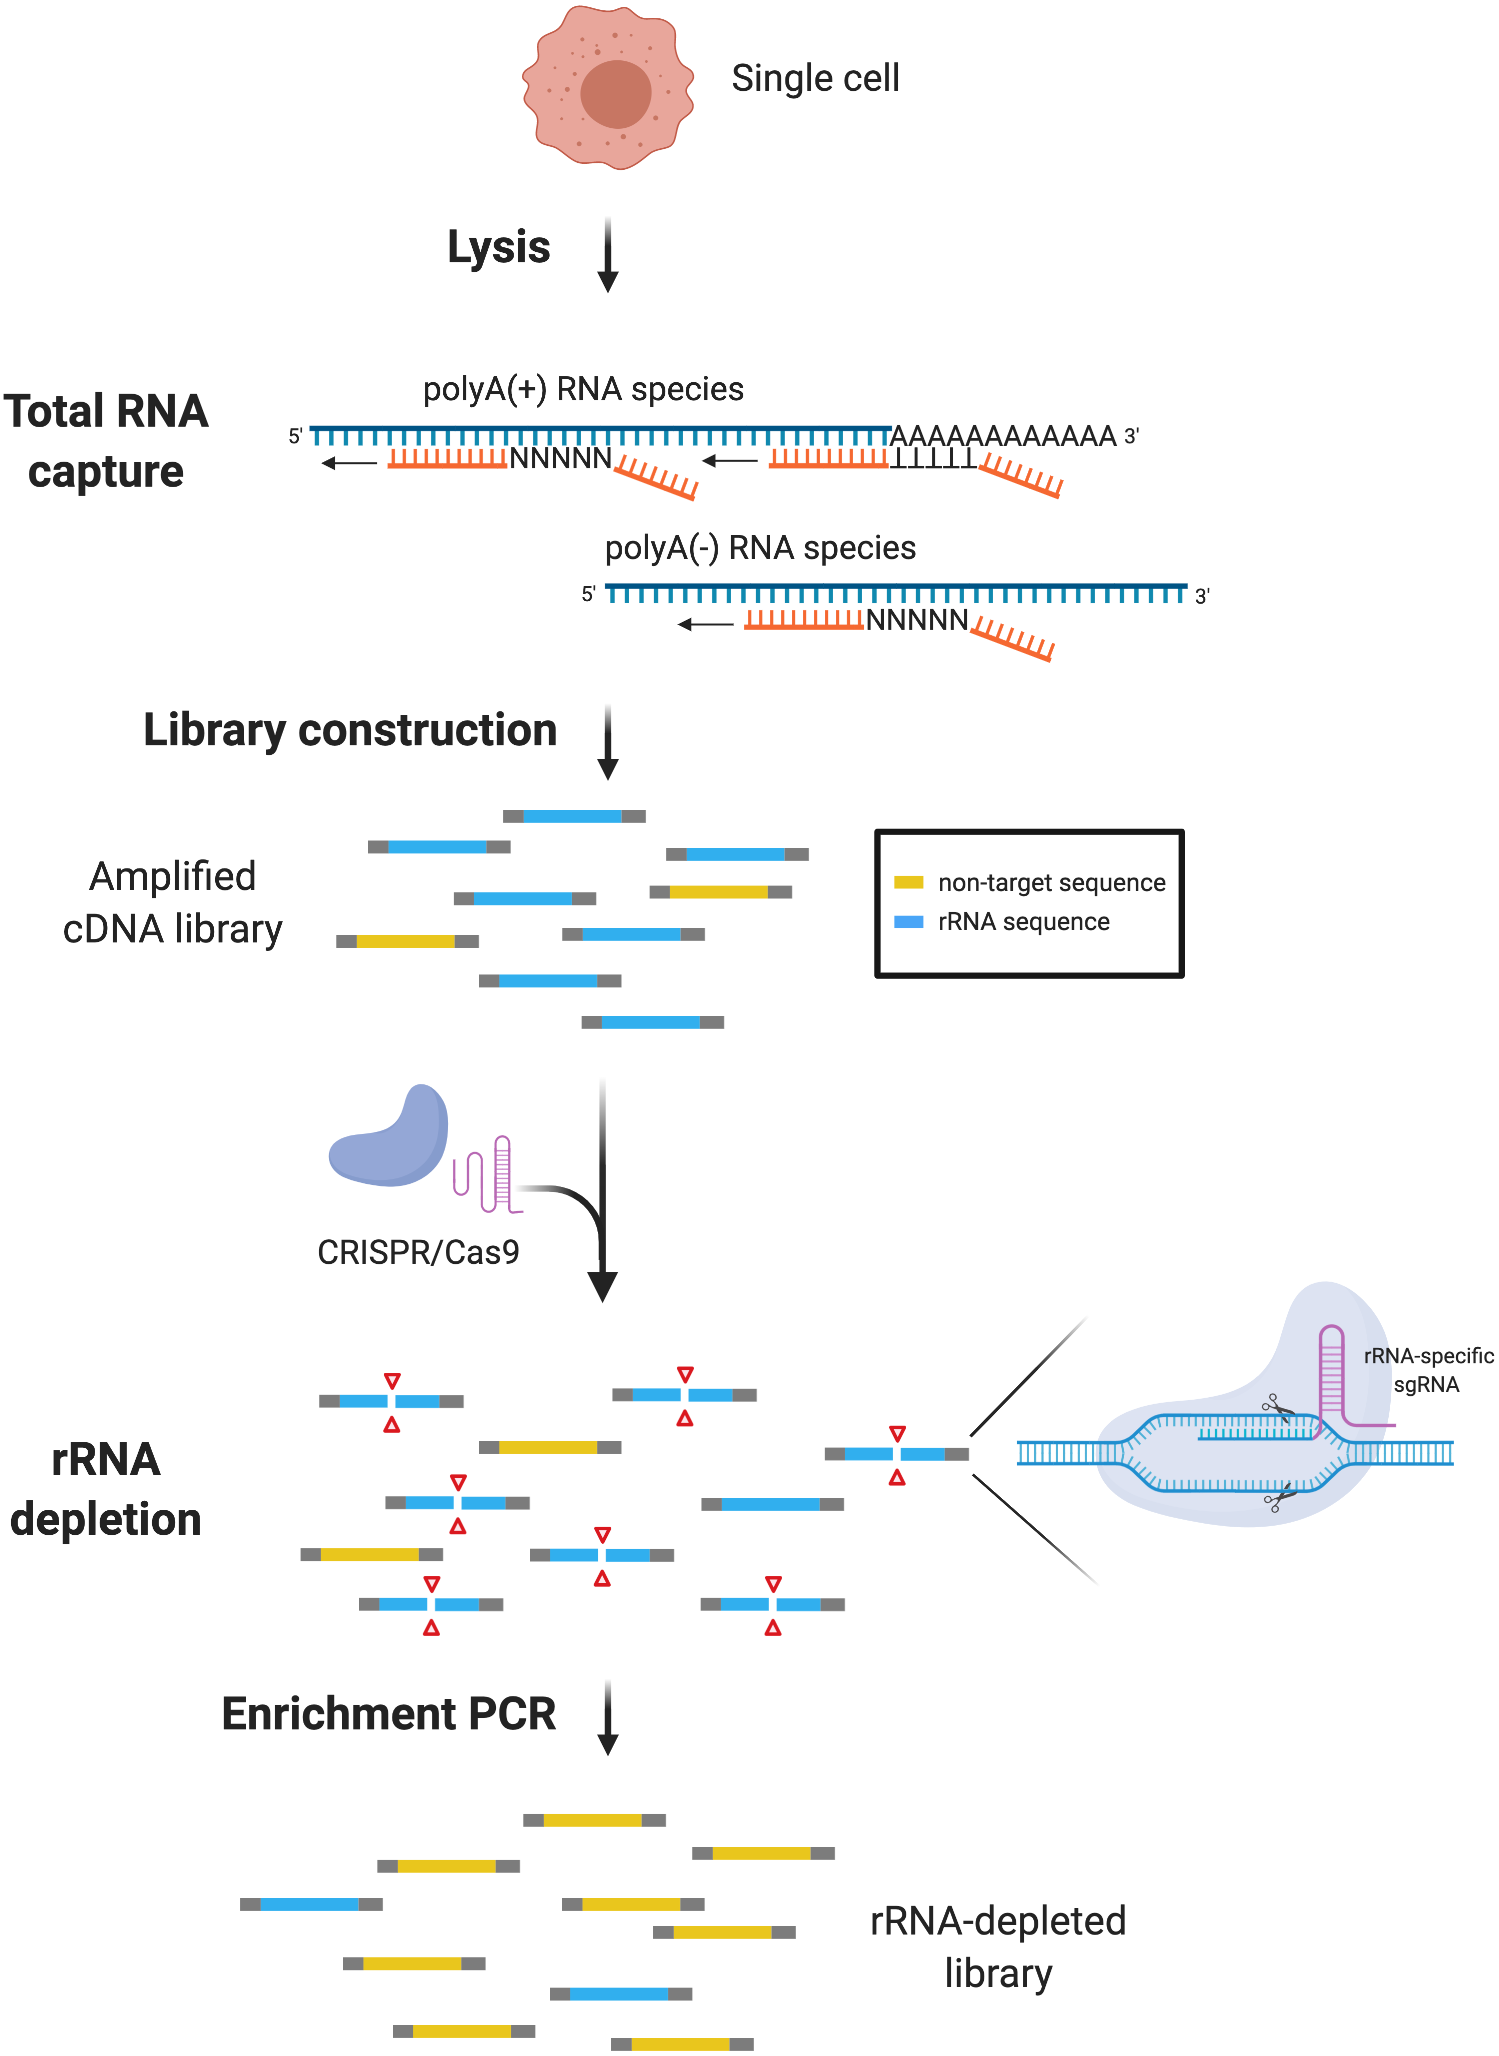
Materials & Methods
Cell culture and sorting
The human colon cancer cell line HCT116 (CCL-247™) was purchased from the American Tissue-type Culture Collection (ATCC). HCT116 cells were maintained in Dulbecco’s Modified Eagle Medium (DMEM) (Thermo Fisher Scientific, Cat# 11965118) supplemented with 10% Fetal Bovine Serum (Thermo Fisher Scientific, Cat# 16000044) and 1% Penicillin/Streptomycin (Thermo Fisher Scientific, Cat# 15070063). Cells were cultured to 70–80% confluence, trypsinized and collected. Single cells were sorted using BD FACSAria™ IIIu cell sorter (BD Biosciences) into 200 µl 8-tube strip containing lysis buffer prepared according to MATQ-seq protocol (Sheng et al., 2017). 100 cells were sorted for each mini-bulk sample.
Library construction and sequencing
Single-cell or mini-bulk RNA-seq libraries were constructed as instructed by the MATQ-seq protocol. cDNA libraries were quantified using a Qubit 3 Fluorometer with dsDNA HS Assay Kit (Thermo Fisher Scientific, Cat# Q32851). Quality check on cDNA library size (Fig. S1) was performed using Fragment Analyzer (Advanced Analytical) with HS NGS Fragment Kit (1–6000 bp) (Agilent, Cat# DNF-474-1000). Individual libraries were pooled using Nextseq500/550 High Output Kit v2.5 (Illumina, Cat# 20024906). As an optional step, pooled libraries were size-selected using Agencourt AMPure XP magnetic beads (Beckman Coulter, Cat# A63882). Pooled libraries were then subjected to scDASH treatment as illustrated in Fig. 1, followed by enrichment amplification with P5 and P7 primers. The detailed scDASH protocol can be found in Supplemental File (scDASH Protocol). Illumina libraries were sequenced using a Nextseq500/550 (Illumina) to obtain approximately 1.5 million paired sequencing reads for each library.
In silico design and generation of sgRNA sequences
To ensure the utility of the sgRNA library in targeting inter-chromosomal loci, we obtained the reference sequences of non-clustered 45S rRNA genes (18S: NR_003286.2; 5.8S: NR_003285.2; 28S: NR_003287.2) and used this in parallel with a recently assembled sequence of ribosomal 45S RNA cluster (GenBank accession KY962518.1) (Kim et al., 2018) to generate sgRNA candidates in silico. We used Benchling (Benchling, 2020) to design sgRNA on both positive and negative strands of the target sequences, with specificity score (off-target score) and efficiency score (on-target score) calculated for each sgRNA. The models used for scoring guide sequences in terms of specificity and efficiency were proposed by Hsu et al. (2013) and Doench et al. (2016) respectively. Only the common sgRNA candidates generated from both non-clustered reference sequences and KY962518.1 were considered. We selected only those commonly identified sgRNAs with both off-target and on-target scores 0.5 standard deviation higher than the mean. We selected 58 sgRNAs against the 7,096 bp-long sequence of 18S, 5.8S and 28S rRNA genes. The sgRNA target sites are approximately spaced out by 100 bp intervals. A complete list of the sgRNA sequences can be found in Table S1.
In vitro sgRNA synthesis
Transcription templates of each sgRNA were split into halves and purchased as DNA oligos. The first half (54–55 nt) contains a T7 RNA polymerase promoter, a 20-nt target-specific spacer region and a 14-nt overlapping scaffold sequence. G was added upstream if spacer sequence does not begin with a G, in order to satisfy the sequence requirements of the T7 RNA polymerase promoter. The entire sequence is as follows: 5′ TTCTAATACGACTCACTATA(G)(crRNA-20)GTTTTAGAGCTAGA 3′. The second half (80 nt) constitutes a constant region required for the association of sgRNA with Cas9 protein: 5′ AAAAGCACCGACTCGGTGCCACTTTTTCAAGTTGATAACGGACTA GCCTTATTTTAACTTGCTATTTCTAGCTCTAAAAC 3′. The two halves of the sgRNA transcription templates were assembled and amplified with a PCR reaction using KAPA HiFi™ HotStart DNA Polymerase (Roche, Cat# 7958935001). The resulting 58 amplicons (120-121 bp) were pooled and purified using NucleoSpin® Gel and PCR Clean-up Kit (Macherey Nagel, Cat# 740609.250) and their sizes were verified by agarose gel electrophoresis.
In vitro transcription was performed using the HiScribe™ T7 Quick High Yield RNA Synthesis Kit (NEB, Cat# E2050S) in accordance with the protocol provided. We performed overnight incubation to maximize yield. Samples were then cleaned up using RNA Clean and Concentrator-5 (Zymo Research, Cat# R1013), and typically 60–90 µg of RNA were obtained after the clean-up. We then verified transcript size using Fragment Analyzer Automated CE System (DNF 472).
In vitro Cas9 digestion
CRISPR/Cas9 treatment was performed as described by Gu et al. (2016) with certain adaptations. Formation of ribonucleoprotein (RNP) complex was achieved by mixing 90 ng of SpCas9 nuclease (NEB, Cat# M0386S) and 2700 ng of sgRNAs in Cas9 buffer. This corresponds to 100-fold excess of Cas9 protein and 3000-fold excess of sgRNAs relative to the rRNA substrate (i.e., 0.9 ng of rRNA substrate if using 1 ng of cDNA as input). Incubation duration for Cas9 digestion of sample cDNA was extended to 2 h and 30 min. Digested samples were purified using Agencourt AMPure XP magnetic beads (Beckman Coulter, Cat# A63882) and either directly subject to PCR enrichment or stored at −20 °C.
Detailed protocols for in vitro sgRNA synthesis and Cas9 digestion are supplied in the Supplemental File.
Quantitative PCR
Following PCR enrichment with P5 and P7 primers and subsequent clean-up, qPCR analysis was performed on the cDNA library using Quantagene q225 (Kubo Technology). A set of primer sequences specific to 18S, 5.8S and 28S was designed such that the minimum distance between the primer recognition regions and Cas9 target site is 20 nt (Table S2). Levels of rRNA measured in the cDNA library were normalised to GAPDH levels. Relative quantification of rRNA cDNA levels was performed using the delta delta CT method (Pfaffl, 2001).
Data processing and analysis
All sequencing raw data have been deposited on Gene Expression Omnibus: GSE158880. Demultiplexing and adapter trimming of raw reads were performed using BaseSpace (Illumina). Read quality was verified using FastQC (Andrews, 2010) where the mean Phred quality score across each base position in the read is > 30. Quality-checked reads were quantified with kallisto (Bray et al., 2016) using a concatenated reference sequence comprising Gencode v.29 human reference transcriptome and KY962518.1 rRNA sequence. Per-nucleotide coverage of 45S rRNA sequence was calculated from .bam files using the depth command in SAMtools. The calculated depth at each position was then normalised to the total depth. Gene-level read count was obtained by importing kallisto-generated transcript abundance to tximport (Soneson, Love & Robinson, 2015). Library size difference was normalised by random downsampling of gene-level read count using custom R scripts. This random downsampling was repeated three times for each sample, and either the mean or median read count was taken for different analyses (see Results). All data processing and analysis code are available at GitHub repository: https://github.com/lscdanson/scDASH.
Graphic design and visualisation tools
Figure 1 was created with BioRender.com (, 2020). All figures in the results section were generated using ggplot2 (Wickham, 2016).
Results
scDASH can effectively deplete rRNA genes in scRNA-seq libraries
The overall scDASH approach is depicted in Fig. 1. The main differences between the previously described DASH and scDASH are: (1) the workflow and reaction conditions to generate the cDNA library follows that of the single cell transcriptome amplification protocol; (2) modified reaction conditions to achieve optimal Cas9-mediated depletion efficiency and specificity, in particular we found that the optimal concentration of Cas9 and sgRNA required in scDASH is higher than previously described for DASH (see Methods); (3) the specific library of sgRNA that we have designed to deplete rRNA. This rRNA-targeting sgRNA library design is non-trivial. Of the human cytoplasmic rRNA species, 5S rRNAs, ribosomal 45S RNA clusters, and non-clustered ribosomal 45S RNA genes, the 45S rRNA are the most abundant and targeting this group of rRNA sequences for depletion with the DASH approach would be the most effective. The 45S rDNA that encode for the ribosomal 45S RNA clusters are made up of 30-40 tandem repeats that are transcribed as a single unit to produce the precursor rRNA that is then later processed to generate the 18S, 5.8S, and 28S rRNA (Agrawal & Ganley, 2018). Due to its highly repetitive nature, a full reference sequence for the 45S rRNA was not available until recently, with the use of TAR cloning and long-read sequencing technology generated the first 44,838 bp-long reference of the human chromosome 21 rRNA genes (GenBank accession KY962518.1) (Kim et al., 2018). We used this rRNA reference to design a library of sgRNAs in silico that should enable targeted rRNA cleavage when applied in our scDASH protocol. However, due to the same technical challenges, the 45S rRNA clusters from other chromosomes have not yet been sequenced, and it is unclear what degree of sequence homology there is between the 45S rRNA clusters from different chromosomes within and between individuals. It has been reported that human rDNA copy number could be as high as 1,590 copies per individual (Parks et al., 2018), therefore if the sequence variation between the chromosomal rDNA clusters is large, it is possible that sgRNA designed using the 45S reference from chr21 may not effectively target those rDNA sequences from other chromosomes. On the other hand, other literature has reported that intra-individual variations with high allelic frequency are rare in human rDNA loci (Parks et al., 2018), which suggests that sequence homology between chromosomal 45S clusters may be sufficiently high, but this assumption has not been tested experimentally before this study. The resulting 58 sgRNAs chosen for this study are spaced out approximately in 100 bp intervals and were specifically selected against the 7,096 bp-long sequence of 18S, 5.8S and 28S rRNA genes in the KY962518.1 reference (Figs. 2B, 2C). Specific details of the sgRNA design rationale can be found in Materials and Methods.
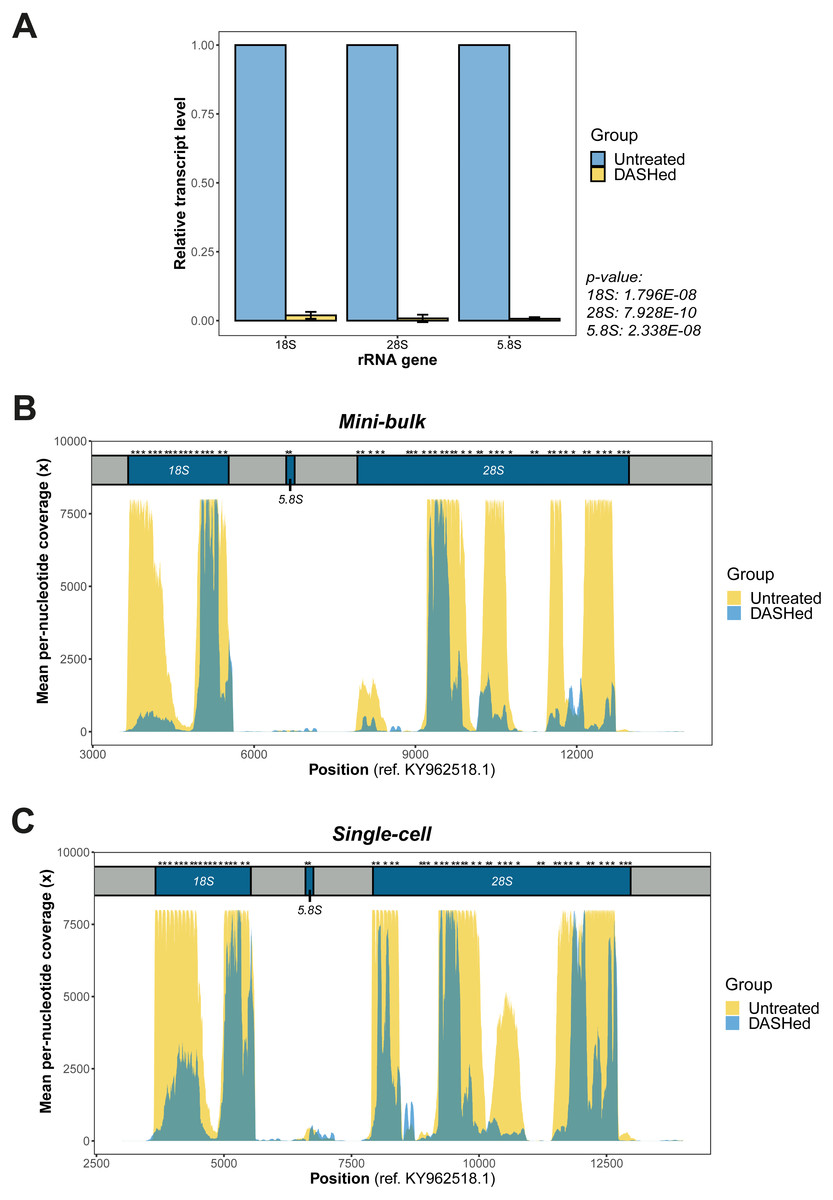
Figure 2: Validation of rRNA depletion in scRNA-seq libraries after scDASH treatment.
(A) qPCR quantification of 18S, 28S and 5.8S rRNA levels in untreated and DASHed scRNA-seq libraries. Student’s t-test demonstrates a significant reduction in the transcript levels of all three rRNA genes after scDASH treatment (18S: ****p = 1.796E−08, n = 3; 28S: ***p = 7.928E−10, n = 3; 5.8S: ****p = 2.338E−08, n = 3). All data are represented as mean ± s.d. (B) Comparison of per-nucleotide coverage of the CRISPR-targeted regions spanning the 18S, 5.8S and 28S rRNA loci between untreated and DASHed mini-bulk libraries. Mean coverage is derived from two mini-bulk libraries for each sample group. (C) Comparison of per-nucleotide coverage of the CRISPR-targeted regions spanning the 18S, 5.8S and 28S rRNA loci between untreated and DASHed single-cell libraries. Mean coverage is derived from four single-cell libraries for each sample group. For (B) and (C), the three rRNA coding regions are coloured in blue and labelled with respect to their corresponding positions at the top. Regions in grey represent internal and external transcribed spacers. Asterisk indicates sgRNA target site. Per-nucleotide coverage is obtained by dividing the sequencing depth at each position by total depth.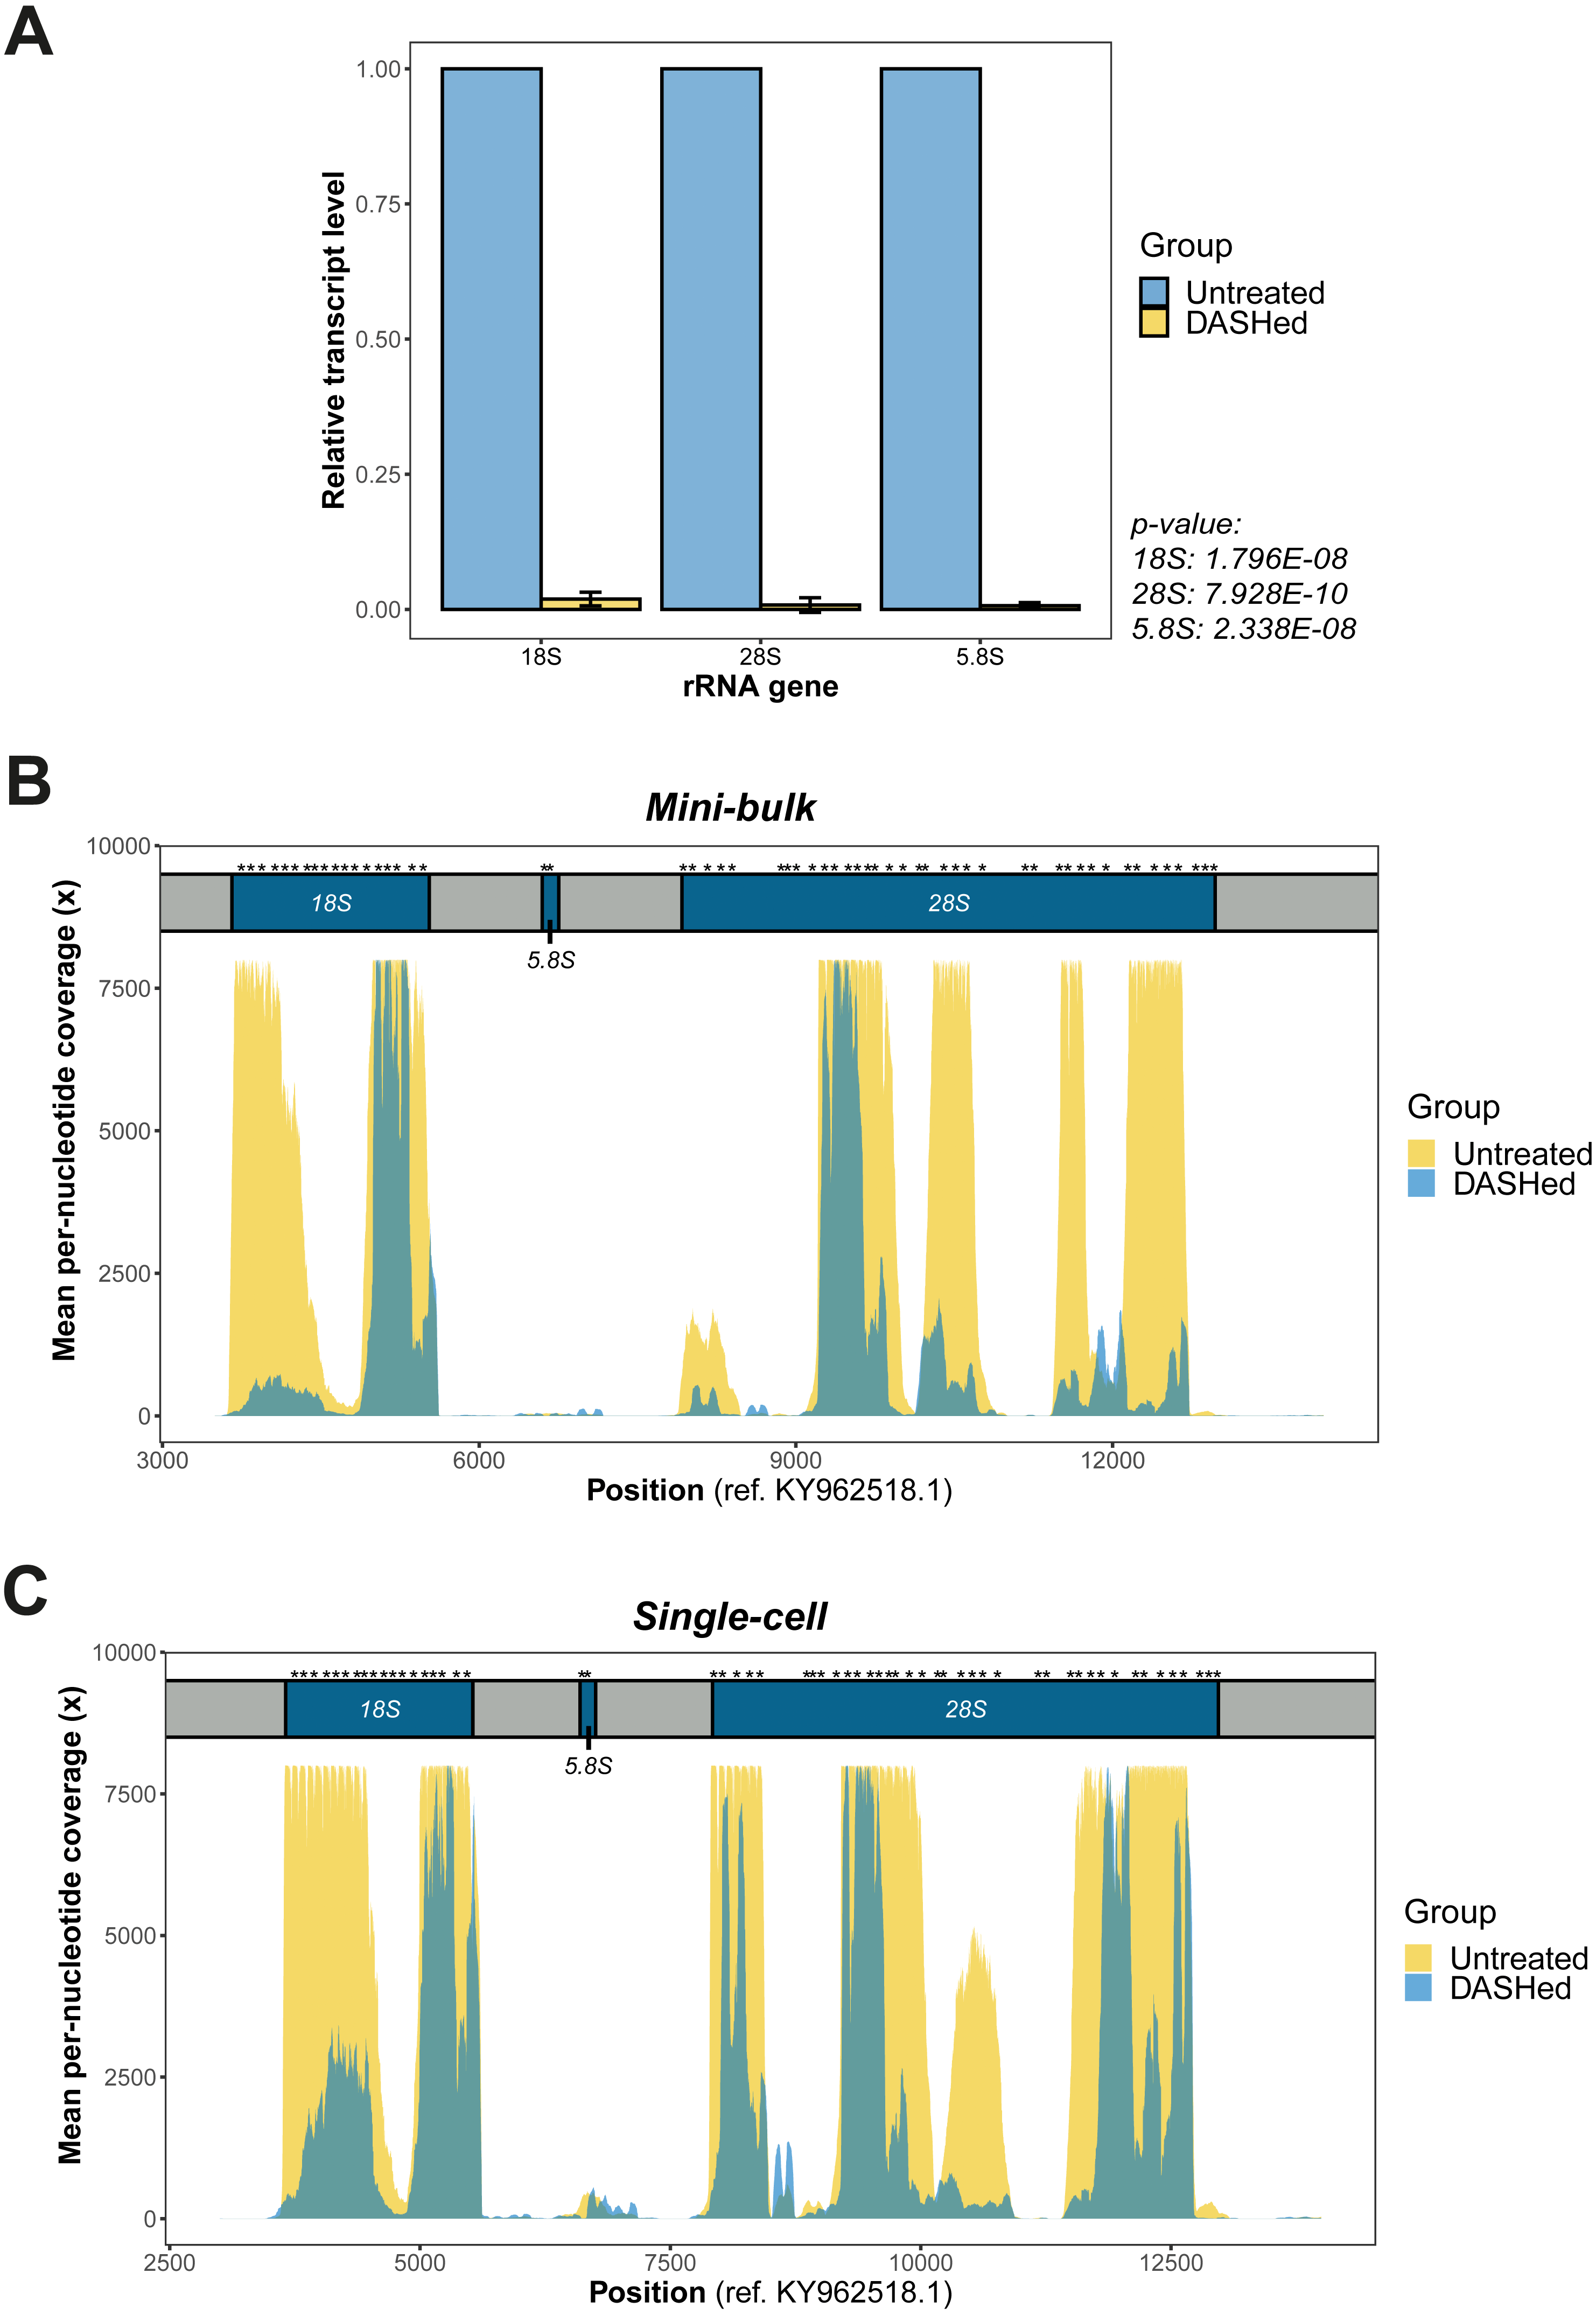
We first examined the efficacy of scDASH in depleting cytoplasmic rRNA from scRNA-seq libraries. We designed primers against the sgRNA target sites on each of the 18S, 5.8S and 28S rRNA genes (Fig. S2), then performed qPCR using these primers to assess the quantity of sequence fragments from these target site in both untreated libraries and scDASHed libraries. Comparisons of the quantity of rRNA fragments in scRNA-seq libraries before and after scDASH, as measured by qPCR, indicates that scDASH treatment results in > 99% depletion in all three sgRNA-targeted rRNA gene loci (Fig. 2A).
Next, we comprehensively evaluated the performance of scDASH by comparing the sequencing results from 8 single-cell and 4 mini-bulk transcriptomes, half of which were subjected to scDASH and half were untreated. Reads that mapped to individual nucleotides within the relevant window from position 3,000 to 14,000 on the KY962518.1 reference sequence were quantified, as illustrated in Figs. 2B and 2C respectively for mini-bulk and single-cell samples. In untreated samples, there are multiple regions showing peaks with 8000x coverage, largely localized to within the 18S and 28S rRNA coding regions. Such a high coverage is presumably an aggregate total contributed by an average of 315 rRNA loci. Depletion with scDASH resulted in roughly 70% reduction in total coverage in this rRNA region for the mini-bulk libraries, and 55% reduction for the single-cell libraries. This is consistent with our qPCR measurement results. While most of the peaks were dramatically reduced in the DASHed samples, a few loci consistently appear to be less efficiently depleted. The reason for this is unclear; steric hinderance of Cas9 cleavage due to formation of secondary structures in-situ, or the sequence variations between those loci from different chromosomes are two possible speculative reasons that can be further investigated in a future study.
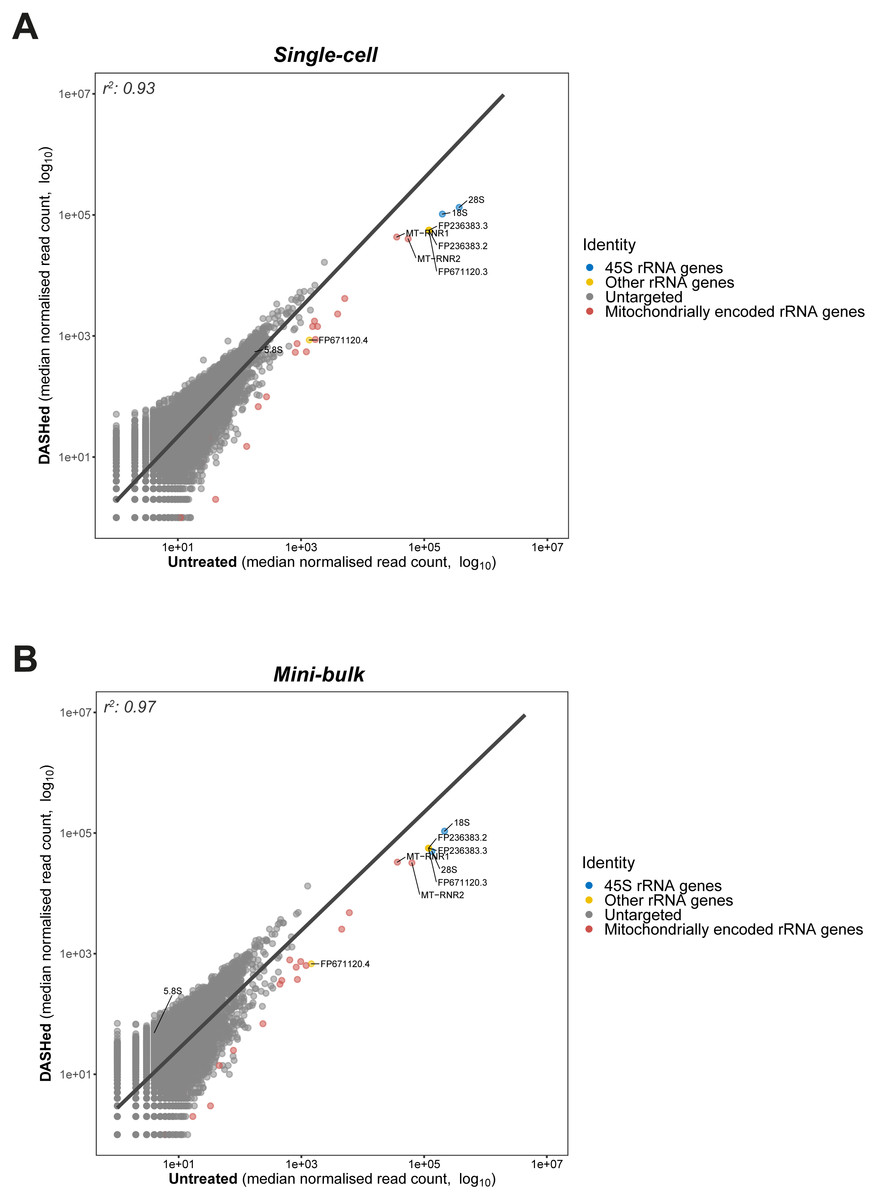
Figure 3: Goodness-of-fit between gene expressions in DASHed and untreated samples.
(A) Regression between expressions in DASHed and untreated single-cell libraries. Raw read count from each single-cell library is normalised by subsampling 1.2 million reads randomly. Median is derived from four single-cell libraries for each sample group. (B) Regression between expressions in DASHed and untreated mini-bulk libraries. Raw read count from each mini-bulk library is normalised by subsampling 0.95 million reads randomly. Median is derived from two mini-bulk libraries for each sample group. For (A) and (B), dots in blue denotes 18S, 28S and 5.8 rRNA genes. Dots in yellow denotes other rRNA genes. Dots in grey denotes genes untargeted by scDASH. Dots in red denotes mitochondrially encoded RNA genes. A linear regression line is labelled in dark grey. Both x- and y-axes are log10-transformed. Coefficient of determination (r2) is shown top left.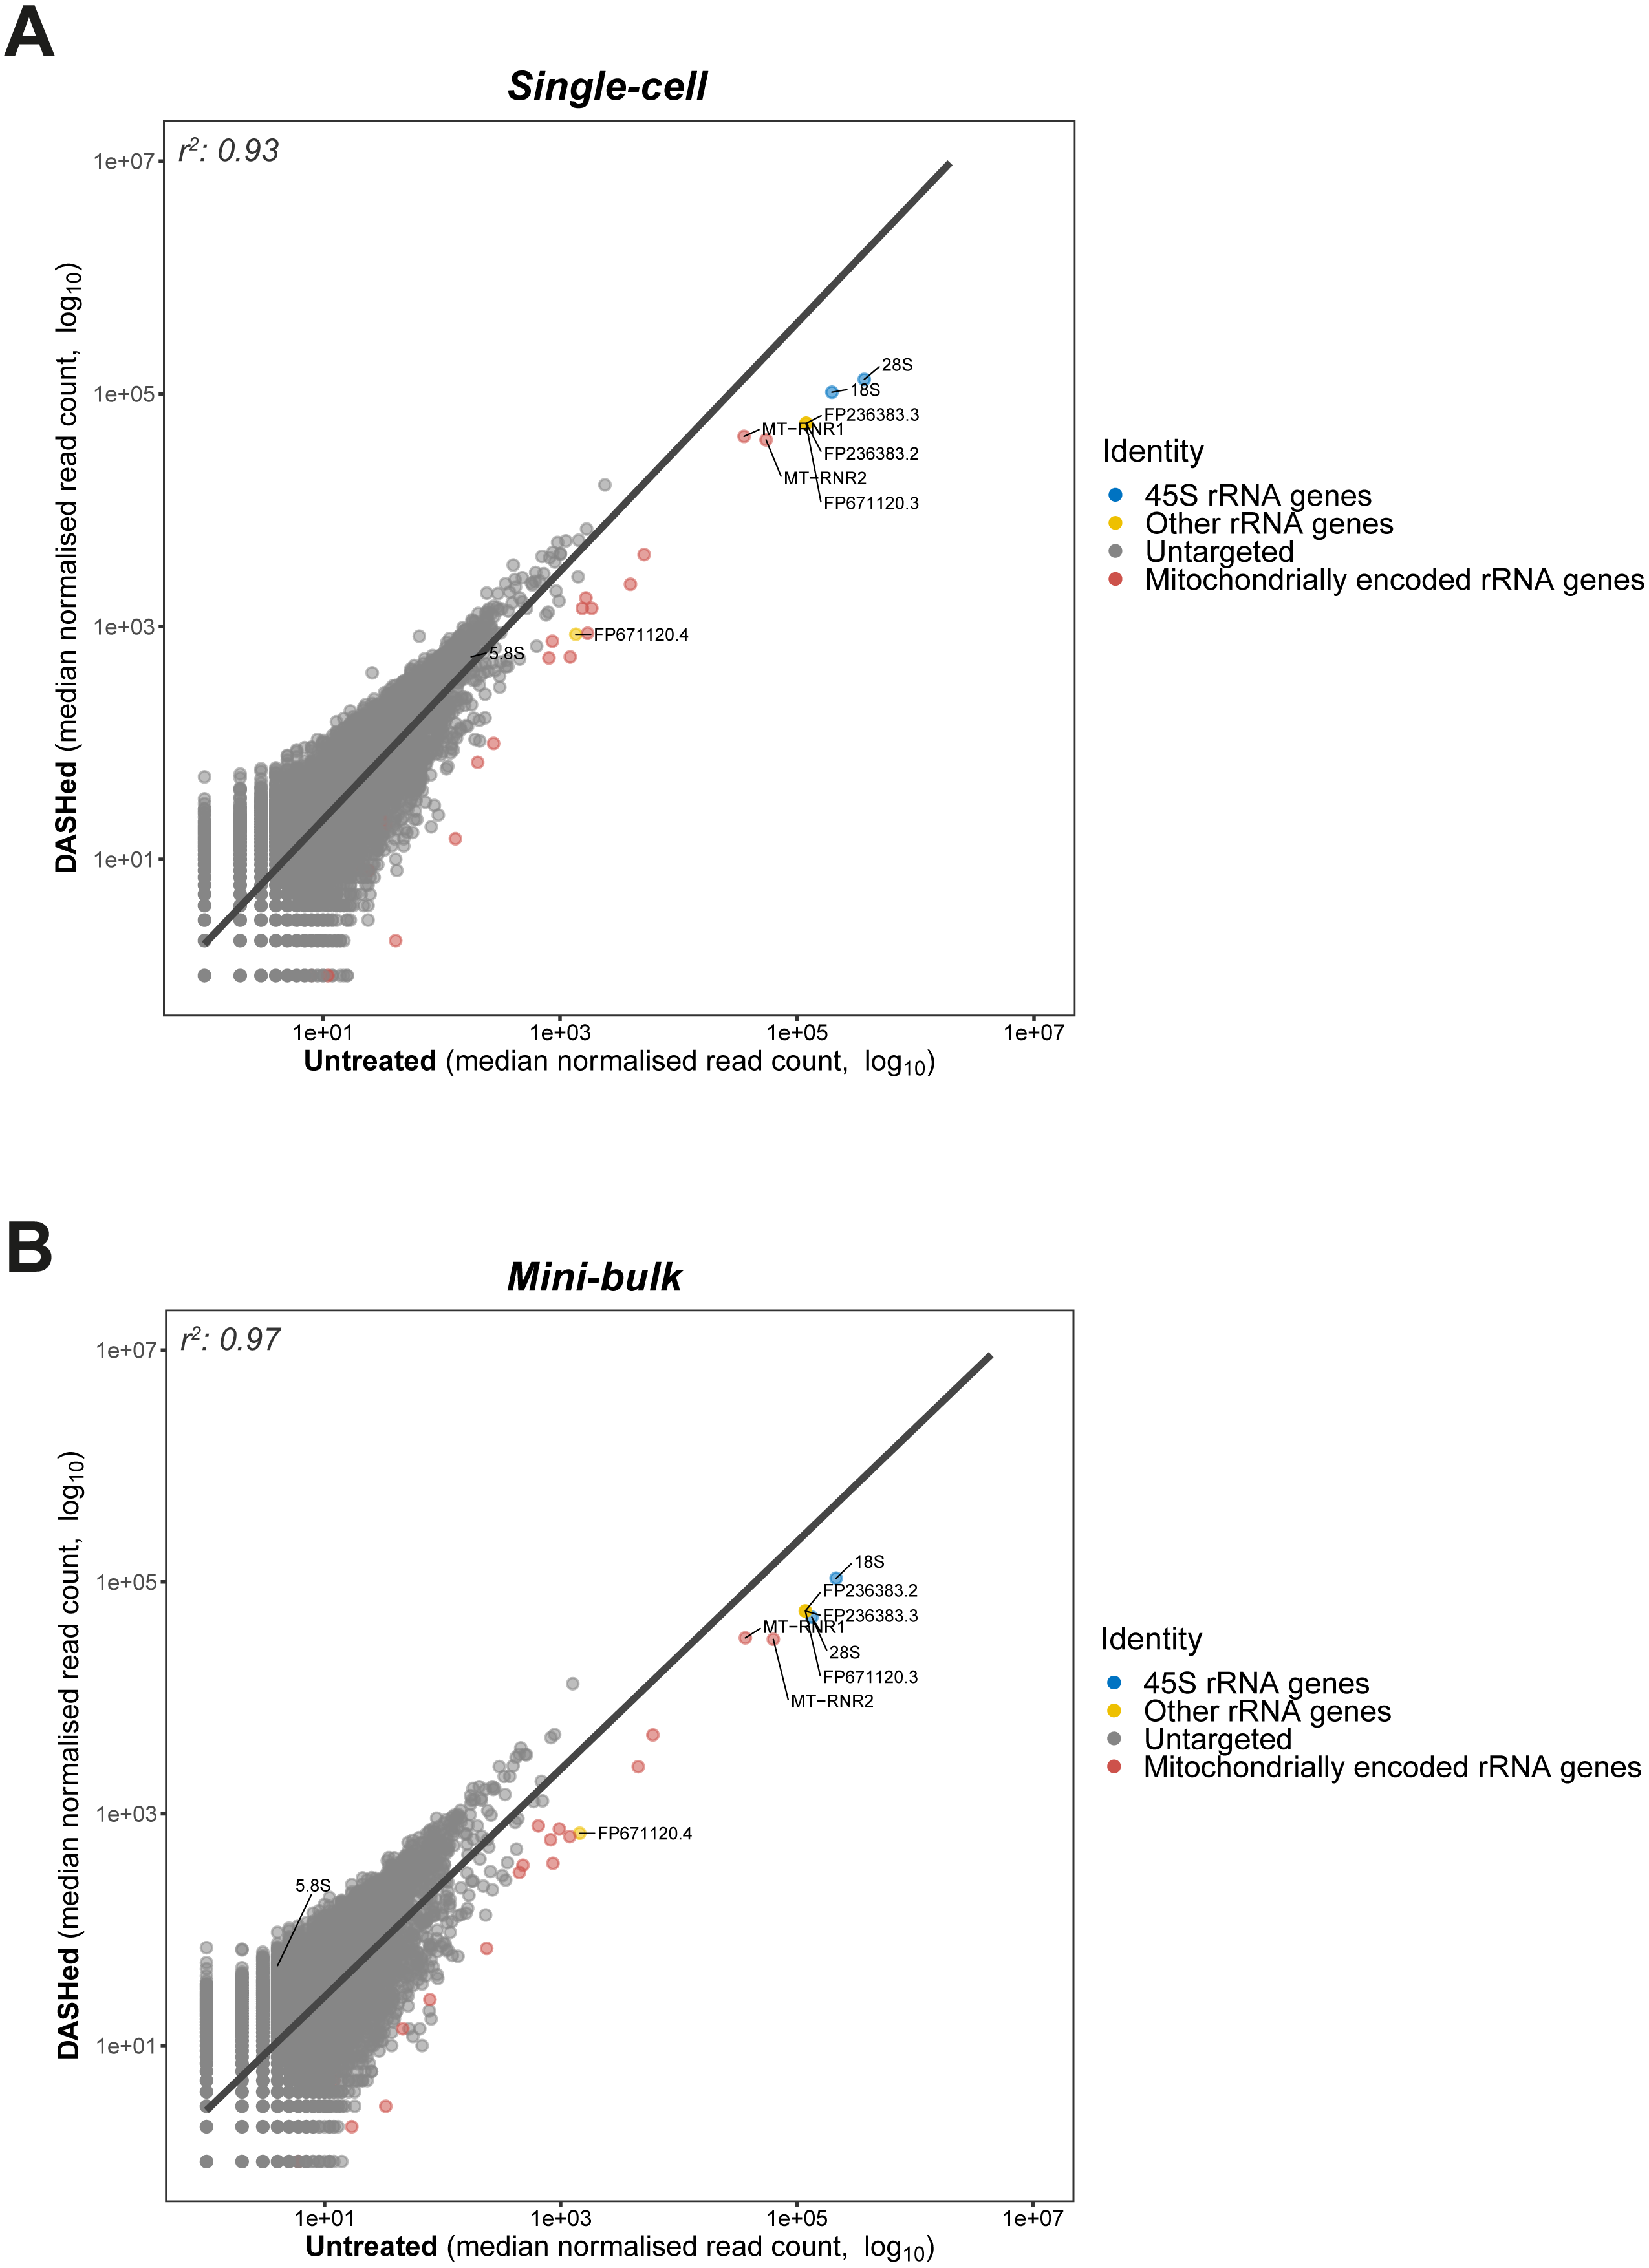
scDASH is highly specific in depleting cytoplasmic rRNA
Having established the applicability of scDASH in depleting cytoplasmic rRNAs in scRNA-seq libraries, we wondered whether the depletion is specific to the targeted 18S, 5.8S and 28S rRNA genes; in other words, we wanted to assess the off-target effects of this approach. To do so, we assessed the correlation in gene expression levels between scDASH treated and untreated sample groups, modelling the relationship between depleted rRNA and undisrupted gene expressions using linear regression (Fig. 3). By plotting the untreated sample on the x-axis, and the scDASH treated sample on the y-axis, genes that are unaffected by the treatment should fall close to the unity line as their expression should be highly correlated between treated and untreated samples; whereas genes that are depleted by scDASH will appear further right of the unity line, as their expression in the treated sample will be much lower than in the untreated sample. In scDASH treated single-cell RNA-seq libraries, we observed that rRNA genes fell to the right of the unity line as expected (Fig. 3A), while the overall agreement in gene expressions remains high with a coefficient of determination (r2) of 0.93. This suggests that the gene expression in the DASHed scRNA-seq libraries are largely similar to that of untreated samples (Fig. 3A), suggesting a negligible off-target depletion. It was previously reported that low expression genes in single-cell data can be highly variable among replicates due to dropout events, and that they can only be reliably detected with bulk or single-cell ensemble datasets (Wu et al., 2014). Therefore, to further validate our results, we performed the same off-target assessment experiment in mini-bulk samples of 100 cells per experiment (Fig. 3B). As expected, a higher (r2) value (0.97) was observed in mini-bulk sample pairs while the three targeted rRNA genes remain deviated from the regression line (Fig. 3B). This indicates that scDASH depletion is generally highly specific, and that the lower (r2) value seen in single-cell measurements is largely due to the greater level of technical variation that is expected in single-cell RNA-seq experiments.
Although we did not observe any coding genes or major classes of non-coding transcripts to be severely affected by off-target depletion, there were a few other ‘non-informative’ RNA species, that were depleted after scDASH treatment. First, the mitochondrially encoded rRNA genes MT-RNR1 and MT-RNR2 were not specifically targeted, but were found to be significantly depleted when compared to untreated samples. This is because over half of the sgRNAs we designed share a 100% sequence identity to different regions of MT-RNR1 and MT-RNR2, presumably a result of their sequence similarity with cytoplasmic rRNAs. In experiments where these mitochondrial rRNA are of-interest, those sgRNA that target regions with homology to the mitochondrial rRNA can be removed from the scDASH sgRNA pool, thus preserving these fragments in the final sequencing library while the trade-off may be a larger portion of rRNA fragments being sequenced as well. Another set of rRNA that were untargeted but depleted are three rRNA genes that do not originate from the 45S rRNA cluster: FP671120.3, FP236383.2 and FP236383.3. As shown in Fig. 3, these genes stand out as outliers in close proximity to the targeted 45S rRNA genes. To provide a quantitative measure of the depletion effect, we computed the z-score of these three untargeted but depleted rRNA genes. More specifically, we first calculated the difference in normalised read counts for every single gene between DASHed and untreated replicates (ΔDU), as well as between untreated replicates (ΔUU). Then, we computed a two-sample t distribution of the mean difference between ΔDU and ΔUU of all genes. The three off-target genes present a z-score ranging from 63–65, while 28S rRNA gene gives a z-score of 224. This shows that even though the untargeted genes were depleted, the depletion effect is still limited in extent when compared to the targeted rRNA genes. FP671120.3 and FP236383.2 belong to a class of non-coding RNA known as NoRC associated RNA, which function as antisense against rRNA genes when ribosome synthesis is not desired. These RNA species were depleted since they share a 100% sequence identity with multiple rRNA-specific regions on KY962518.1. FP236383.3 is classified as a novel subclass of long non-coding RNA (lncRNA) called long intervening non-coding RNA (lincRNA). Different regions on FP236383.3 exhibit a 99.6–100% sequence identity to 18S, 5.8S and 28S rRNA genes. Although the role of lincRNA remains elusive, it has been speculated that FP236383.3 could be a by-product of the concerted evolution of rRNA genes (Robicheau et al., 2017).
scDASH enables more informative whole transcriptome profiling at equal sequencing depth
We further evaluated the effect of cytoplasmic rRNA depletion on the detectability of other RNA types. Specifically, we calculated the number of reads detected for each RNA type at gene-level before and after scDASH treatment, while accounting for sequencing library depth. In the untreated libraries, consistent with past analyses (Eun, 1996), rRNA genes accounted for the largest proportion of reads (78%) in single-cell transcriptomes (Table 1; Fig. 4A). Following scDASH depletion, rRNA-aligned reads were brought down to 34% compared to without scDASH (Fig. 4B). Correspondingly, reads that align to coding genes expanded by three-fold from 20% to 61% after scDASH rRNA depletion (Figs. 4A, 4C). The detectable gene expression level of other RNA types including pseudogenes, lncRNAs, and microRNAs were all significantly elevated upon treatment with scDASH (Figs. 4D, 4E, 4F). The numbers of genes detected also appeared to increase with scDASH treatment, although the increase was not statistically significant (Fig. S3). Similar increases in detectability of non-rRNA species were also seen in the mini-bulk RNA-seq datasets (Fig. S4). Collectively, this illustrates the effectiveness of scDASH in freeing up sequencing space for non-rRNA species-of-interest in scRNA-seq applications.
| Total Aligned reads | mRNA | rRNA | Pseudogene | miRNA | lncRNA | Others | |
|---|---|---|---|---|---|---|---|
| Mini-bulk | |||||||
| Untreated | 956448 | 138784 (14.5%) | 805239 (84.2%) | 1400 (0.146%) | 20 (2.09 ×10⁻³%) | 3207 (0.335%) | 7798 (0.815%) |
| DASHed | 955509 | 518522 (54.3%) | 391478 (41.0%) | 4132 (0.432%) | 110 (1.15 ×10⁻²%) | 6707 (0.702%) | 34560 (3.62%) |
| Single-cell | |||||||
| Untreated | 1356850 | 276535 (20.4%) | 1058192 (78.0%) | 2618 (0.193%) | 127 (9.35 ×10⁻³%) | 5012 (0.369%) | 14366 (1.06%) |
| DASHed | 1355606 | 825393 (60.9%) | 460103 (33.9%) | 6331 (0.467%) | 754 (5.56 ×10⁻²%) | 12486 (0.921%) | 50539 (3.73%) |
Notes:
* All reads represent mean read counts in respective sample group. Percentage of reads in parentheses.

Figure 4: Depletion of cytoplasmic rRNAs by scDASH is translated into enriched representation of whole transcriptome.
(A) Relative abundance of rRNA, mRNA, pseudogene, lncRNA, microRNA and others at gene- level in untreated and DASHed samples. For single-cell comparison group, reads represent mean subsampled reads from 4 single-cell RNA-seq libraries. For mini-bulk comparison group, reads represent mean subsampled reads from 2 mini-bulk RNA-seq libraries. Percentage read is calculated as the number of reads detected within individual RNA category relative to total number of reads. (B) Comparison of rRNA level (in read count) detected in untreated and DASHed scRNA-seq libraries. Student’s t-test demonstrates a significant reduction in rRNA level after scDASH treatment (****p = 1.331E−05, n = 4). (C) Comparison of mRNA level (in read count) detected in untreated and DASHed scRNA-seq libraries. Student’s t- test demonstrates a significant increase in mRNA level after scDASH treatment (****p = 2.382E−05, n = 4). (D) Comparison of pseudogene level (in read count) detected in untreated and DASHed scRNA-seq libraries. Student’s t-test demonstrates a significant increase in pseudogene level after scDASH treatment (** p = 0.001603, n = 4). (E) Comparison of lncRNA level (in read count) detected in untreated and DASHed scRNA-seq libraries. Student’s t-test demonstrates a significant increase in lncRNA level after scDASH treatment (****p = 5.903E−05, n = 4). (F) Comparison of microRNA level (in read count) detected in untreated and DASHed scRNA-seq libraries. Student’s t-test demonstrates a significant increase in microRNA level after scDASH treatment (**** p = 4.566E−05, n = 4). For (B) to (F), each dot represents mean of random subsamples of raw reads from a single library. Normalised read count is log10-transformed so as to approximate to a Gaussian distribution.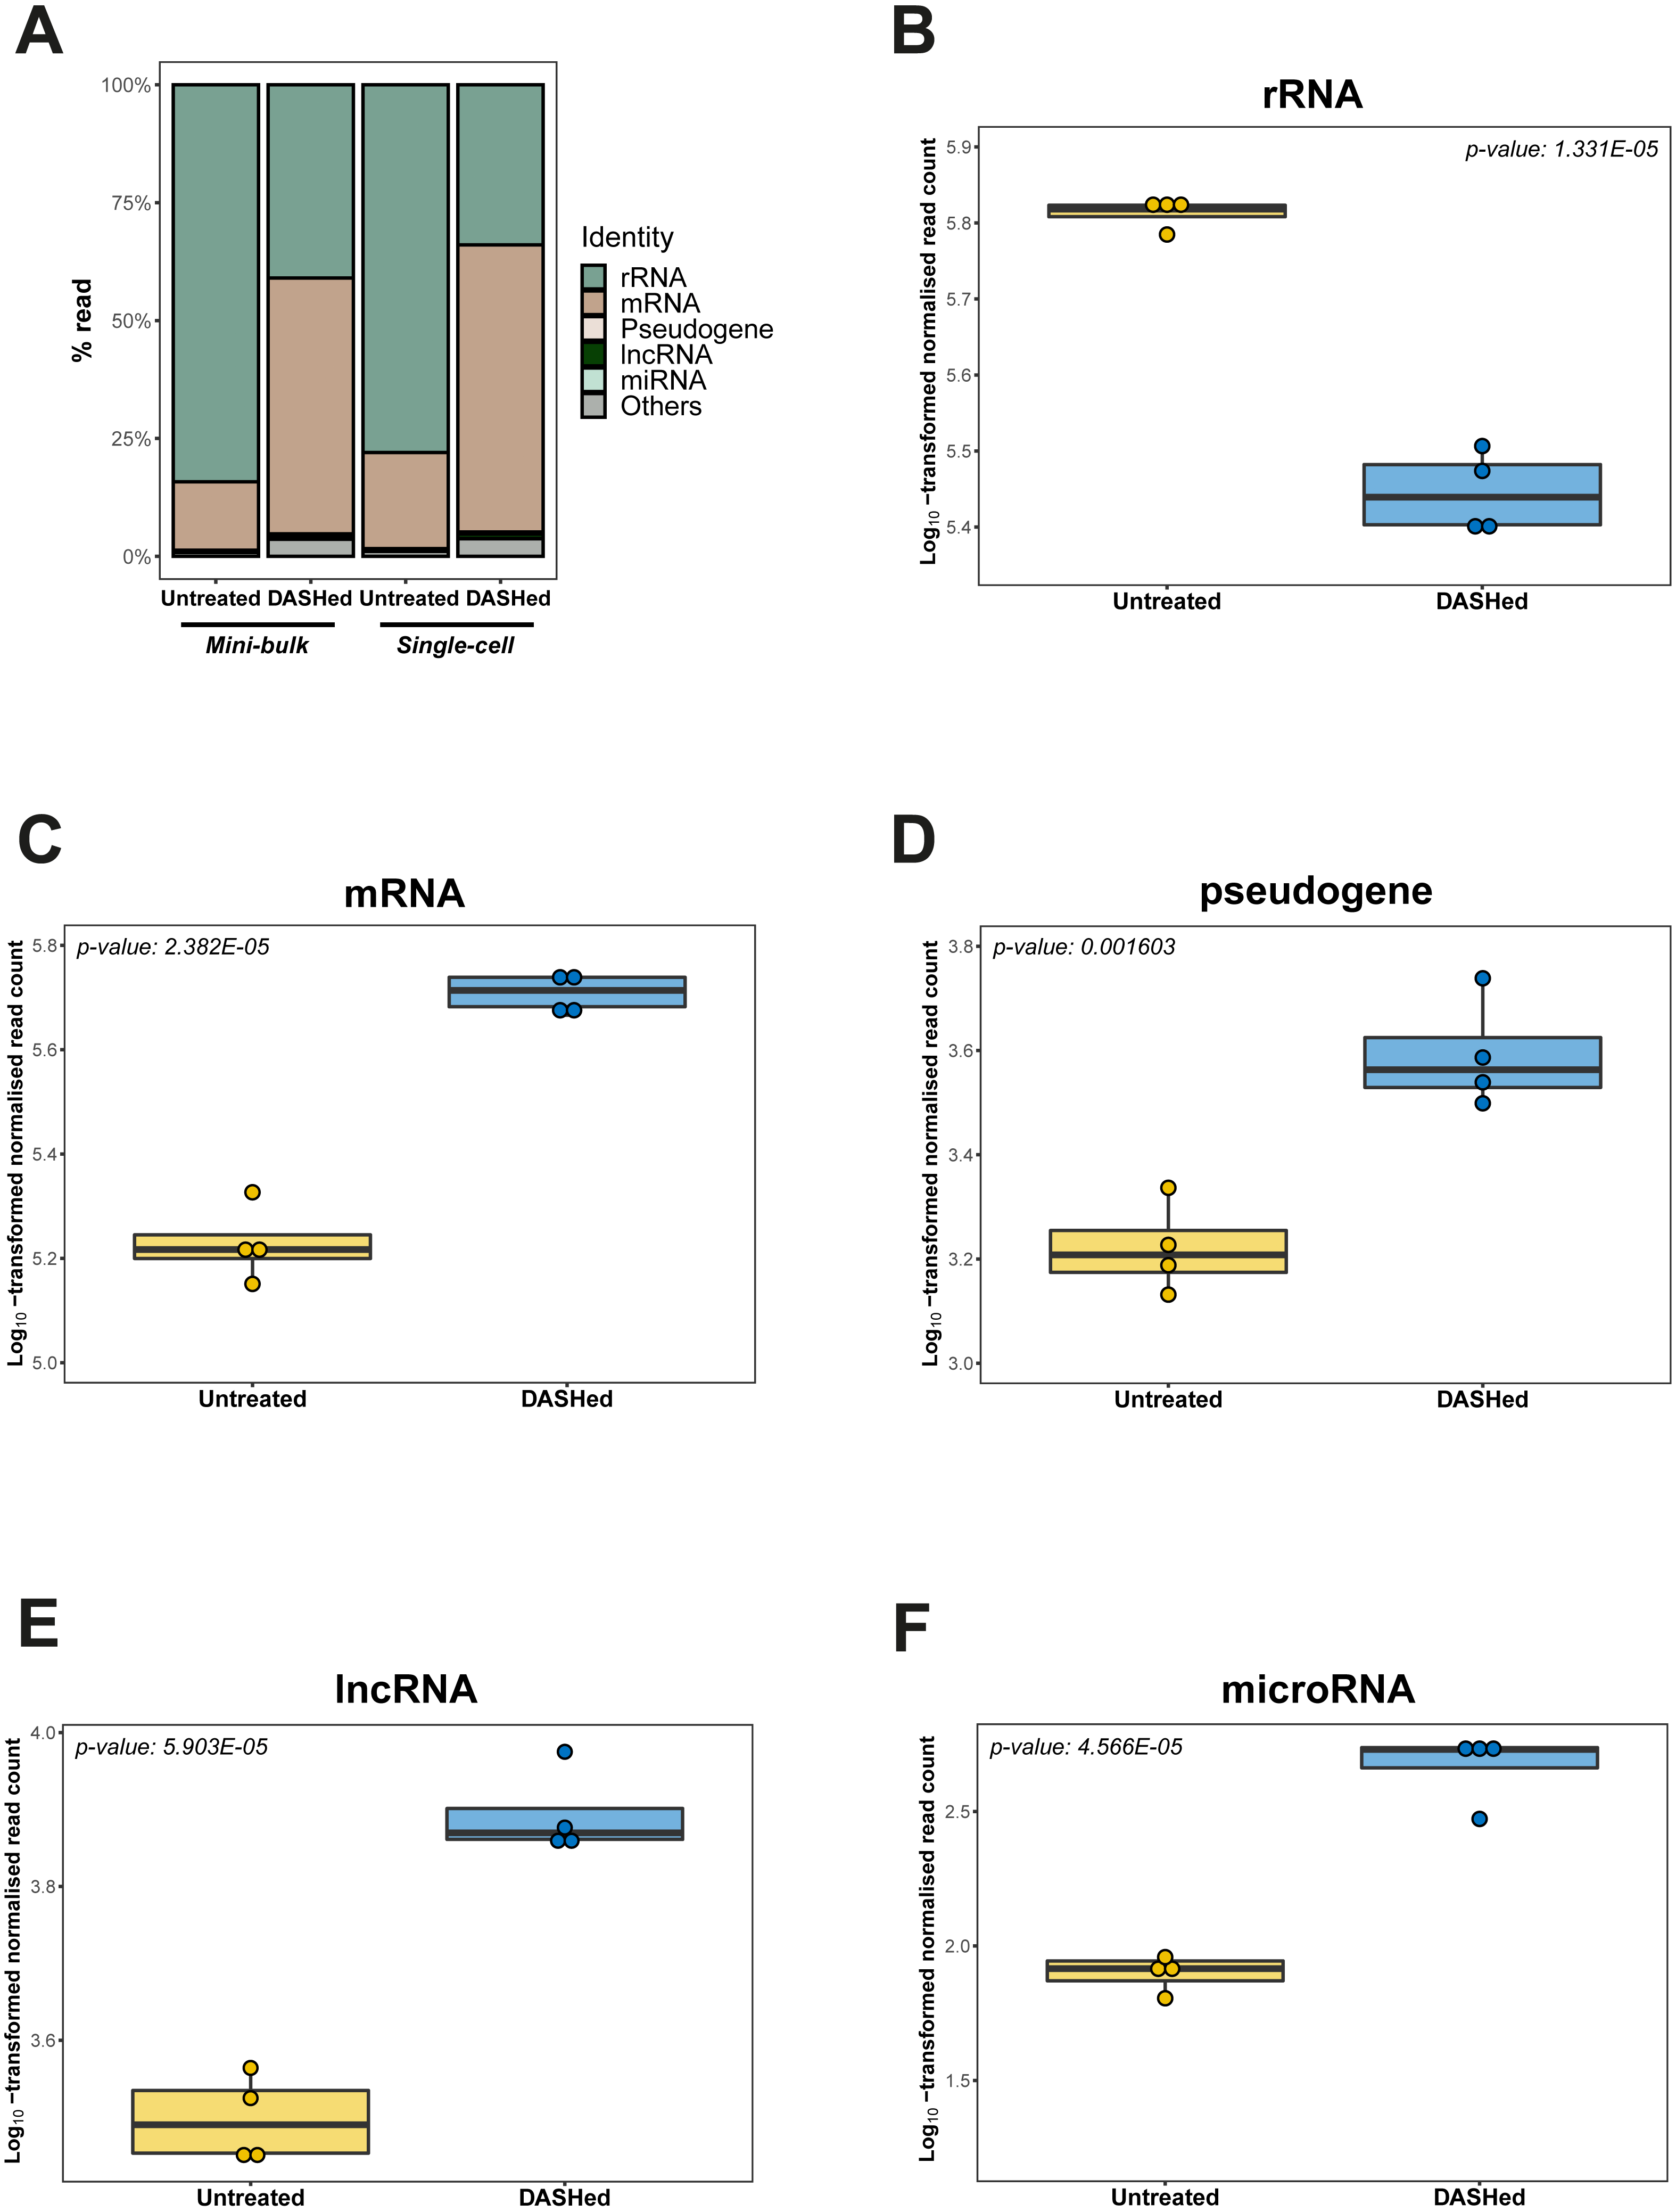
Discussion
One of the major challenges that hinders whole transcriptome studies at the single-cell level is the excessive rRNA sequences present in total scRNA-seq libraries, which results in lowered detection sensitivity for other RNA species and in turn higher sequencing costs to try and achieve sufficient coverage of these non-rRNA genes-of-interest. Until now, there have not been any practical solutions to deplete rRNA sequences from scRNA-seq libraries, and as such researchers are either restricted to using only bulk methods that mask important cellular heterogeneities; or have resorted to using only mRNA-seq methods, which could preclude interesting discoveries of non-mRNA biology. Depleting the most abundant rRNA transcripts from total RNA samples lowers sequencing costs and improves mapping statistics of other RNA species, but conventional approaches for removing rRNA, which deploy depletion prior to generating libraries, require large quantities of input material and therefore cannot be used directly for scRNA-seq. There has only been one existing rRNA depletion method that has been applied and successfully demonstrated in the context of scRNA-seq (Fang & Akinci-Tolun, 2016), but this method does not provide a sequence specificity against rRNAs, instead it depletes all abundant transcripts through exploiting the DNA reassociation kinetics. Such indiscriminate depletion could backfire as some abundant transcript species are implicated in regulatory functions such as small nucleolar RNAs (snoRNAs), and off-target depletion of arbitrary high-abundance transcripts could skew the measurement of gene expression level overall. Using a CRISPR-mediated strategy, we were able to both specifically deplete rRNAs from scRNA-seq libraries and also overcome the input requirement by depleting rRNAs after library amplification and pooling.
Apart from designing sgRNA to target the cytoplasmic rRNAs instead of the mitochondrially encoded ones, we have made other modifications from the original method described by Gu et al. (2016). First, we spaced the sgRNAs every 100 bp of the target sequence rather than 50 bp, which we then showed is sufficient to effectively deplete the target rRNA and enrich the whole transcriptome. Secondly, we optimized the Cas9:sgRNA ratio, and found that a ratio of 1:30, which is three times higher than what was reported in the original protocol, is able to achieve a more effective depletion. This might be due to the fact that a different set of sequences were targeted in our case, and previous literature has shown that Cas9 cleavage efficiency depends on both the sequence features of the target such as GC content and sgRNA secondary structure (Liu et al., 2016b). A higher ratio could also potentially compensate for degradation of sgRNAs or for the lower concentration of target since scRNA-seq libraries are typically lower in concentration than standard sequencing libraries. However, it is best to titrate the concentration of sgRNA relative to Cas9 and determine the optimal ratio that works best for your application in your biological context. Using 1 ng input of scRNA-seq pooled libraries, we demonstrated a 70% depletion of cytoplasmic rRNAs with minimal perturbation to untargeted regions of the transcriptome. An overall elevation in the coverage of mRNA and other non-rRNA non-coding transcripts reflects a redistributed sequencing quota from depleted rRNA, implying that a higher sequencing depth for transcripts-of-interest can be achieved at the same sequencing cost. Furthermore, literature has shown that transcript capture through poly(A) binding typically yields a suboptimal (∼5–20%) efficiency (Macosko, 2020); by employing poly(N) capture primers in addition to poly(A) capture primers, the overall capture efficiency might be further increased, thus increasing the sensitivity of scRNA-seq. Previously, this would be at the expense of having to sequence uninformative rRNA, but scDASH would enable a higher sensitivity while capturing the full set of transcriptome without loss of non-polyadenylated transcripts. This could potentially lead to a paradigm shift in the method design of scRNA-seq library preparation from profiling only mRNA to profiling total RNA. Indeed, the ability to sequence total RNA from single cells in a cost-effective manner is essential for certain biological studies. One example is the elucidation of the regulatory roles of lncRNA in the neural system. LncRNA exists in both polyadenylated and non-polyadenylated forms, and both can regulate cellular processes and disease developement (Zhang, Yang & Chen, 2014). Single-cell measurement of lncRNA expression is essential because many lncRNAs, both polyadenylated and non-polyadenylated transcripts, are detected at low levels in bulk tissues but exhibit high expressions in single cells and show cell type-specific expression (Liu et al., 2016a). However, since existing scRNA-seq methods typically enrich for polyadenylated transcripts, the current annotations of lncRNA expression in tissues remain incomplete and challenging at the single-cell level, especially in tissues with diverse cell types such as neural tissue. With scDASH, the expression profiles of both the polyadenylated and non-polyadenylated transcripts can now be obtained both accurately and with sufficient sensitivity.
While this study only focused on eliminating rRNA genes of cytoplasmic origin as a proof-of-principle, future experimentation could be extended to targeting also the mitochondrially encoded rRNA genes as a whole, as well as any other sequence fragments that may need to be removed. It will also be interesting to evaluate the enrichment of whole transcriptomes in other eukaryotic cell types. Taken together, we envision that scDASH, an effective yet affordable rRNA depletion method for scRNA-seq applications, will enable a view of cellular heterogeneity with an additional dimension in the context of non-coding transcripts. Ultimately, this fully unbiased approach will lead us to a deeper and more complete understanding of cellular regulatory networks and complex systems biology.
Conclusions
We established scDASH, a rRNA depletion method that is tailor-made for single-cell total RNA-seq applications. We achieved a 70% reduction in sequencing coverage of depleted rRNA genes, and 3.5-fold enrichment of informative reads from the rest of the transcriptome. scDASH-mediated depletion is demonstrated to be highly specific to the targeted sequences with minimal off-target effect.
Supplemental Information
Quality check on library size by Fragment Analyzer
Electropherogram showing size distribution of one single-cell MATQ-seq library.
qPCR quantification of 18S, 5.8S and 28S rRNA levels in untreated and DASHed scRNA-seq libraries
All data are represented as mean ± s.d.
Comparison of gene number detected in untreated and DASHed single-cell libraries
p-value was determined by Mann–Whitney U test (n = 4).
Mini-bulk RNA-seq analysis agrees with enhanced detectability of whole transcriptome after scDASH treatment
(A) Comparison of gene number detected in untreated and DASHed libraries. Each dot represents one mini-bulk library. (B) Comparison of rRNA level (in read count) detected in untreated and DASHed mini-bulk RNA-seq libraries. (C) Comparison of mRNA level (in read count) detected in untreated and DASHed mini-bulk RNA-seq libraries. (D) Comparison of pseudogene level (in read count) detected in untreated and DASHed mini-bulk RNA-seq libraries. (E) Comparison of lncRNA level (in read count) detected in untreated and DASHed mini-bulk RNA-seq libraries (F) Comparison of microRNA level (in read count) detected in untreated and DASHed mini-bulk RNA-seq libraries. For (B) to (F), each dot represents mean of random subsamples of raw reads from a single library. Normalised read count is log10-transformed so as to approximate to a Gaussian distribution.