
Integrated analysis of lncRNA and mRNA reveals novel insights into cashmere fineness in Tibetan cashmere goats
- Published
- Accepted
- Received
- Academic Editor
- Rodolfo Aramayo
- Subject Areas
- Agricultural Science, Genetics, Genomics, Molecular Biology, Zoology
- Keywords
- Tibetan Cashmere goat, Cashmere fineness, lncRNA, mRNA, Integrate analysis
- Copyright
- © 2020 Fu et al.
- Licence
- This is an open access article distributed under the terms of the Creative Commons Attribution License, which permits using, remixing, and building upon the work non-commercially, as long as it is properly attributed. For attribution, the original author(s), title, publication source (PeerJ) and either DOI or URL of the article must be cited.
- Cite this article
- 2020. Integrated analysis of lncRNA and mRNA reveals novel insights into cashmere fineness in Tibetan cashmere goats. PeerJ 8:e10217 https://doi.org/10.7717/peerj.10217
Abstract
Tibetan cashmere goats are famous for producing the finest, softest and lightest cashmere fiber in China. The growth and development of skin are closely related to fineness and are the key factors affecting the quality of cashmere. To investigate the specific role of long noncoding RNAs (lncRNAs) and messenger RNAs (mRNAs) in regulating cashmere fineness of Tibetan Cashmere goats in the anagen phase, we conducted high-throughput RNA sequencing of fine-type and coarse-type skin tissues. We identified 2,059 lncRNA candidates (1,589 lncRNAs annotated, 470 lncRNAs novel), and 80 differentially expressed (DE) lncRNAs and their potential targets were predicted. We also identified 384 DE messenger RNAs (mRNAs) out of 29,119 mRNAs. Several key genes in KRT26, KRT28, KRT39, IFT88, JAK3, NOTCH2 and NOTCH3 and a series of lncRNAs, including ENSCHIT00000009853, MSTRG.16794.17, MSTRG.17532.2, were shown to be potentially important for regulating cashmere fineness. GO and KEGG enrichment analyses of DE mRNAs and DE lncRNAs targets significantly enriched in positive regulation of the canonical Wnt signaling pathway, regulation of protein processing and metabolism processes. The mRNA-mRNA and lncRNA-mRNA regulatory networks further revealed potential transcripts involved in cashmere fineness. We further validated the expression patterns of DE mRNAs and DE lncRNAs by quantitative real-time PCR (qRT-PCR), and the results were consistent with the sequencing data. This study will shed new light on selective cashmere goat breeding, and these lncRNAs and mRNAs that were found to be enriched in Capra hircus RNA database.
Introduction
The Tibetan cashmere goat (Capra hircus), an excellent cashmere goat breed in China, is famous for producing cashmere with the best quality and high yield and is well adapted to high-altitude areas, extremely harsh climates, and hypoxic environments (Song et al., 2016). The white cashmere goats of Ritu County and of Nima County in northwestern Tibet are known as the origin of cashmere goats in Kashmir. Cashmere is produced by the secondary hair follicles (SHFs), which plays a vital role in the production of better-quality wool (Liu et al., 2013; Yang et al., 2017). In general, SHFs likely go through anagen, catagen and telogen (Wang et al., 2020). Cashmere has played a critical role in the textile and cloth industry in mankind history, and the Tibetan cashmere is known as the “gem of fibers”. Cashmere fineness and production are essential factors for increasing its economic value. With the increasing demand for cashmere every year, breeding super-fineness and high-quality cashmere goats has become an urgent problem in cashmere goat breeding. It is therefore of great value to dissect the critical genes, signaling pathways, and their regulatory machinery underlying different cashmere fiber diameter in the cashmere goats.
Although some causal genes and mutations for cashmere diameter, crimp, and elasticity have been identified using QTL mapping, candidate gene analysis or GWAS analysis in cashmere goats (Bai et al., 2016; Liu et al., 2013; Wang et al., 2017a; Wang et al., 2017b), hair follicle morphogenesis and development involve complex regulatory mechanisms and need to be thoroughly examined. It has been demonstrated that the expression of relevant genes associated with cashmere fineness is under regulated by noncoding RNAs. Long noncoding RNAs (lncRNAs) are longer than 200 nucleotides and are transcribed from DNA, but they do not code for proteins (Cai et al., 2018; Liu et al., 2013). However, lncRNAs can regulate the expression of protein-coding genes at various levels, including epigenetic regulation (Du et al., 2020; Wei et al., 2020), transcriptional regulation (Fei et al., 2020; Lauer et al., 2020; Yin et al., 2019) and posttranscriptional regulation (Mangum et al., 2020; Zhang et al., 2020a; Zhang et al., 2020b), thereby influencing various biological processes, such as cell growth, cycle, development and gamete formation; epigenetics; and implantation (Kumar et al., 2019). Recent studies have reported the mechanisms of lncRNA in hair growth and development in cashmere goats and sheep. Zheng et al. (2019) identified vital differentially expressed (DE) lncRNAs and DE mRNAs between Liaoning cashmere goats and Inner Mongolia cashmere goats, suggesting that lncRNA XLOC_008679 and its target gene, KRT35, could be as candidates for regulating cashmere fineness. Nie et al. (2018) revealed the function of lncRNAs and mRNAs involved in primary wool follicle induction in carpet sheep and enriched several important hair follicle development signals. Wang et al. (2017a) and Wang et al. (2017b) integrated analysis of lncRNA, miRNA and mRNA in cashmere goat skin during anagen and telogen stage and revealed potential ceRNA regulatory networks. Sulayman et al. (2019) performed a comprehensive analysis of lncRNA and mRNA expression profiles during sheep fetal and postnatal hair follicle development demonstrated that the interaction between lncRNA and their target genes may regulated the development of hair follicles. However, the roles of lncRNAs in controlling cashmere fiber fineness have not been absolutely described.
In this study, we used RNA sequencing (RNA-seq) to investigate the characteristics of lncRNAs and mRNAs in two types of fiber diameters (fine cashmere fiber and coarse cashmere fiber) of Tibetan cashmere goat skin tissues and explore the regulatory networks of potential related genes. This study provides a useful reference for Tibetan cashmere goat genetic breeding and promotes the improvement of cashmere goat breeding.
Materials & Methods
Animal ethics
All animal experiments were strictly performed according to the guidelines established by the Animal Care and Use Committee of Xinjiang Academy of Animal Science (Approval number 2019009).
Sample collection
All sample Tibetan Cashmere goats were selected from the same flock and raised under the same nutritional conditions on the Tibet Naqu Nima Cashmere Goat Breeding Farm (longitude: 91°12′–93°02′E, latitude: 30°31′–31°55′N), China. We collected cashmere samples of 50 ewes at the age of 15-month-old in anagen stage from the left mid-side regions of each animal body, these ewes were artificially inseminated with fresh sperm from a single ram. The wool samples were sent to a commercial laboratory (Quality Standards Institute of Animal Husbandry, Xinjiang Academy of Animal Husbandry, Urumqi, China) for measuring mean fiber diameter (MFD) values. The measurements were following the standardized methods set by China Fiber Inspection Bureau (CFIB). According to the measured results, we selected 4 ewes with the lowest MFD values (average 12.04 ± 0.03 µm) as the experimental fineness type (F) group, and another 4 ewes with the highest MFD values (average 14.88 ± 0.05 µm) as the experimental coarse type (C) group, respectively. Scapular skin tissues were collected from these 8 Tibetan cashmere goats in vivo. From each piece of skin tissue, approximately two cm2 was immediately frozen by liquid nitrogen and stored at −80 °C until analysis.
RNA isolation, library construction and sequencing
Total RNA was isolated using the RNeasy mini kit (Qiagen, Germany), after which the RNA concentration and quality were determined by the Qubit®2.0 Fluorometer (Life Technologies, USA) and the Nanodrop One spectrophotometer (Thermo Fisher Scientific Inc., USA). The integrity of total RNA was assessed using the Agilent 2100 Bioanalyzer (Agilent Technologies Inc., USA), and samples with RNA integrity number (RIN) values above 7.0 were used for sequencing. One microgram of RNA was used as input material for the RNA sample preparations. Subsequently, 8 cDNA libraries for two types of skin samples were constructed using rRNA-depleted RNA with the NEBNext® Ultra™ Directional RNA Library Prep Kit for Illumina® (NEB, USA) following the manufacturer’s recommendations, each sample type contained four biological replicates. The libraries were sequenced on an Illumina NovaSeq 6000 platform (Illumina, USA), and 150 bp paired-end reads were generated. The raw data were assessed for quality using FastQC software (http://www.bioinformatics.babraham.ac.uk/projects/fastqc/). Clean reads were obtained by removing adapters and poly-N>10%, and low-quality reads in the raw data using the Fastx_toolkit (http://hannonlab.cshl.edu/fastx_toolkit/index.html). Then, clean reads were mapped to goat reference sequences (Capra hircus ARS1.93) using Hisat2 (Kim, Langmead & Salzberg, 2015). Reference genome and annotation files were downloaded from the Ensembl browser (https://www.ncbi.nlm.nih.gov/genome/?term=capra+hircus+ars1). According to the mapping results, Cufflinks (Trapnell et al., 2012) programs were used to assemble transcripts. The raw data has been deposited in the Sequence Read Archive (SRA) database (BioProject ID: PRJNA643003).
Identification of lncRNAs
Based on the splicing results of Cufflinks, lncRNA was selected as the final candidate lncRNA for subsequent analysis through a workflow: (1) The class_codes annotated by Cuffcompare (http://cole-trapnell-lab.github.io/cufflinks/cuffcompare/) (Trapnell et al., 2012) was used to screen the candidate transcripts. Only those annotated as “i”, “u” and “x” were retained, which represent potential novel intergenic, intronic and cis-antisense transcripts, respectively. Transcripts with class code “=” annotated by Cuffcompare were considered as known genes. (2) Transcripts with a transcript length > 200 bp and exon number > 2 were selected. (3) The read coverage of each transcript was calculated by Cufflinks, and the transcript with coverage > 3 in at least one sample was selected. (4) The class-code information originating from Cuffcompare was used to screen the candidate transcripts. Finally, the candidate lncRNA coding potential was predicted by the Coding-Non-Coding Index (CNCI) (score < 0) (Sun et al., 2013), Coding Potential Calculator (CPC) (0.9-r2) (score < 0) (Lei et al., 2007), Pfam-scan (E-value < 0.001) (Robert et al., 2016).
Analysis of differentially expressed (DE) lncRNAs and mRNAs
Gene abundance was expressed as fragments per kilobase of exon per million reads mapped (FPKM). Stringtie software (Kovaka et al., 2019) was used to count the fragment within each gene, and TMM algorithm was used for normalization. Differential expression analysis for mRNA and lncRNA were performed using R package edgeR (Robinson, McCarthy & Smyth, 2010). DE RNAs with p-values < 0.05 and —log2FoldChange— ≥ 1, considered as significantly modulated between the two groups, were retained for further analysis.
Enrichment analysis and protein-protein interaction (PPI)
All DE lncRNA target genes and DE mRNAs were analyzed by Gene Ontology (GO) and Kyoto Encyclopedia of Genes and Genomes (KEGG) (Kanehisa et al., 2008) pathway enrichment analyses using the GOseq R package (Young et al., 2010) (v1.18.0). The Benjamini–Hochberg (BH) method was used to adjust significant p-values. GO terms and pathways with p-values < 0.05 were considered to be significantly enriched. We investigated candidate gene-encoded functional PPI network by means of the STRING Genomics 11.0 database (Szklarczyk et al., 2015), and these interactions predicted active interaction sources from text mining, experiments, databases, co-expression, neighborhood, gene fusion, or cooccurrence. A global PPI network was built that is limited to interactions exhibiting high confidence, with scores over 0.7 and no more than 10 interactors. We further showed the network by Cytoscape 3.6.1 software (Shannon et al., 2003).
Interaction and co-expression analysis of lncRNAs and mRNAs
We constructed a lncRNA–target gene network combining two instances of DE lncRNAs with their corresponding target genes, and the target genes of DE lncRNAs were predicted in cis. We further investigated the relationship between lncRNA and mRNA expression levels based on pearson correlations. If the expression levels of two transcripts exceeded a preselected threshold and were similar in the Pearson analysis, they would be considered to have a co-expression relationship and connected linearly, indicating a tight correlation. lncRNA or mRNA importance in the network depends on the degree of correlation. The absolute value of Pearson’s correlation coefficient (rP) ≥ 0.90 and p-value < 0.05 were reserved for further construction of the lncRNA and mRNA network. Two networks were created by Cytoscape 3.6.1 software (Shannon et al., 2003).
Quantitative real-time PCR validation
To identify the DE lncRNAs and DE mRNAs between fineness type and coarse type, we randomly selected six DE lncRNAs and six DE mRNAs to verify the expression levels by quantitative real-time PCR (qRT-PCR). The GAPGH gene was used as an internal control. Primers for real-time PCR were designed with Primer 5.0 (Table S1). qRT-PCR was carried out with a Bio-Rad CFX96 Real-Time PCR system (Bio-Rad, CA, USA) using TB Green® Premix Ex Taq™ II (TAKARA, Dalian, China). The 2−ΔΔCt method (Livak & Schmittgen, 2001) was used to analyze the relative expression levels.
Results
Overview of high-throughput sequencing
We comprehensively profile the lncRNAs and mRNAs expressed in the skin of cashmere goats (Table S2). Ultimately, a total of 2,059 lncRNAs were identified, and we further analyzed their genomic context based on their orientation to local protein-coding genes and classified them into 66 exonic-sense lncRNAs, 50 intronic sense lncRNAs, 195 exonic-antisense lncRNAs, 55 intronic antisense lncRNAs, 92 bidirectional lncRNAs, and 1,601 long intergenic RNAs (lincRNAs). After excluding candidate lncRNAs with coding potential using the software CNCI, CPC and Pfam-scan protein domain analysis, 470 lncRNAs were identified (Fig. 1A), including 333 lincRNAs, 40 intronic lncRNAs and 97 anti-sense lncRNAs (Fig. 1B). In addition, 29,119 mRNAs were identified.
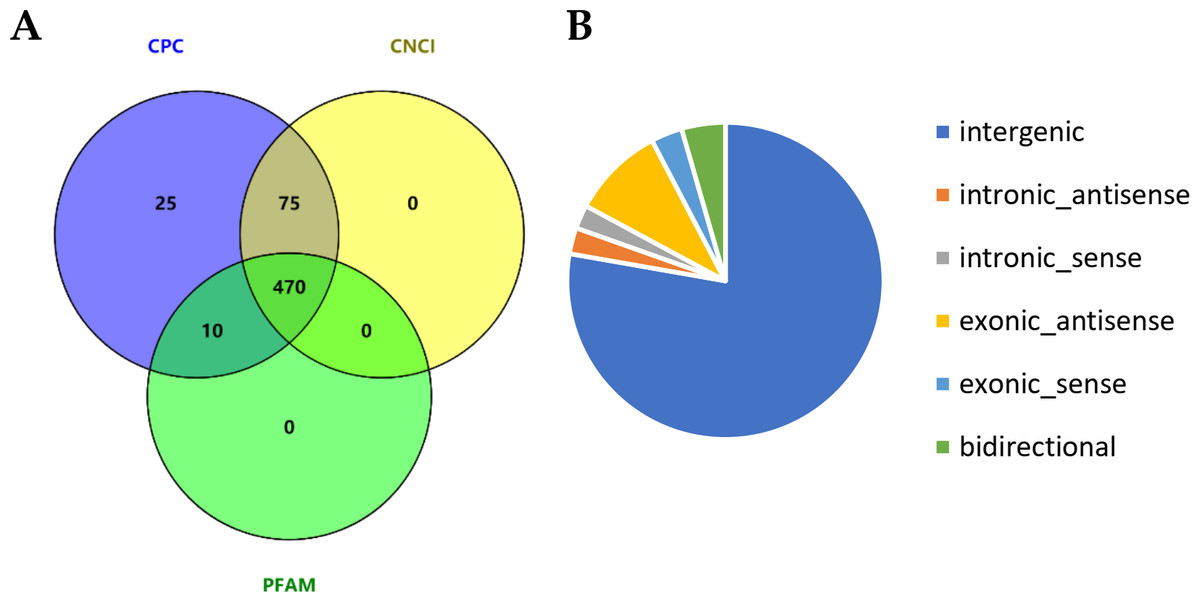
Figure 1: Identification of long noncoding RNAs (lncRNAs) in skin tissues of TibetanCashmere goats.
(A) Venn diagram showing the number of lncRNAs with coding potential analysis by CNCI, CPC and Pfam. (B) Pie chart of the category of lncRNAs.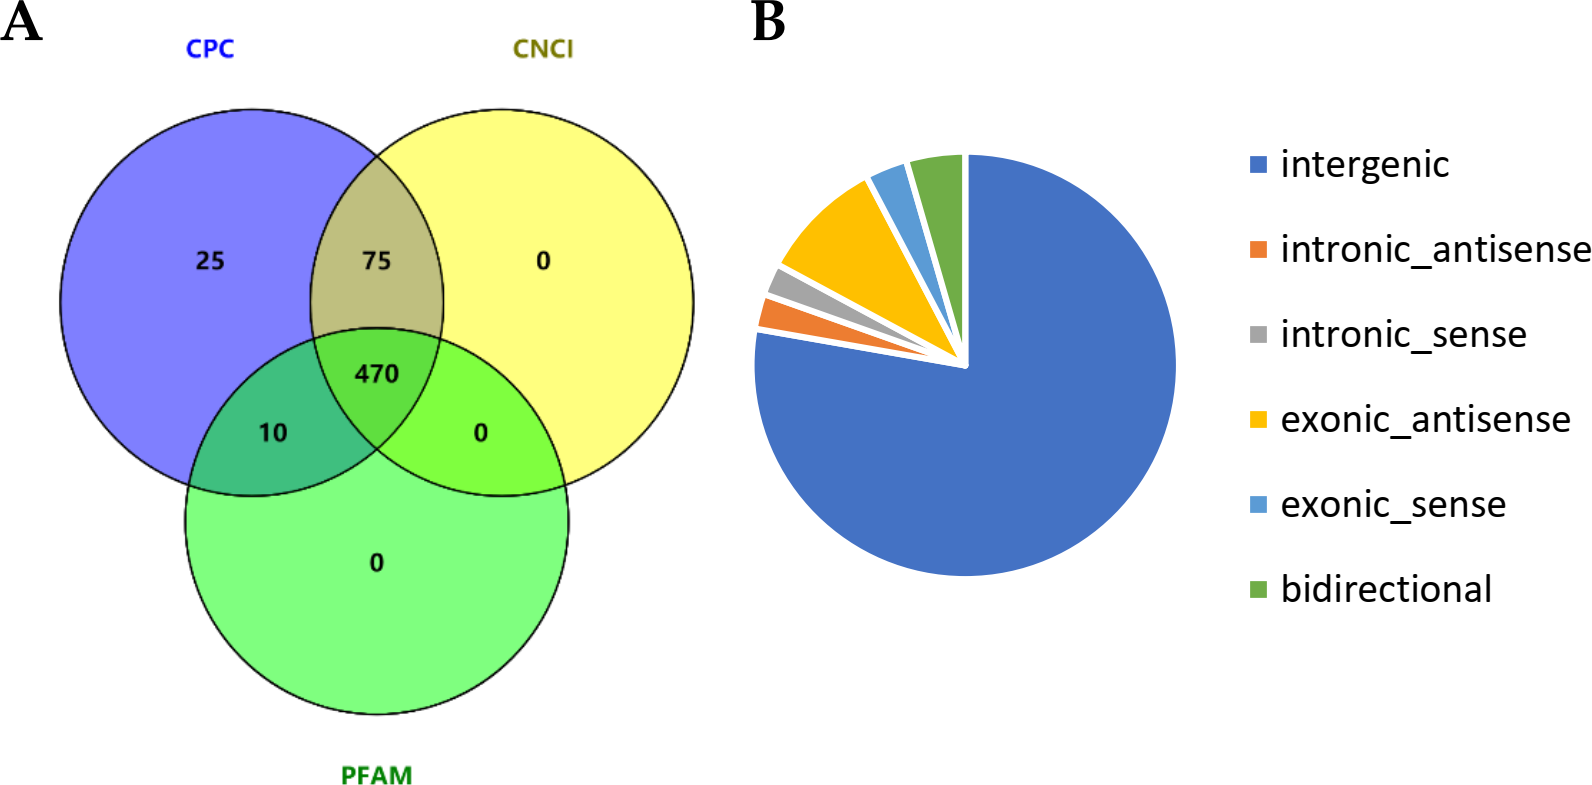
Comparison of genomic features between lncRNAs and mRNAs
We analyzed the characteristics of expression level, length, and exon number between lncRNAs and protein-coding genes to help us understand the structural features of these genes in cashmere goats (Fig. 2). The results showed that the expression levels of most detected lncRNAs were lower than those of protein-coding genes (Fig. 2A). LncRNAs tended to contain fewer exons than protein-coding transcripts, most of them were composed of 2 or 3 exons (Fig. 2B), and they were shorter than mRNAs due to having fewer exons (Fig. 2C).
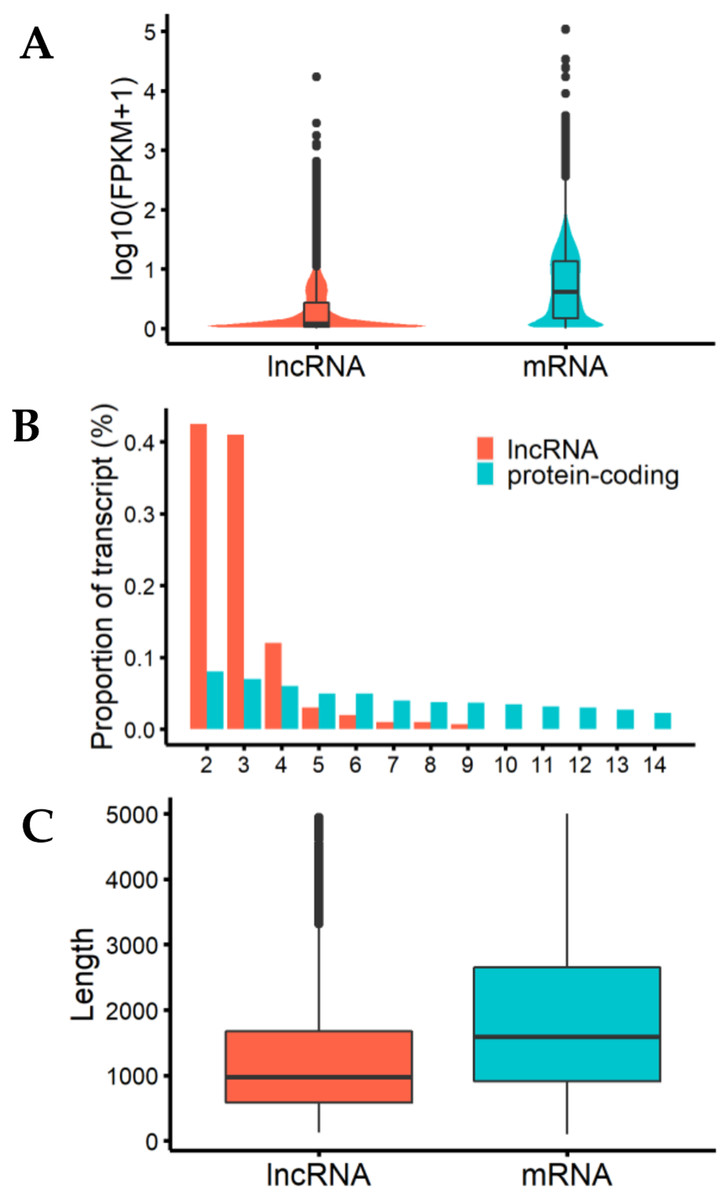
Figure 2: Characteristics of lncRNAs and mRNA.
(A) The expression level indicated by log10(FPKM+1) analysis of lncRNAs and messenger RNAs (mRNAs). (B) Exon number distribution of lncRNAs and mRNAs. The horizontal axis indicates the number of exons, and the vertical axis represents the proportion of transcripts. (C) Length distribution of lncRNAs and mRNAs; unit is bp.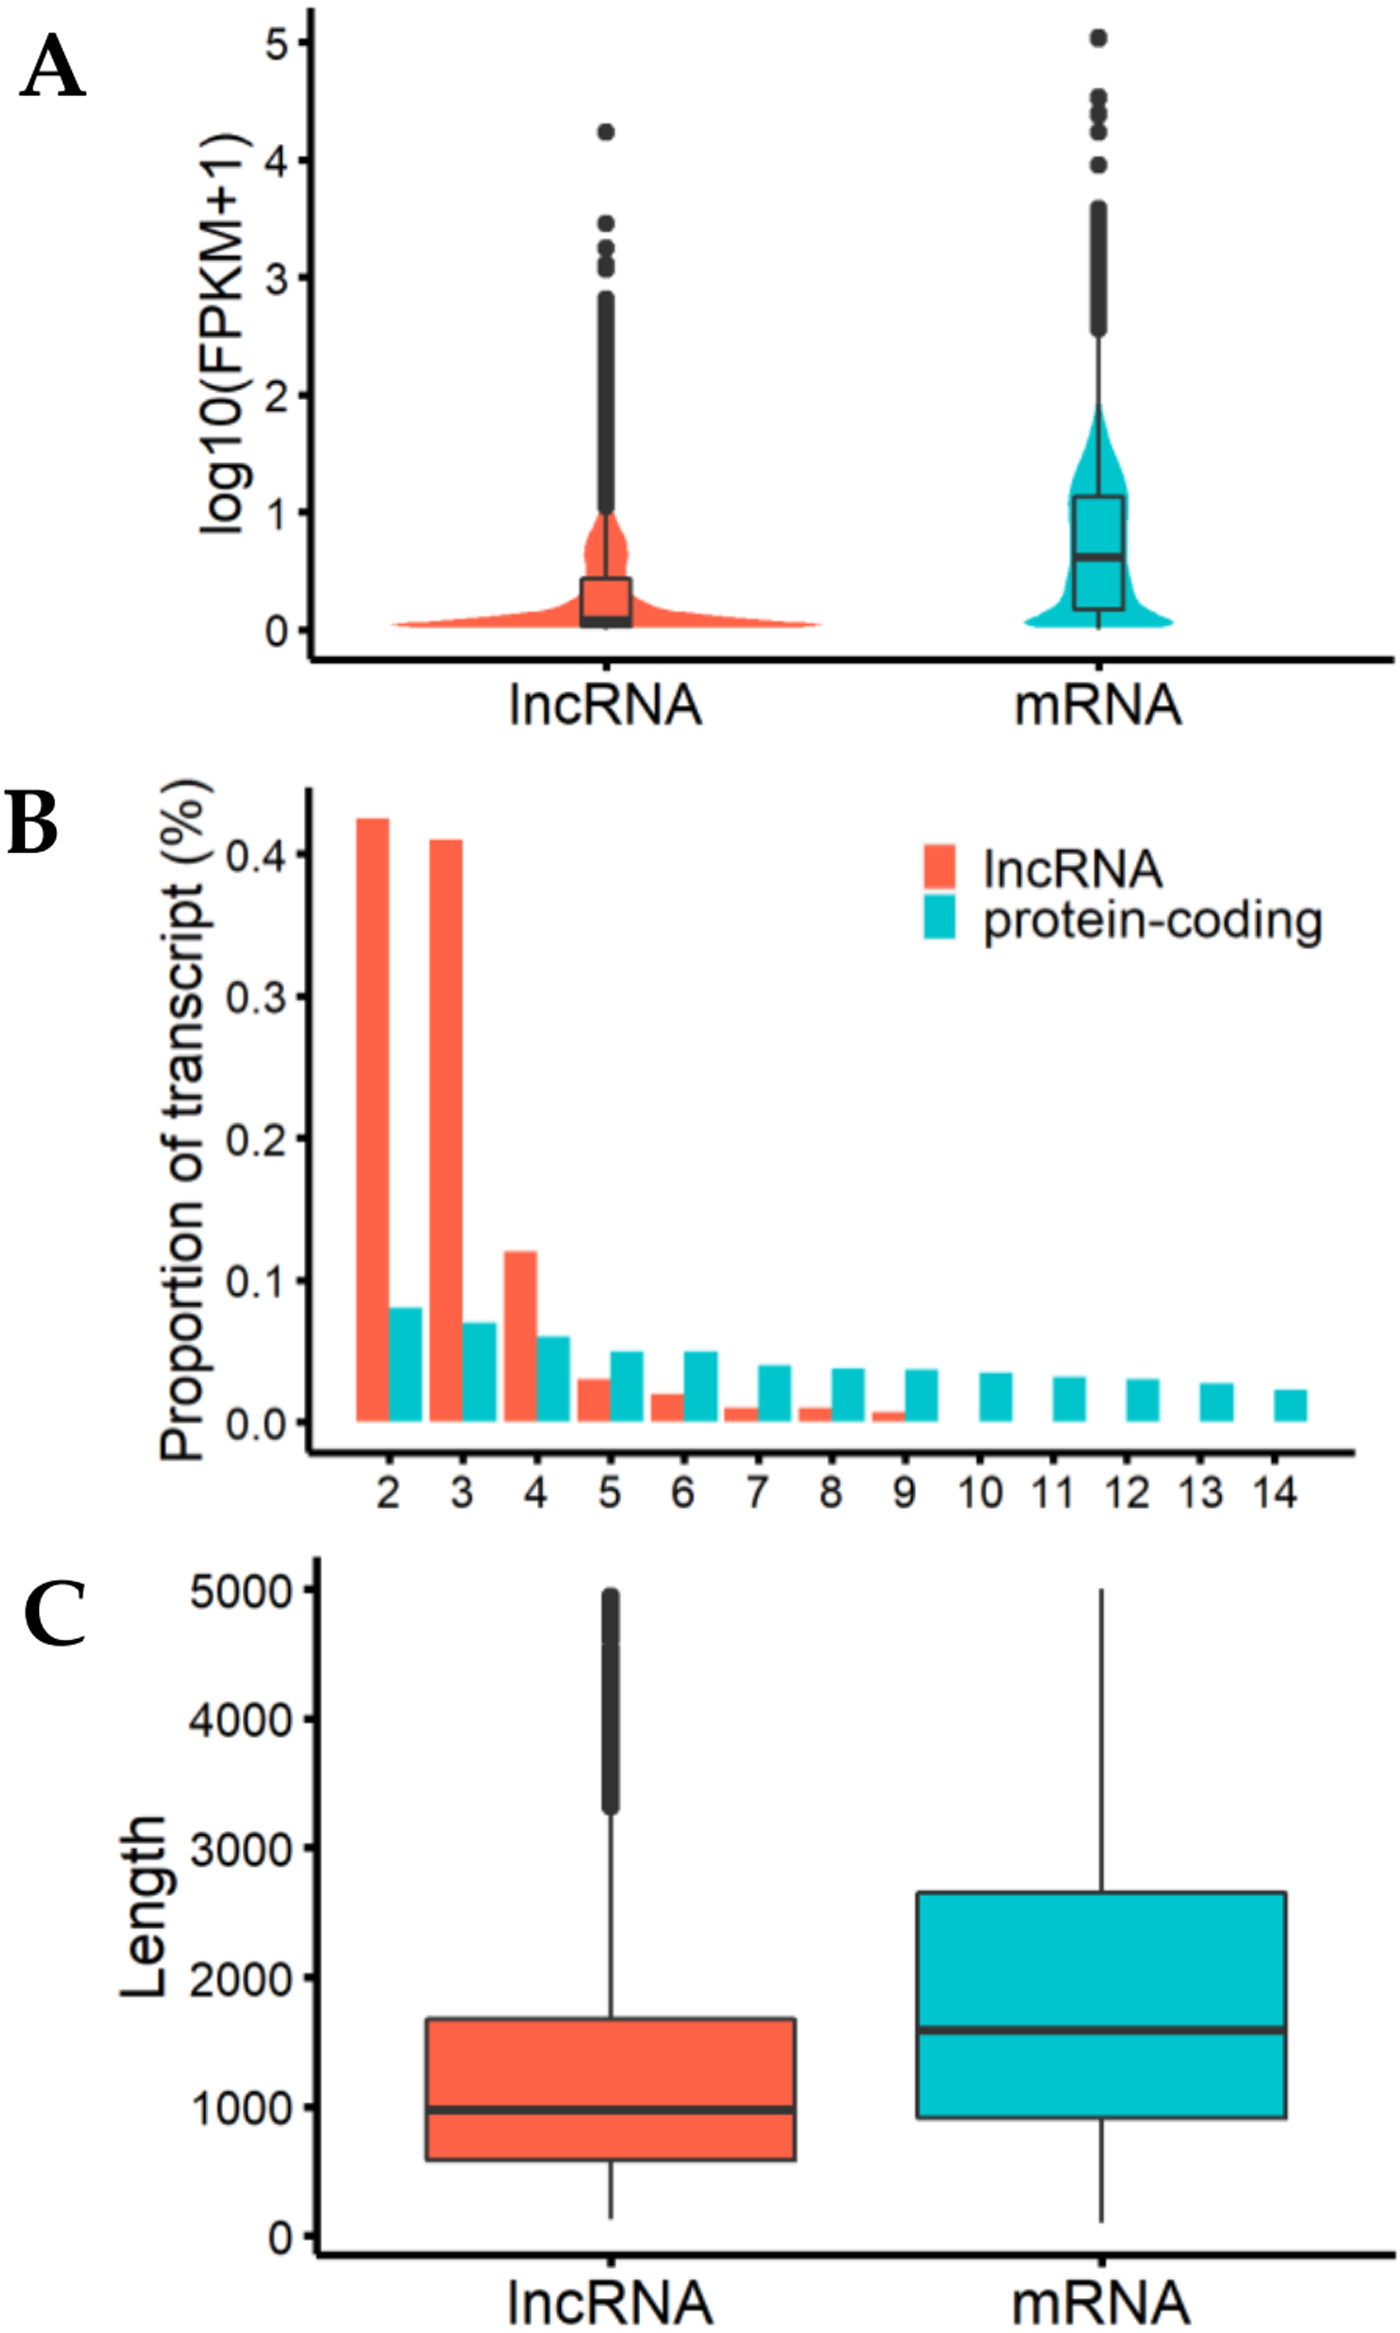
Differential expression analysis
We identified 80 DE lncRNAs (Fig. 3A) and 384 DE mRNAs (Fig. 3B) between the fine-type cashmere and coarse-type cashmere skin tissues in Tibetan Cashmere goats. Of these, there were 36 upregulated and 44 downregulated lncRNAs (Fig. 3A), together with 180 upregulated and 204 downregulated mRNAs (Fig. 3B) shown in the Volcano plots. Cluster analysis of DE lncRNAs and DE mRNAs was depicted in a heatmap, respectively (Figs. 3C, 3D). The results showed similar expression patterns and relationships in each group.
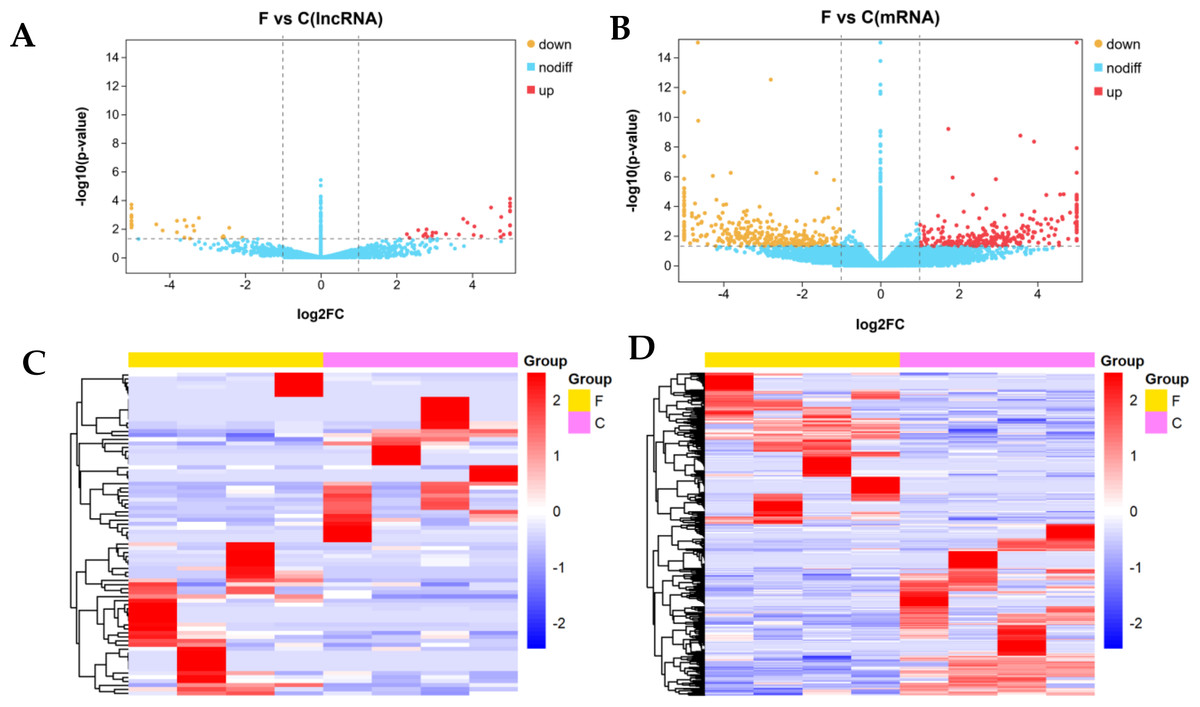
Figure 3: Differential expression analysis of lncRNAs and mRNAs (log2(fold change) ≥1 and p-value <0.05).
(A) The volcano plot of differentially expressed (DE) lncRNAs and (B) The volcano plot of DE mRNAs. The y-axis indicates the −log10(FPKM+1) values. Red and yellow indicate up regulation and down regulation, respectively. Blue indicates no significant regulation. (C) The clustered heatmap of DE lncRNAs and (D) the clustered heatmap of DE mRNA on the basis of their expression values. Red and blue indicate high and low expression, respectively. Yellow indicate fineness type (F) group, pink indicate coarse type (C) group.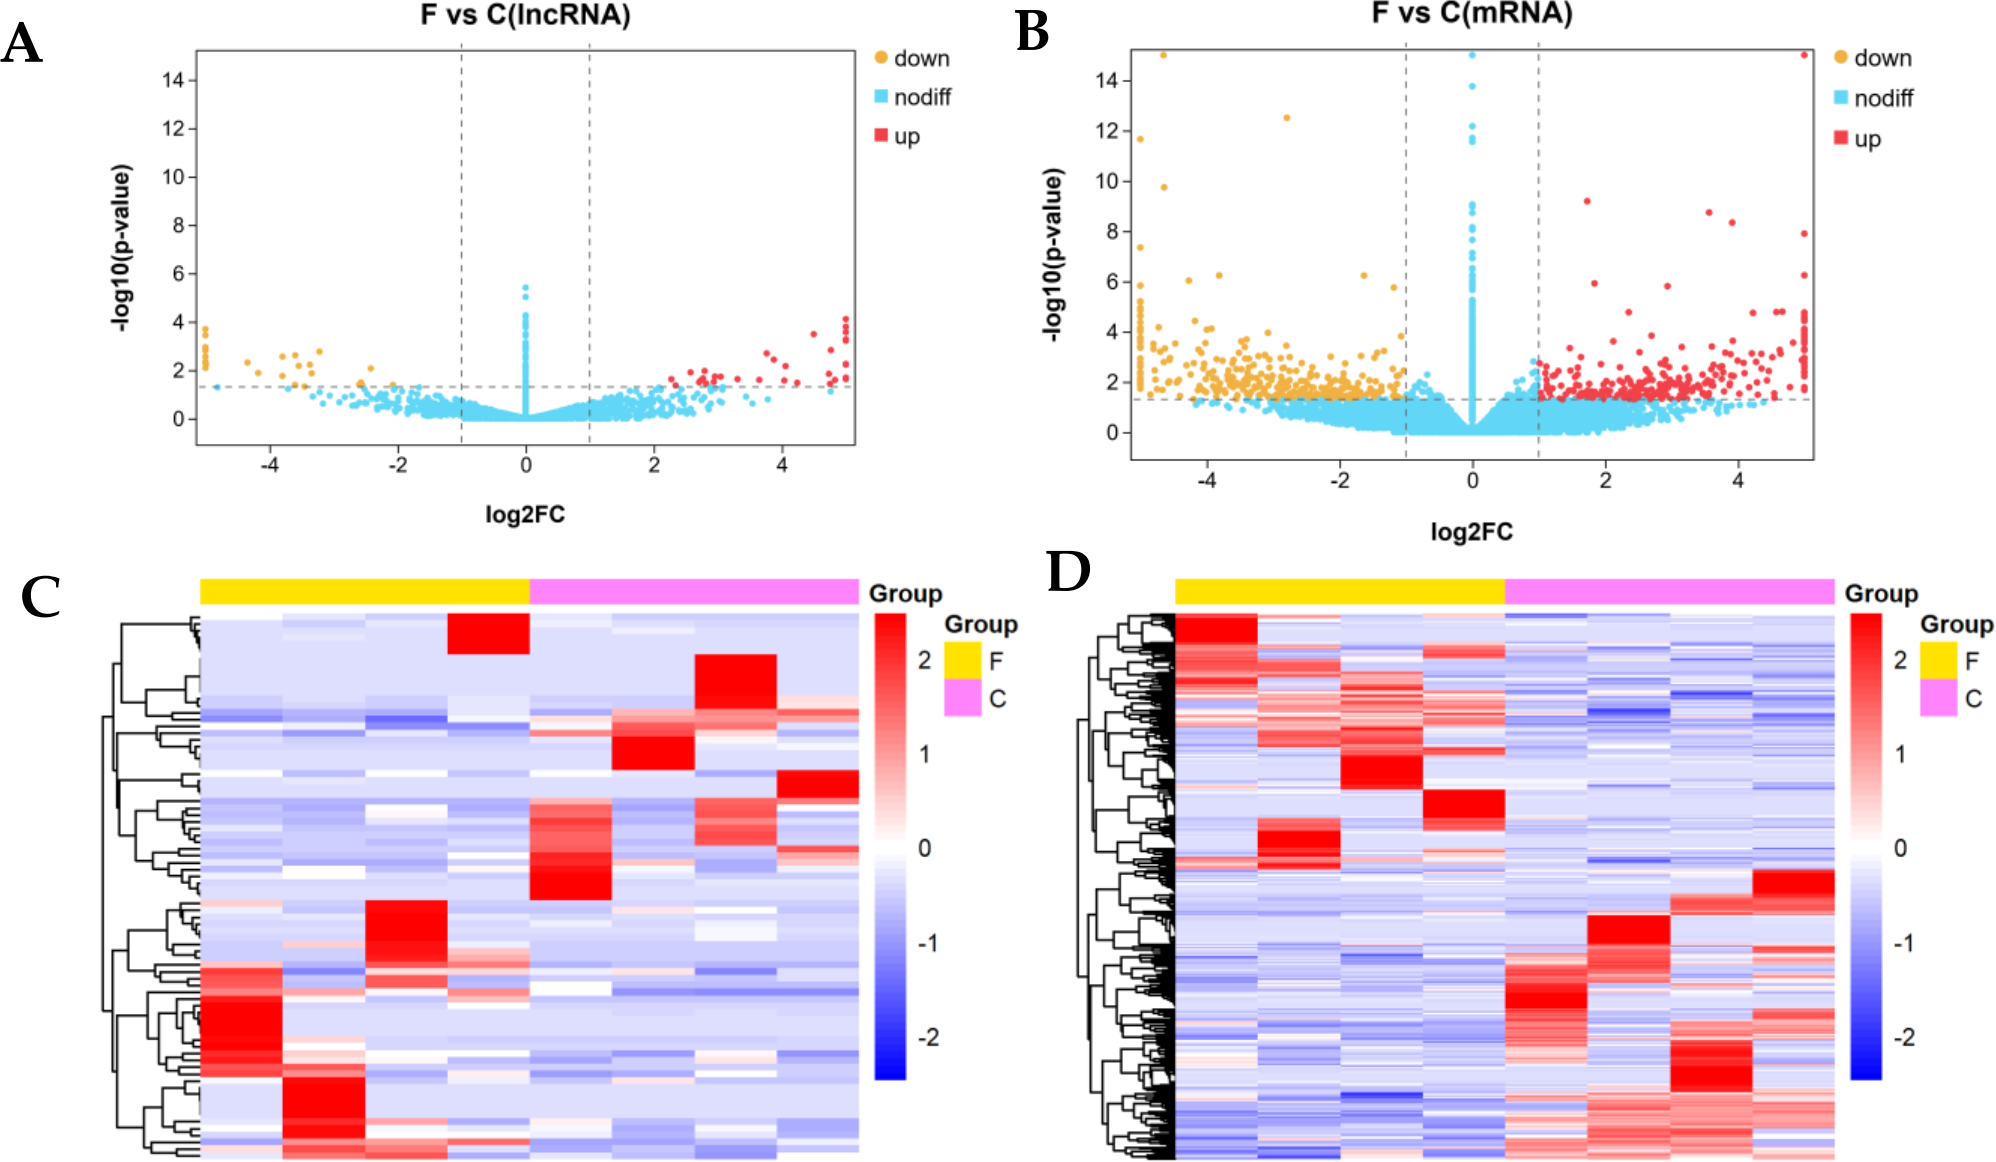
The top 10 DE lncRNAs and their potential target genes in fine-type cashmere goats and coarse-type goats are shown in Table 1. A total of 285 targets of 80 DE lncRNAs were predicted by in cis and trans principles, including KRT26, KRT28, KRT39, IFT88 and COL4A3BP, which are related to the hair follicle fiber growth. We also found that some DE genes might be involved in skin and hair follicle differentiation and development, including KRT85, KRT33A, NOTCH2, NOTCH3, FOS, FOSB, CXCL9, CXCL911 and COL4A3BP, and the details are shown in Table 2. Of all the target genes and DE genes, a total of 5 common genes were obtained, including ENSCHIT00000009853 targets were PCCB, DLG1, SELE, COL4A3BP and MSTRG.11347.5 target was DCAF11.
| LncRNA Transcript | Position | F_FPKM | C_FPKM | P-value | Target Genes |
|---|---|---|---|---|---|
| MSTRG.17376.2 | LWLT01001908.1:4610-5338 | 0 | 5.010 | 0.001 | ENSCHIG00000016125 |
| MSTRG.17376.3 | LWLT01001908.1:4622-5340 | 7.593 | 0.056 | 0.006 | ENSCHIG00000016125 |
| ENSCHIT00000009853 | 6:13019550-13051664 | 1.451 | 0.213 | 0.022 | KRT26, KRT28, KRT39, KIF21A, IFT88, DLG1 |
| MSTRG.17271.25 | LWLT01000556.1:8724-10271 | 1.439 | 8.432 | 0.043 | RF00002 |
| MSTRG.11347.5 | 29:44090904- 44100559 | 0 | 390.292 | 9.47E−06 | NLRP14, DCAF11, TARS |
| MSTRG.11347.6 | 29:44090904-44100559 | 0.586 | 532.950 | 0.001 | PDLIM4, CNKSR2, CFAP69 |
| MSTRG.11347.4 | 29:44090899-44101024 | 0.060 | 42.478 | 0.005 | C1orf87, SIRPB2, N6AMT1 |
| MSTRG.11347.7 | 29: 44090904- 44100559 | 0 | 215.907 | 0.0003 | SIRPB2, N6AMT1, ZNF274 |
| MSTRG.17247.9 | LWLT01000327.1: 13096-30756 | 1.133 | 0 | 0.002 | ENSCHIG00000011606 |
| MSTRG.6712.3 | 19: 40927180- 40952238 | 2.477 | 0.323 | 0.031 | ENSCHIG00000026924 |
| Gene name | Position | F_FPKM | C_FPKM | log2FoldChange | P-value |
|---|---|---|---|---|---|
| FOSB | 18:54128257-54134780 | 1.937872 | 0.476637 | 2.02351 | 0.000719 |
| CXCL10 | 6:91399075-91401954 | 2.722545 | 22.64108 | −3.05591 | 0.000692 |
| COL4A3BP | 10:94322997-94461870 | 0.05802 | 1.227794 | −4.40338 | 0.036278 |
| CXCL9 | 6:91375273-91380502 | 2.931417 | 18.43069 | −2.65244 | 0.001102 |
| FOS | 10:16631746-16635227 | 39.26566 | 13.06517 | 1.587543 | 0.001279 |
| KRT85 | 5:27244737-27256487 | 0.024061777 | 1.853753032 | −6.267562033 | 1.46E−05 |
| KRT33A | 19:41199485-41204437 | 0.335437 | 3.837226 | −3.51595 | 0.013361 |
| CXCL11 | 6:91418818-91419750 | 0.539136 | 4.955434 | −3.20029 | 0.004537 |
| NOTCH2 | 3:97175203-97350809 | 5.767431 | 13.09137 | −1.18261 | 1.77E−06 |
| NOTCH3 | 7:100760348-100797619 | 0.366461 | 1.654472 | −2.17464 | 0.006921 |
GO and KEGG functional enrichment analysis of DE lncRNAs and DE mRNAs
The top10 significant GO terms (p-value < 0.01) of DE lncRNA target genes and DE mRNAs are shown in Figs. 4A, 4B, respectively. GO terms of these lncRNA potential targets were highly enriched for several developmental processes, such as positive regulation of GTPase activity, generation of precursor metabolites and energy, and microtubule cytoskeleton organization involved in mitosis (Fig. 4A). The DE mRNAs were highly enriched for regulation of protein processing, positive regulation of the canonical Wnt signaling pathway, positive regulation of actin filament polymerization, maintenance of localization in cells and smooth muscle contraction (Fig. 4B).
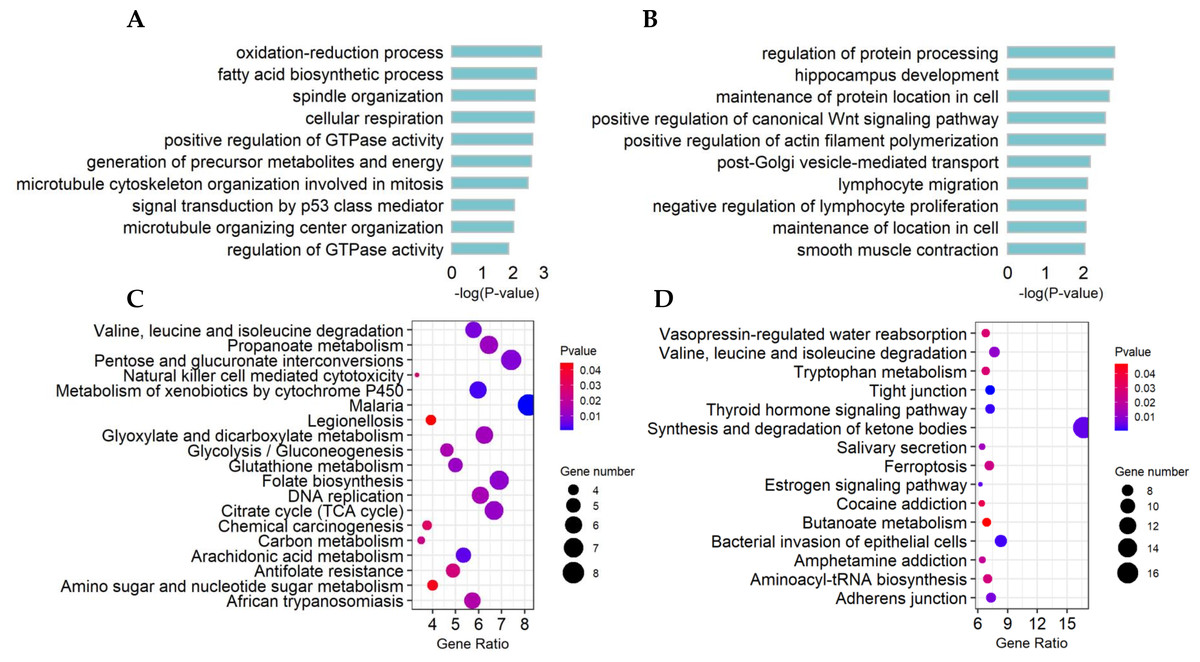
Figure 4: Functional and pathway enrichment of differentially expressed (DE) lncRNA target genes and mRNAs.
(A) Bar plots showing the top 10 significantly (p-value < 0.01) enriched GO terms in DE lncRNA targets and (B) DE mRNAs. The length ofthe bars indicates significance (−log10 p-value). (C) All significantly (p-value < 0.05) enriched KEGG pathways for DE lncRNA targets and (D) DE mRNAs.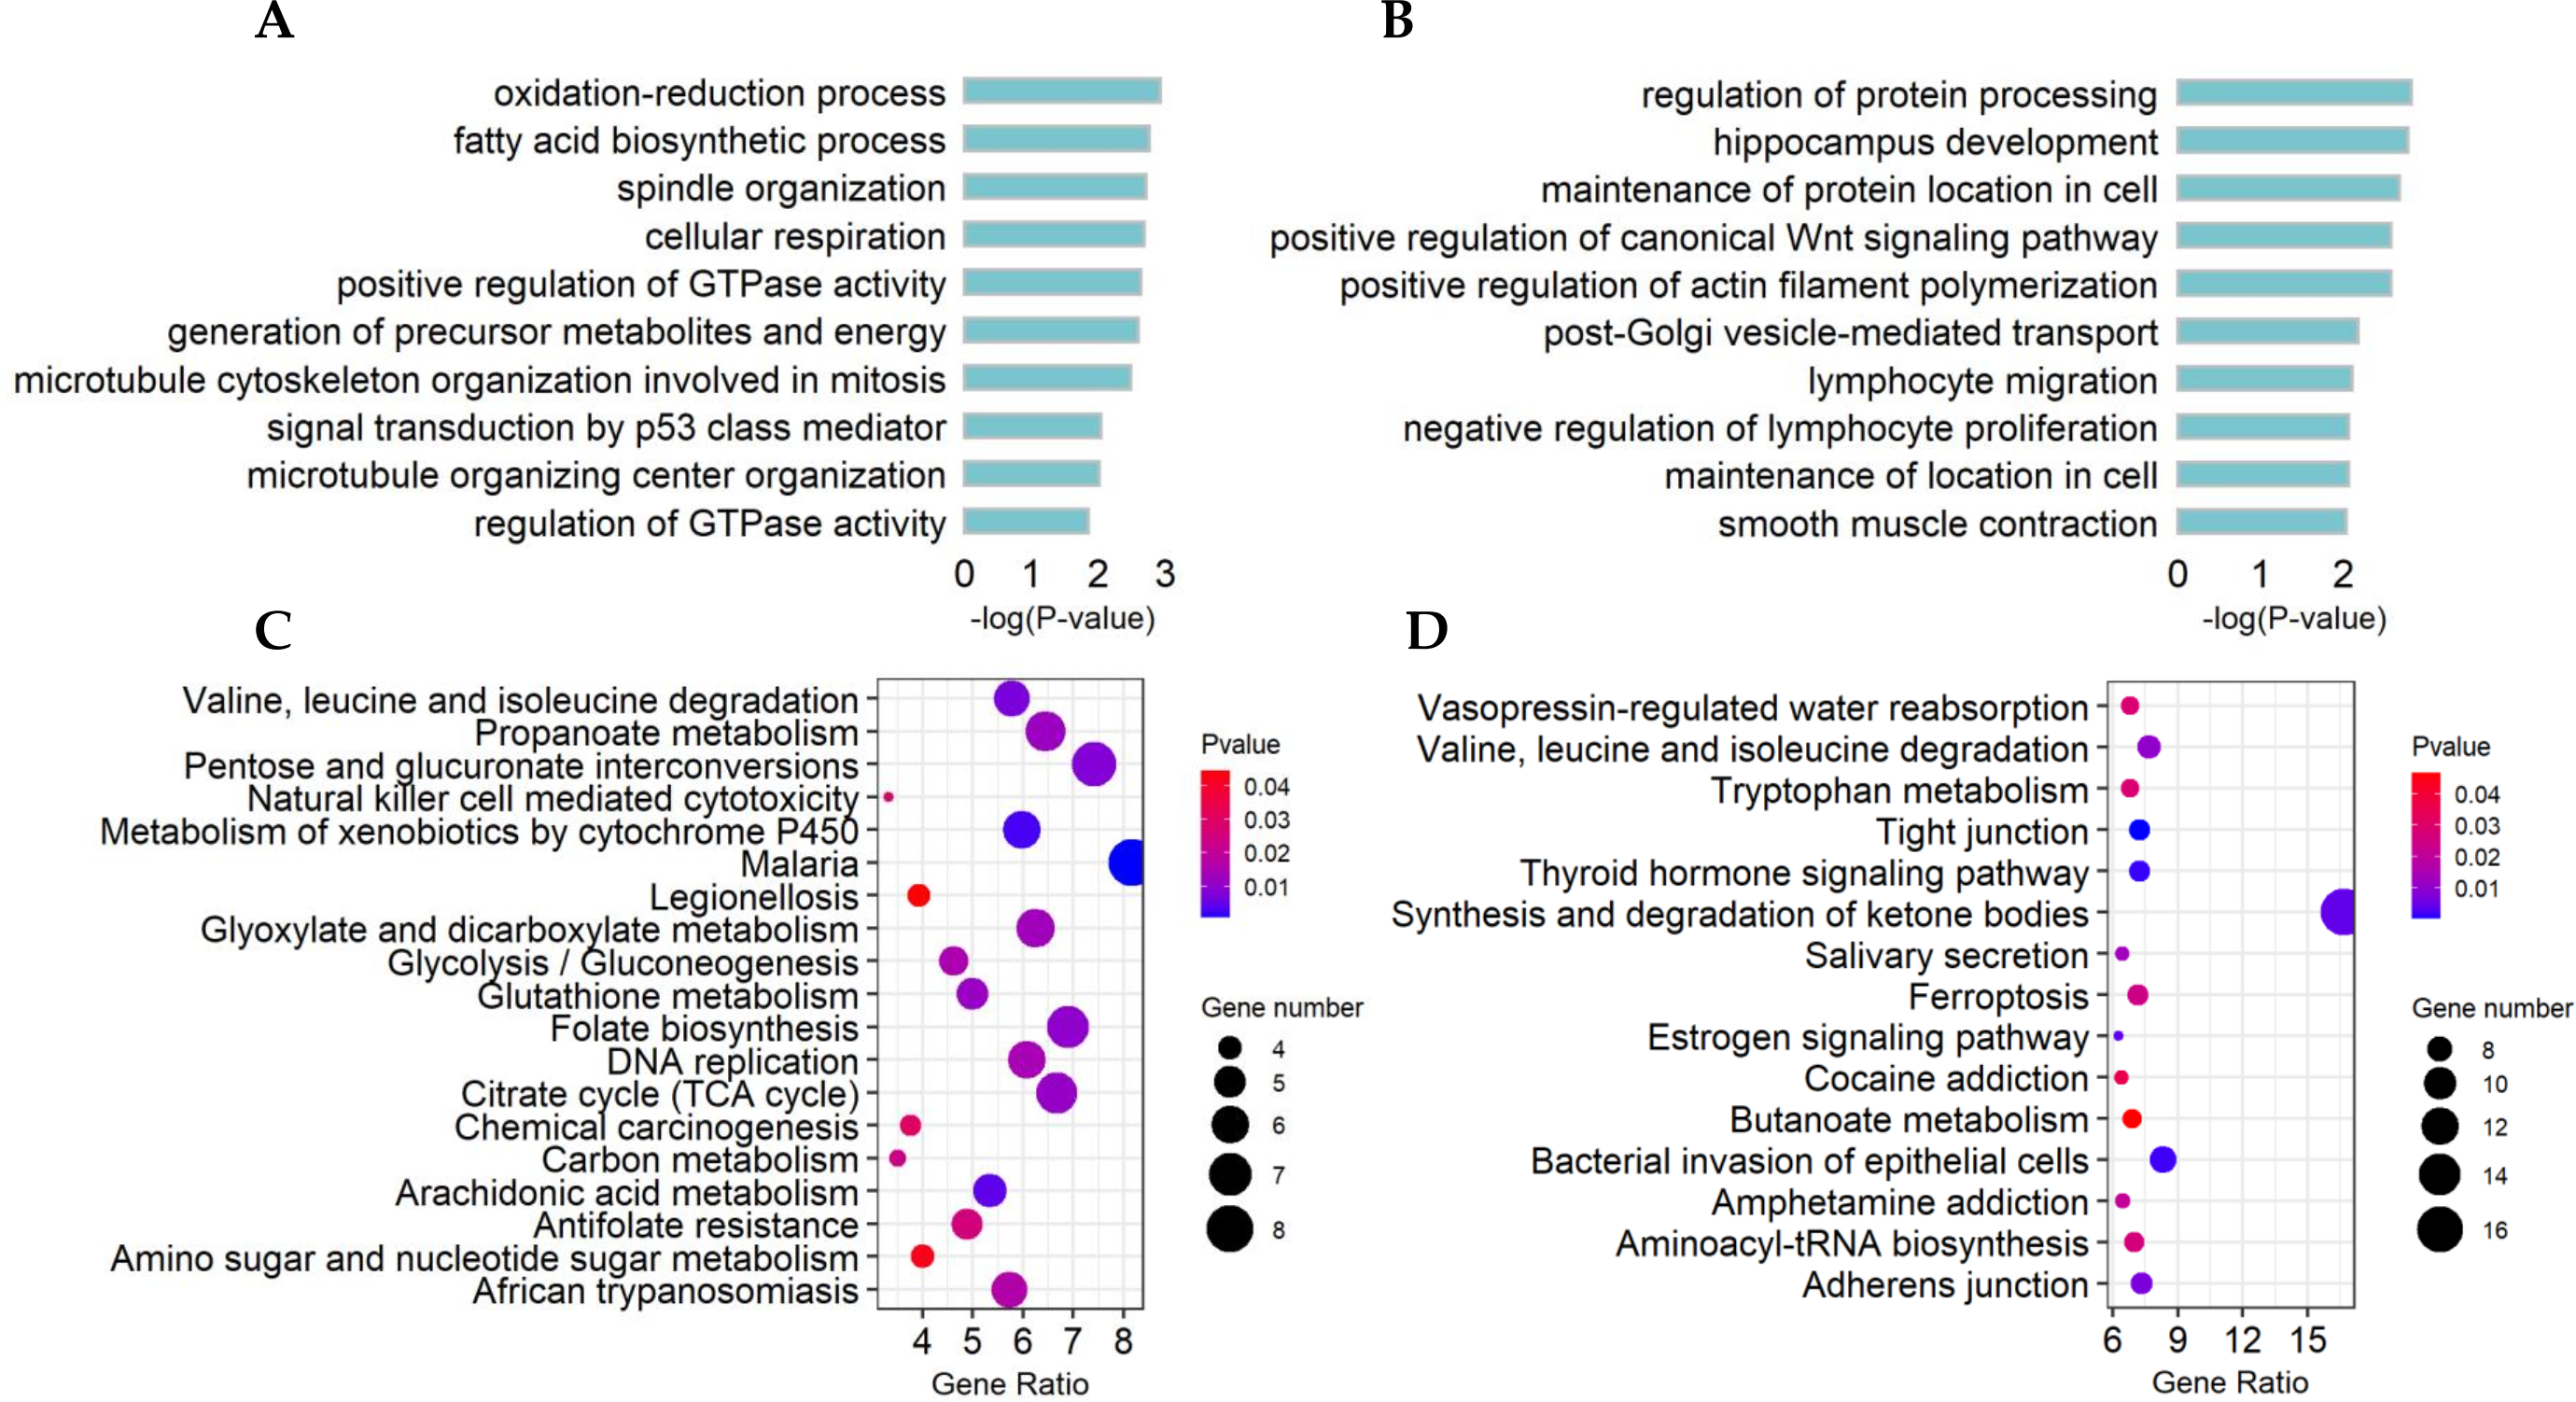
The significant KEGG pathways (p-value < 0.05) of DE lncRNA target genes and DE mRNAs are shown in Figs. 4C, 4D, respectively. For example, the propanoate metabolism, valine, leucine and isoleucine degradation, DNA replication and carbon metabolism were enriched in DE lncRNA target genes and might regulate hair follicle and skin development (Fig. 4C). KEGG analyses of DE mRNAs were also enriched in two of the four pathways mentioned above, including the propanoate metabolism pathway and valine, leucine and isoleucine degradation (Fig. 4D). PPI analyses were performed for the 265 most plausible candidate genes. The interaction network of proteins encoded by these genes was more extensive and significant than expected (72 edges identified; PPI enrichment p-value = 1.92 e−08; Fig. 5). The network revealed that PMSD3, PMSD11, PMSD14, and SRC were the core nodes. Several potential key DE mRNAs were enriched in the TNF signaling pathway (FOS, CXCL10), hippo signaling pathway (DLG1, DLG2, CDH1), adherens junction (SRC, CDH1, WASL), and focal adhesion (SRC, TLN1).

Figure 5: The interaction with differentially expressed (DE) mRNAs was analyzed using String software according to the interplay index (confidence >0.7).
The interplay index between genes was represented by the width and transparency of edges. Yellow and wide edges indicate high confidence.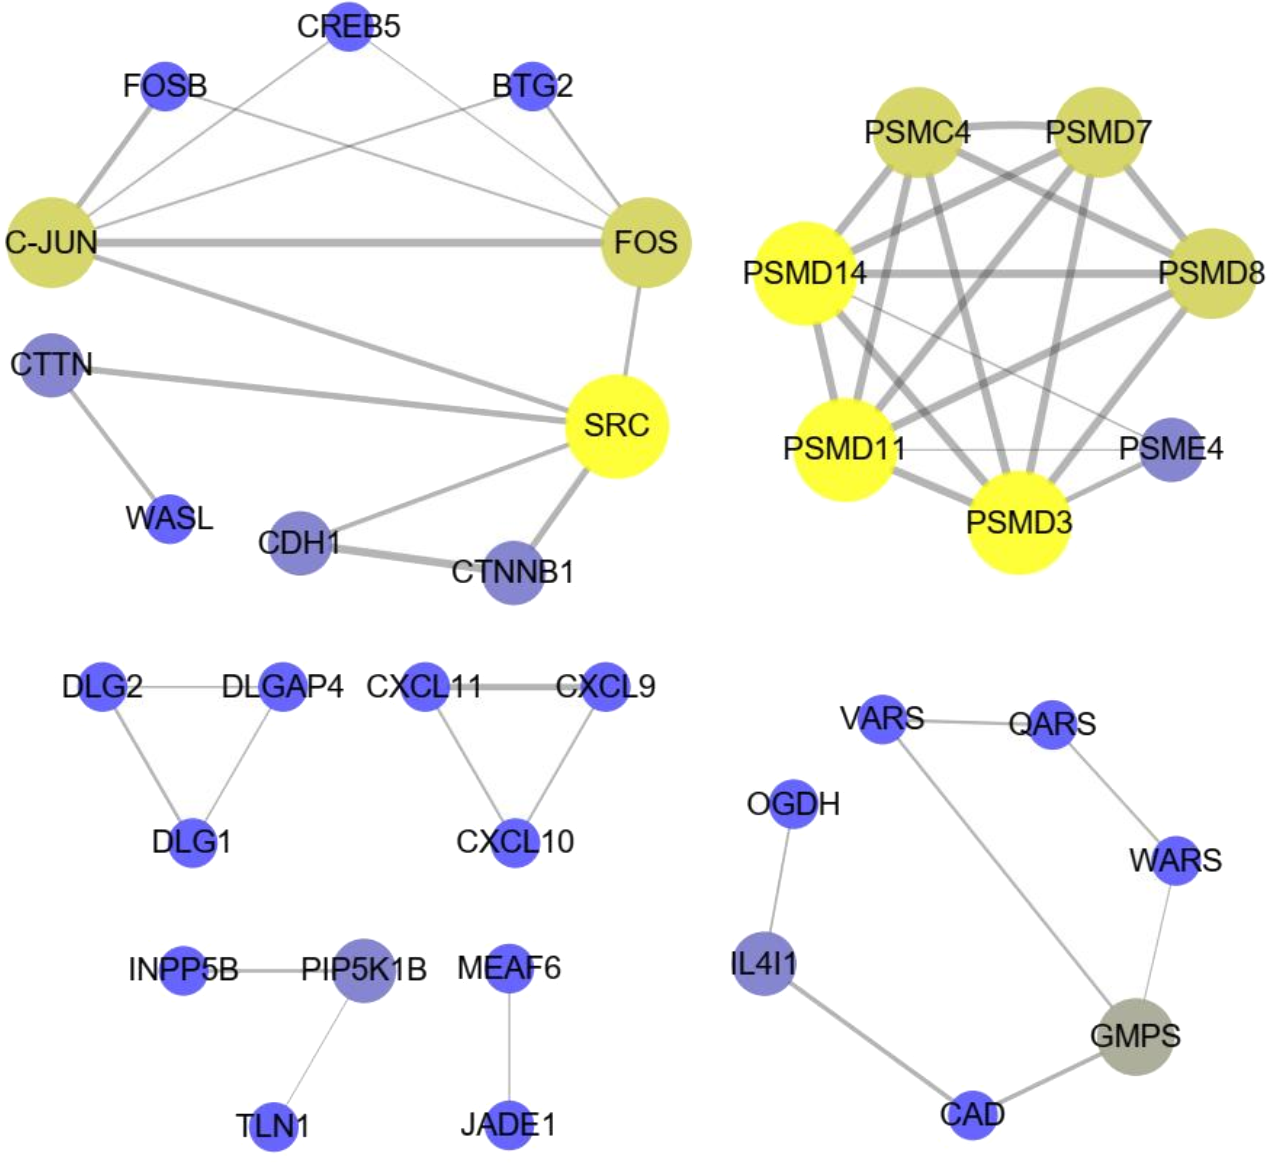
Network of lncRNAs and mRNAs
LncRNAs can regulate mRNAs by targeting their functions; therefore, we constructed an interaction network based on two interested DE lncRNAs and their target genes (Fig. 6A). ENSCHIT00000009853 targets were predicted to interact with keratins (KRT26, KRT28, KRT39), TNF signals (SELE, CASP7), notch signals (PSEN2), PI3K-Akt signals (PSEN2), and focal adhesion (VAV1), and MSTRG.16794.17 was predicted to interact with TNF signals (CASP7).
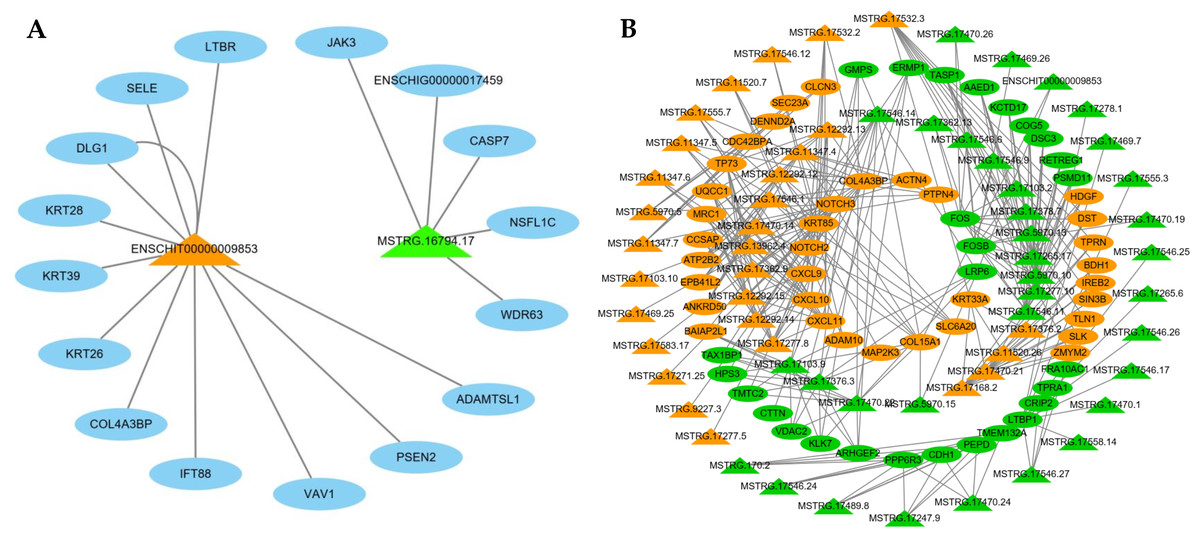
Figure 6: The network of differentially expressed (DE) lncRNA.
(A) Functional network of the lncRNAs and their target genes. Orange triangles represent up-regulated lncRNAs, and green triangles represent down-regulated lncRNAs. Blue ovals represent target genes. (B) Functional network of the DE lncRNAs and DE mRNAs. Triangular shapes and ovals represent DE lncRNAs and DE mRNAs, respectively. Orange and green represent up-regulated and down-regulated genes, respectively.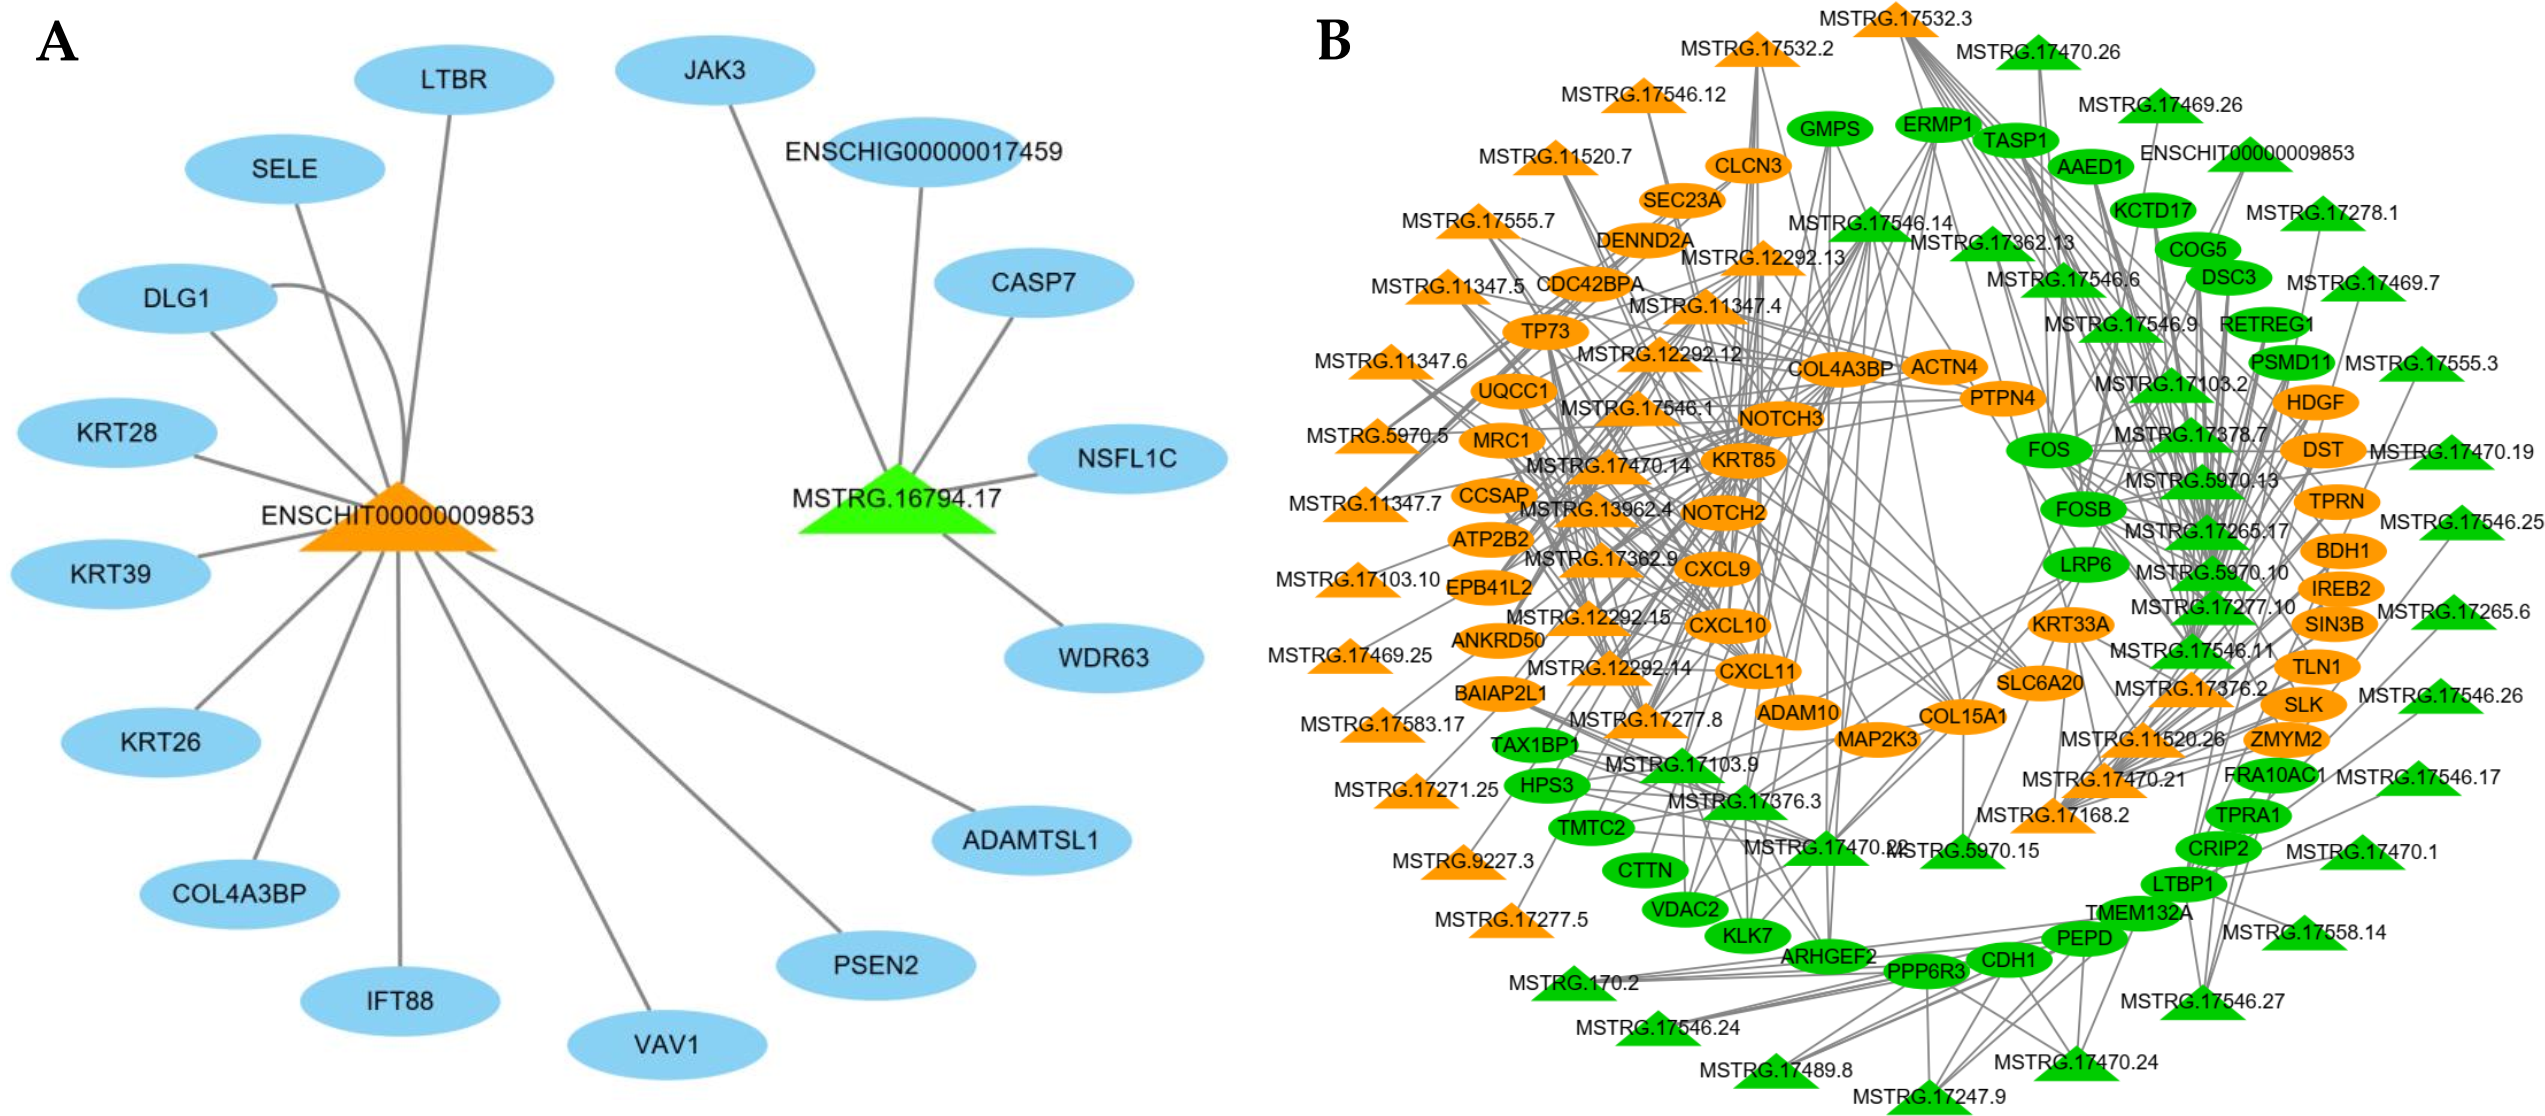
Meanwhile, we selected 65 significantly DE lncRNAs and 64 DE mRNAs to construct a co-expression network (Fig. 6B). This result demonstrates these DE lncRNAs were similar to the expression patterns of adjacent genes, constituted a complex regulatory network to regulate the cashmere fineness. For instance, MSTRG.17532.2 with high correlation with Notch2 and Nothch3.
Validation of lncRNAs and mRNAs by qRT-PCR
To validate the reliability of the RNA-seq data, six DE mRNAs, including COL4A3BP, SELE, KRT85, KRT33A, FOSB, and FOS, and six DE lncRNAs, including ENSCHIT00000009853, MSTRG.6712.3, MSTRG.5970.13, MSTRG.1727.25, MSTRG.17103.10 and MSTRG.9227.3, were randomly selected for qRT-PCR analysis. Figure 7 presents the expression levels of DE lncRNAs and DE mRNAs by qRT-PCR and were found to be consistent with the RNA-seq data. This indicated that our transcript identification and abundance estimation were highly reliable.
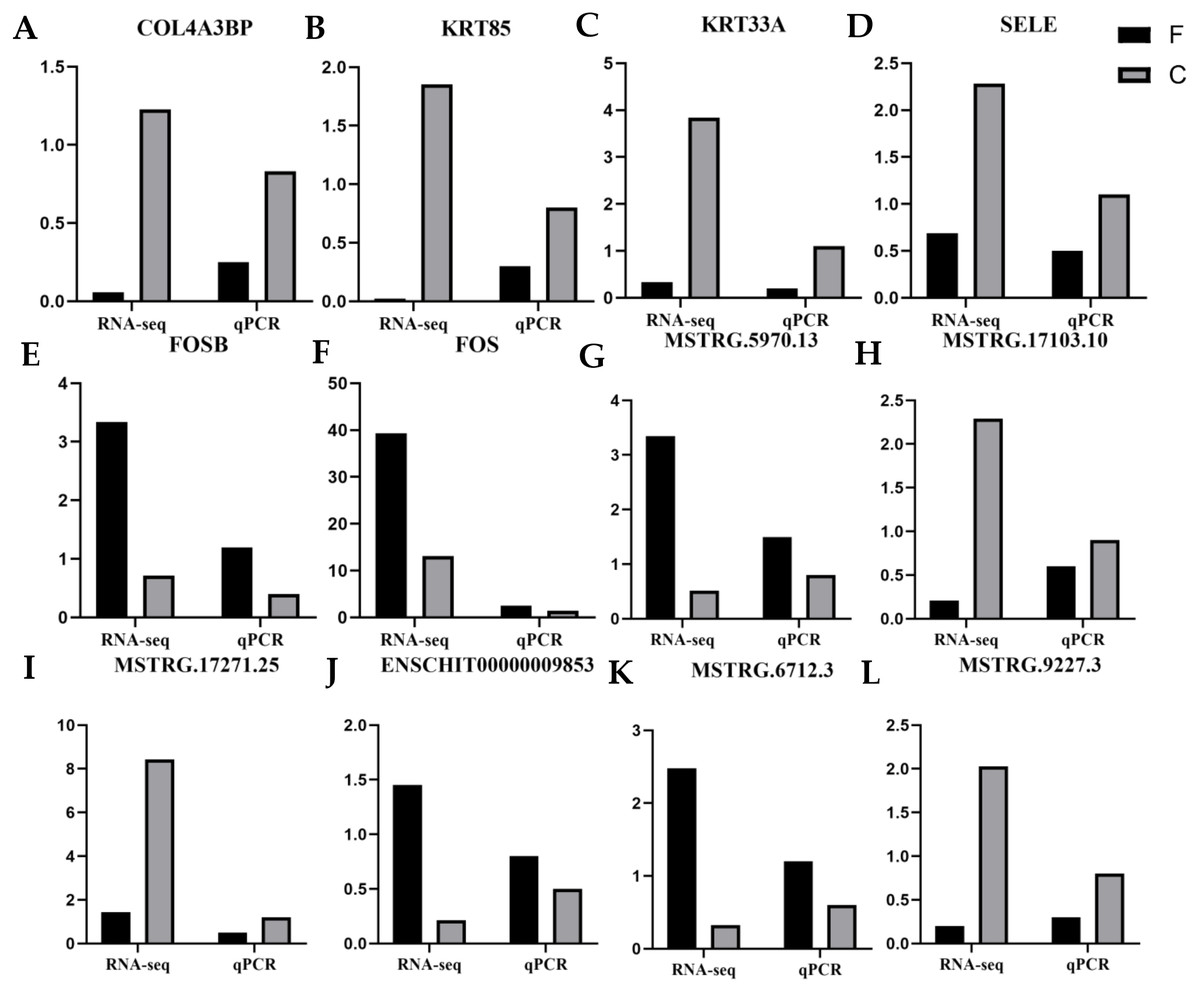
Figure 7: Quantitative real-time PCR (qRT-PCR) verification analysis.
(A–F) six candidate mRNAs. (G–L) six candidate lncRNAs. The FPKM values are indicated on the y-axis, and RNA sequencing (RNA-seq) and qRT-PCR are grouped on the left and right x-axis, respectively. Black represents fineness type (F) group, grey represents coarse type (C) group.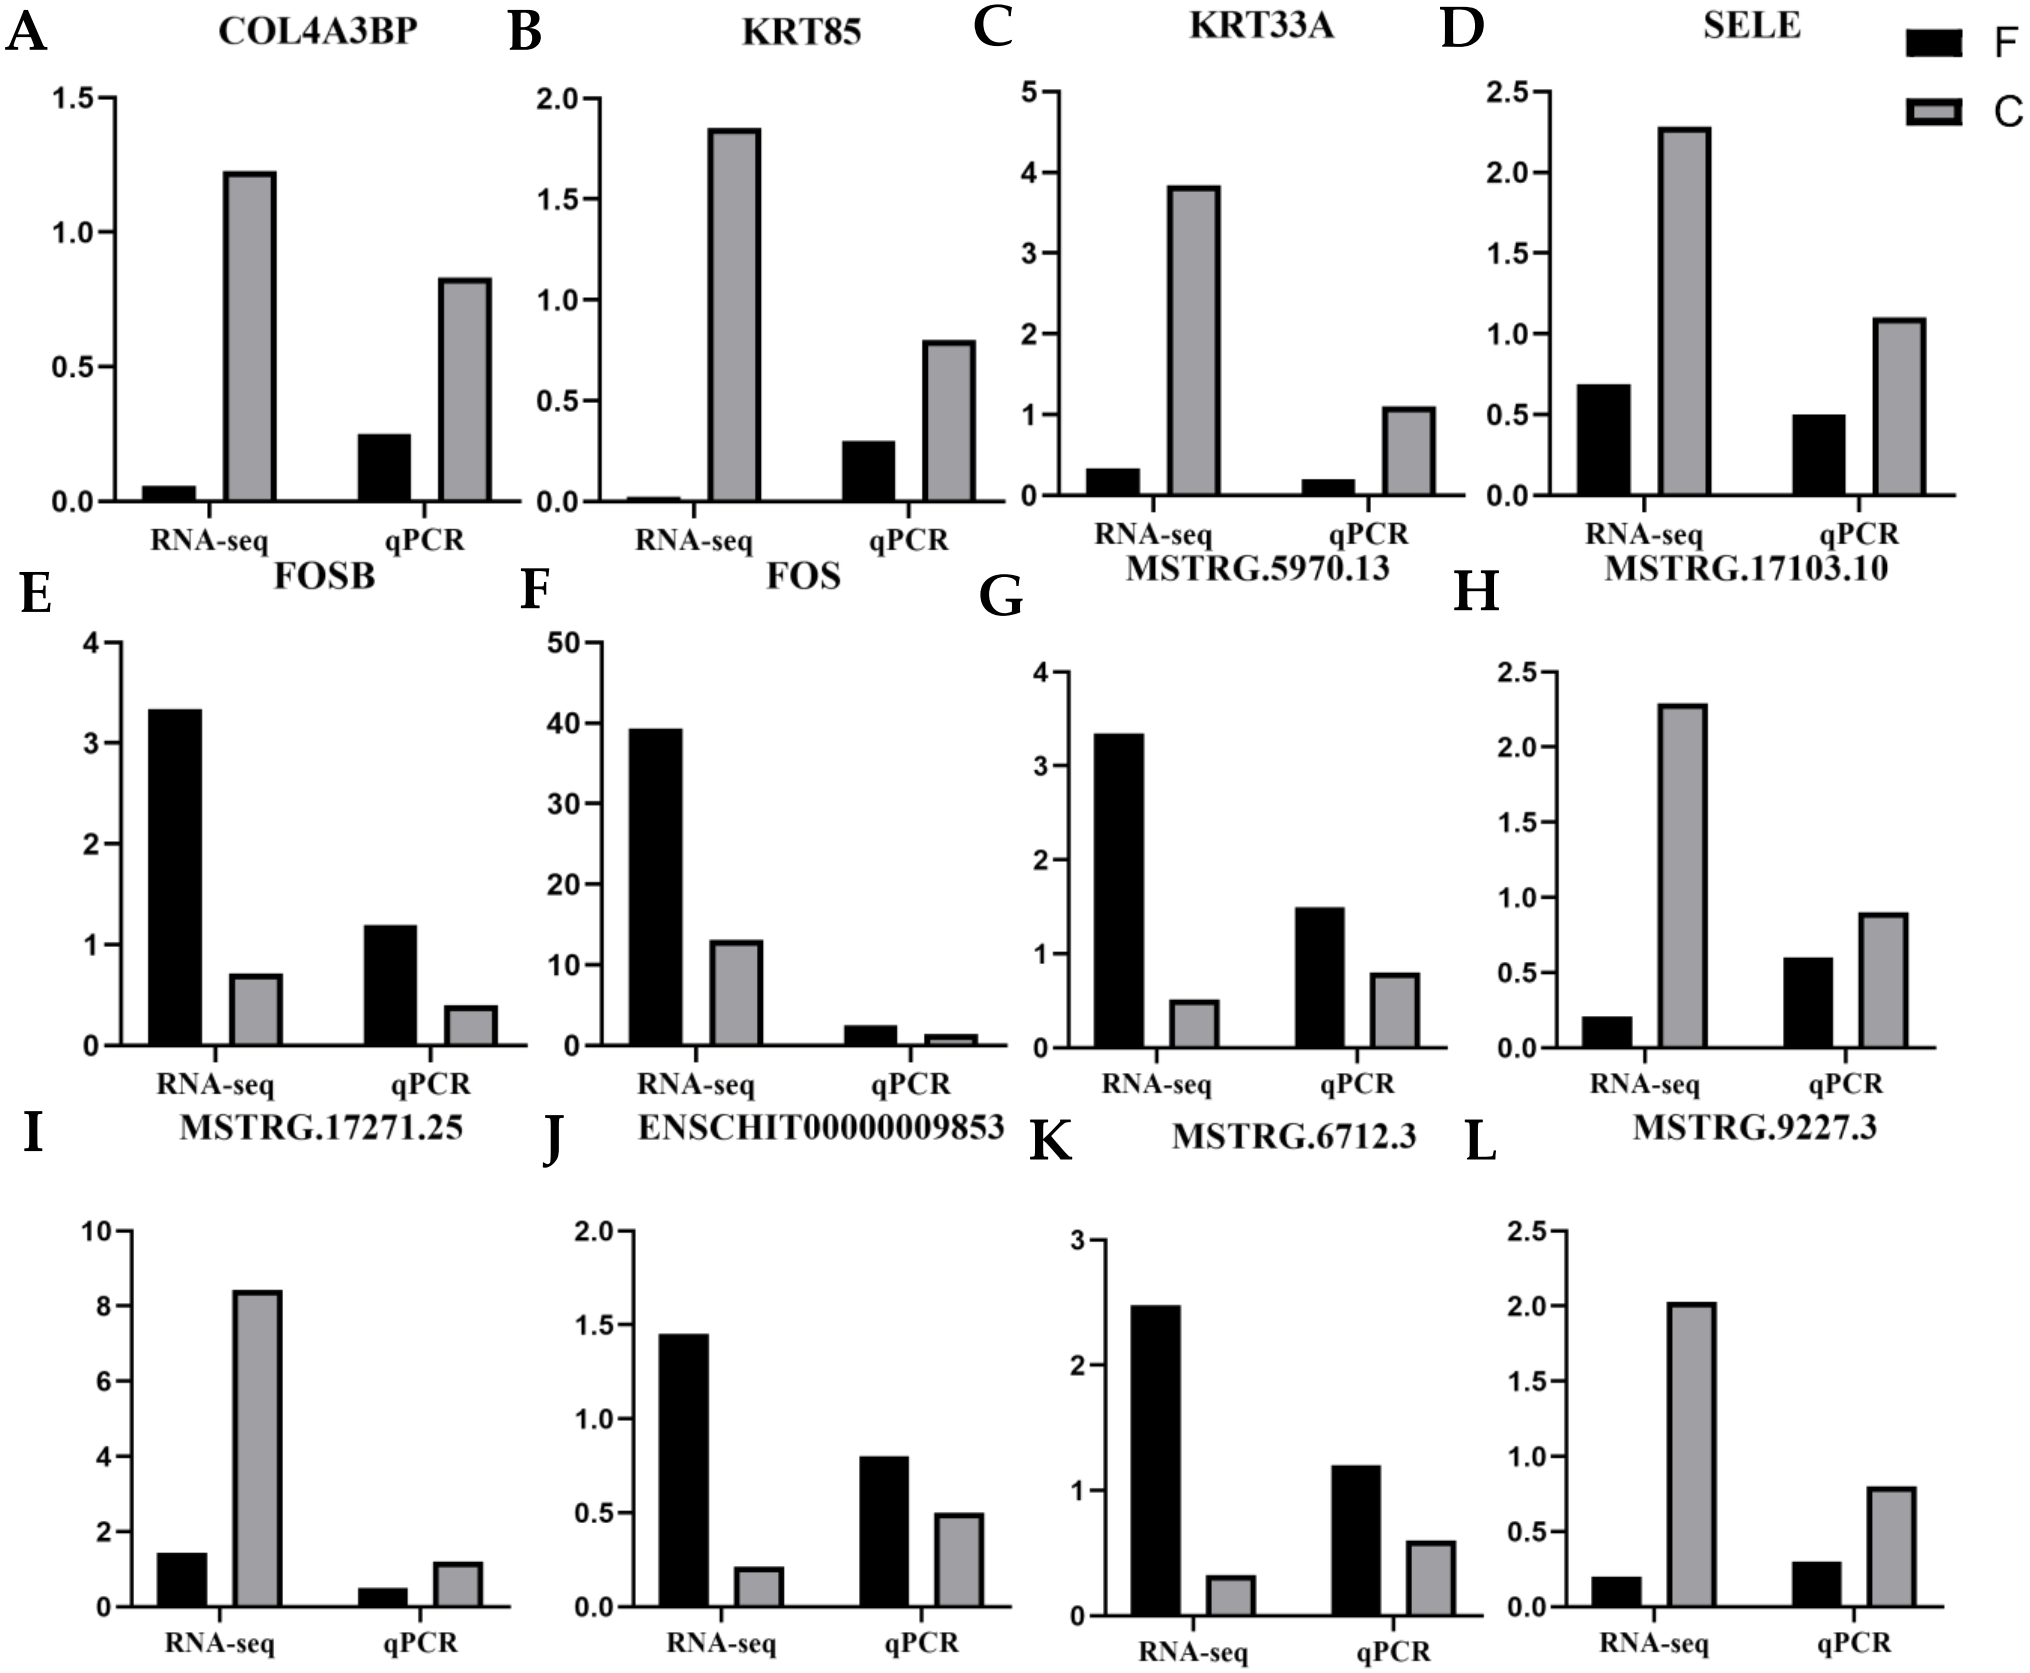
Discussion
In recent years, lncRNA has attracted more and more attention similar to mRNA, many studies on the DE lncRNA in keratinocytes and epidermal tissues of human and mice have been carried out. Mazar et al. (2010) analyzed the DE lncRNA in the reconstructed three-dimensional epidermal cells. In addition, the dynamic regulations of lncRNA expression in human primary keratinocytes differentiation were studied (Orom et al., 2010), it indicates that lncRNA not only plays an important role in the maintenance of epidermal tissue, but also participates in the terminal differentiation of multiple tissue cells. Chang et al. (2013) used transcriptome sequencing to analyze the effect of skin aging on lncRNA expression, and the results indicating that lncRNA has some potential roles in the process of human skin aging. Previous reports have revealed lncRNA associated with the differentiation of primary cells into keratinocytes, the ANCR lncRNA (anti-differentiation ncRNA) was required to enforce the undifferentiated cell state within epidermis (Kretz et al., 2012), the TINCR lncRNA involved in terminal differentiation of keratinocytes (Sun et al., 2015; Szlavicz et al., 2018). These studies suggesting that lncRNA plays an important role in maintaining epidermal balance.
Although there are conservative signals in hair follicle development among mammals, different physiology and regulation mechanisms exist between cashmere goats and human (Wang et al., 2020). Cashmere is nonmedullated and photoperiod-dependent as the seasonal molting, which is different from human (Ge et al., 2018). We speculated that the lncRNAs have a critical role in regulating fineness of cashmere. Hence, based on the fiber dimeter measurements results, skin tissues of fineness type and coarse type were selected to identify lncRNA and genes associated with cashmere fineness.
By comparing lncRNA and mRNA structural features, we showed lncRNAs have fewer exons, and shorter lengths than mRNA, and consistent with other research findings (Wang et al., 2017a; Wang et al., 2017b; Zheng et al., 2019). In this study, we identified 80 DE lncRNAs and 384 DE mRNAs. Although lncRNA can regulate the expression of mRNA in different ways (Ling et al., 2019), the results showed that their expression and characteristics were different. GO analysis found that lncRNA and its target genes are mostly related to metabolic and energy process and cellular respiration, KEGG pathway found that they are involved in biological metabolism, indicating that lncRNAs may play an important role in regulating development. DE lncRNAs might be considered as potential candidate genes for further study on the molecular mechanisms of hair follicle morphogenesis.
LncRNAs may regulate gene expression by binding and modulating the activity and stability of the target genes (Wang et al., 2020). ENSCHIT00000009853 target genes KRT28, KRT39, KRT26, IF88 and COL4A3BP and MSTRG.16794.17 target genes CASP7 and JAK3 were considered as key candidate genes for cashmere fineness. Previous studies have shown that keratin-associated proteins play a plentiful role in intermediating filaments, determine the quality of the fibers or cashmere and closely related to hair follicle growth (Akiba et al., 2018; Pan, Hobbs & Coulombe, 2013; Strnad et al., 2011). Thus, we could make an assumption that KRT28, KRT39 and KRT26 are related with fiber diameter [35]. CASP7 is involved in the signaling pathways of apoptosis, necrosis and inflammation. Vesela et al. (2015) investigated activation (cleavage) of CASP7 in mouse hair follicles and mast cells and indicates its non-apoptotic roles in the skin. IFT88 is involved in cilium biogenesis (Tong et al., 2014). Previouse study used IFT88 to disrupt cilia assembly specifically in the dermis of the skin to explore ciliary function during skin and hair follicle morphogenesis, and it has demonstrated that the construction and maintenance of the primary cilium dependent on intraflagellar transport (IFT) (Jonathan et al., 2009). JAK3 was predominantly expressed in immune cells (Nosaka & Kitamura, 2000). It has been reported a preferential JAK3/JAK1 inhibitor could lead to significant hair regrowth and concurrent skin and blood biomarker changes (Jabbari et al., 2016). Inflammatory reactions are involved in hair loss of the scalp and/or body. The involvement of chemokine receptors in the pathogenesis of Alopecia Areata (AA) has been well defined among which, CXCL9 and CXCL10 were elevated in the AA patients and might be involved in the recruitment of T lymphocytes to the inflamed tissues (Ito et al., 2013; Lefebvre et al., 2012; Zainodini et al., 2013). A previous microarray-seq identified CXCL10 and CXCL11 were functionally important transcriptional target genes of Eda involved in hair follicle spacing (Lefebvre et al., 2012). Other DEG, such as FOS, NOTCH2 and NOTCH3, were also found related to follicle hair cycling, take part in MAPK, and notch signaling pathways (Miao et al., 2018; Zhang et al., 2020a; Zhang et al., 2020b). Above all, we systematically identified the lncRNAs and mRNAs involved in Tibetan cashmere goats skin tissues. Integrated analysis indicated that some key lncRNAs including ENSCHIT00000009853, MSTRG.16794.17, MSTRG.17532.2 with their targets and key mRNAs including KRT26, KRT28, KRT39, CASP7, IFT88, JAK3, NOTCH2 and NOTCH3 were involved in hair follicle morphogenesis and skin developmental, suggested that they may regulate cashmere fineness.
Conclusions
In this study, we performed a comprehensive analysis of lncRNAs and mRNA in skin tissues of Tibetan cashmere goats and found certain genes related to fineness cashmere. Through co-expression network analysis, we identified several hub genes that may play pivotal roles in skin development, such as KRT26, KRT28, KRT39, CASP7, IFT88, JAK3, NOTCH2 and NOTCH3, and found DE lncRNAs that were strongly related to these hub protein-coding genes. Moreover, the putative lncRNAs ENSCHIT00000009853 and MSTRG.16794.17 and their target genes could be key candidate biomarkers related to cashmere fineness in Tibetan cashmere goats.
Supplemental Information
The raw transcript expression and annotation table
The experimental fineness type group were represented as F, and the experimental coarse type group were represented as C, each group has four biological replicates.
The raw lncRNA expression and annotation table
The experimental fineness type group were represented as F, and the experimental coarse type group were represented as C, each group has four biological replicates.