
Metabolomics analysis identifies metabolites associated with systemic acquired resistance in Arabidopsis
- Published
- Accepted
- Received
- Academic Editor
- Ivo Feussner
- Subject Areas
- Biochemistry, Bioinformatics, Plant Science
- Keywords
- Metabolomics, Systemic acquired resistance, Arabidopsis, Amino acids, Phenolic compounds
- Copyright
- © 2020 Gao et al.
- Licence
- This is an open access article distributed under the terms of the Creative Commons Attribution License, which permits unrestricted use, distribution, reproduction and adaptation in any medium and for any purpose provided that it is properly attributed. For attribution, the original author(s), title, publication source (PeerJ) and either DOI or URL of the article must be cited.
- Cite this article
- 2020. Metabolomics analysis identifies metabolites associated with systemic acquired resistance in Arabidopsis. PeerJ 8:e10047 https://doi.org/10.7717/peerj.10047
Abstract
Background
Systemic acquired resistance (SAR) is a type of plant defense response that provides a long-lasting resistance to broad-spectrum pathogens in uninfected distal tissues following an initial localized infection. However, little information is available at present on the biological basis of SAR at the molecular level, especially in uninfected distal leaves.
Methods
In the present work, we used two SAR-inducing pathogens, avirulent Pseudomonas syringae pv. maculicola ES4326 harboring avrRpm1 (Psm avrRpm1) and virulent P. syringae pv. maculicola ES4326 (Psm ES4326), to induce SAR in Arabidopsis ecotype Col-0. A metabolomics approach based on ultra-high-performance liquid chromatography (UPLC) coupled with mass spectrometry (MS) was used to identify SAR-related metabolites in infected local leaves, and in uninfected distal leaves.
Results
Differentially accumulated metabolites were distinguished by statistical analyses. The results showed that both the primary metabolism and the secondary metabolism were significantly altered in infected local leaves and in uninfected distal leaves, including phenolic compounds, amino acids, nucleotides, organic acids, and many other metabolites.
Conclusions
The content of amino acids and phenolic compounds increased in uninfected distal leaves, suggesting their contribution to the establishment of SAR. In addition, 2′-hydroxy-4, 4′, 6′-trimethoxychalcone, phenylalanine, and p-coumaric acid were identified as potential components which may play important roles both in basic resistance and in SAR. This work provides a reference for understanding of the metabolic mechanism associated with SAR in plants, which will be useful for further investigation of the molecular basis of the systemic immunity.
Introduction
During the long-term co-evolution with microorganisms, plants have evolved multiple strategies to antagonize the colonization by pathogens, including the constitutive and inducible defenses (Spoel & Dong, 2012). Briefly, the constitutive defenses refer primarily to pathogen-associated molecular pattern (PAMP)-triggered immunity (PTI) and effector-triggered immunity (ETI) (Zhang et al., 2018). PTI is a type of basal resistance response induced by the components with a conserved structure in pathogens, such as fungal chitin and bacterial flagellin (Nürnberger & Brunner, 2002; Kunze et al., 2004). Different from this, ETI is established by plants following the recognition of the virulent pathogenic effectors by immune receptors. ETI is usually accompanied by a hypersensitive response (HR) in the form of rapid cell death at the infection sites, which can provide effective local resistance to pathogens (Johansson et al., 2015). Although ETI is generally associated with stronger local responses than PTI, they trigger similar immunity by expressing partially overlapping genes, suggesting the synergistic effects of these genes in PTI and ETI (Bhattacharjee et al., 2011).
Besides constitutive defense, plants are also able to initiate inducible defense in tissues distant from the infected sites, namely systemic acquired resistance (SAR). As a defense response induced in systemic organs by prior localized infection, SAR confers enhanced resistance against a variety of pathogens (Cameron, Dixon & Lamb, 1994). The priming of SAR in systemic tissues is related to signals coming from local infection sites. By activation of pathogenesis-related genes, including PR1, PR2, and PR5, SAR can increase the capacity of the plants to cope with the imminent infection by the pathogens (Gruner et al., 2013).
Although ETI and PTI at the infection sites are believed to be necessary for establishment of the systemic resistance, some research confirms that PAMP alone is sufficient in induction of SAR (Shah & Zeier, 2013). During the initial stage of SAR, signal molecules are obviously being passed from locally infected sites to systemic tissues, which will lead to a transcriptional reprogramming in distal uninfected locations. These signal molecules include glycerol-3-phosphate (G3P), methyl salicylate (Me SA), azelaic acid (AzA), pipecolic acid (Pip), and dehydroabietinal (DA) (Park et al., 2007; Jung et al., 2009; Chanda et al., 2011; Gruner et al., 2013; Zhang et al., 2018). It has been found that the accumulation of pipecolic acid (Pip) in local and systemic tissues is crucial for the induction of SAR (Návarová et al., 2012; Hartmann et al., 2018). N-hydroxypipecolic acid (NHP), a direct derivate of Pip, has been confirmed to be a pivotal inducer of SAR (Hartmann et al., 2018; Chen et al., 2018).
Systemic responses to long distance signals have been studied at the physiological, transcriptional and metabolomic levels (Gruner et al., 2013; Schwachtje et al., 2018). Except for the small molecules, several proteins have been confirmed to be related to signaling of systemic immunity (Chanda et al., 2011; Carella et al., 2016). For example, the long distance movement of DEFECTIVE IN INDUCED RESISTANCE1 (DIR1) from infected leaves to systemic leaves through plasmodesmata is crucial to the establishment of SAR (Chanda et al., 2011). During the triggering process of SAR, the genes associated with salicylic acid (SA)-defense pathway were induced, whereas the genes associated with jasmonate (JA)/ethylene (ET)-defense pathways and cell wall remodeling were repressed in systemic non-inoculated tissues.
The primary and the secondary compounds related to defense mechanisms can be analyzed simultaneously by metabolite profiling methods (De Vos et al., 2007). Generally, metabolomics involves both the qualitative and quantitative analyses of all the metabolites in organisms (Dettmer, Aronov & Hammock, 2007). Plants can produce a large variety of compounds with a wide range of chemical diversity and content (De Vos et al., 2007). To identify as many metabolites as possible in a single step, a suitable method for sample analysis is required. Based on the high resolution and the high mass accuracy, UPLC-MS/MS [ultra-high-performance liquid chromatography (UPLC) and mass spectrometry (MS)] has become a typical approach in metabolomics (Schauer et al., 2006; Ahmad et al., 2011; Cao et al., 2016; Wu et al., 2018). By UPLC, the resolution, the peak efficiency, and the separation speed for complex matrices can be improved (Grata et al., 2008).
In recent years, numerous studies concerning plant metabolic changes in response to pathogens have been conducted, such as Wheat/Streak (Farahbakhsh et al., 2019), Arabidopsis thaliana/Pseudomonas syringae (Ward et al., 2010), rice/brown planthopper (Kang et al., 2019), and soybean/Fusarium tucumaniae (Scandiani et al., 2015). However, there is a limited number of studies using a metabolomics approach to elucidate the mechanism of SAR. By GC-MS (gas chromatography–mass spectrometry), Schwachtje et al. (2018) found the suppressed nitrogen metabolites and the increased organic acids contributed to SAR in systemic tissues. By NMR (nuclear magnetic resonance), Wang et al. (2016) found sugar signaling plays an important role in SAR. In the present work, we used UPLC-MS/MS to identify the metabolites associated with SAR in Arabidopsis. To this end, avirulent P. syringae pv. maculicola (Psm) avrRpm1 (Psm avrRpm1) and virulent Psm ES4326 were used to induce SAR in Arabidopsis, and UPLC-MS/MS was used to identify the different metabolites in infected leaves and uninfected distal leaves. The results of this study can provide comprehensive details of key metabolites associated with SAR, which is useful for further investigating the molecular basis of systemic immunity.
Materials & Methods
Plant materials and growth conditions
Arabidopsis thaliana (L.) Heynh. ecotype Col-0 plants were grown in matrix of perlite, vermiculite, and nutrient soil (1:1:1, v/v/v) in a controlled environment chamber under the conditions of 65% relative humidity (RH) and 16-h light/8-h dark cycles. Growth temperatures during the day and the night were set to 22 °C and 18 °C, respectively. Four to five-week-old plants exhibiting a uniform appearance were used as materials.
SAR analyses
Avirulent Psm avrRpm1 (termed as Avr) and virulent Psm ES4326 (termed as Vir) were used for induction of SAR. Bacterium strains were cultivated at 200 r/m and 28 °C in King’s B medium supplemented with 50 mg/L streptomycin and 50 mg/L tetracycline for Avr, or 50 mg/L streptomycin for Vir, respectively. For SAR induction, a 50 µL aliquot of Avr or Vir bacterial suspension in 10 mmol/L MgCl2 (OD600 = 0.002) was infiltrated into three local rosette leaves (LL, typically leaf 7–9). 10 mmol/L MgCl2 was served as mock treatment (CK). 48 h later, Avr, Vir or CK inoculated local rosette leaves (termed as LL-Avr, LL-Vir or LL-CK) and distal rosette leaves (typically leaf 10–12) (termed as DL-Avr, DL-Vir or DL-CK) were harvested and stored in liquid nitrogen. Taken together, six biologically independent SAR experiments for each treatment were performed in metabolomics analysis.
Metabolite extraction
Each sample (50 mg) was first ground in liquid nitrogen, followed by addition of 0.5 ml pre-cooled methanol/water (3:1, v/v). After vortexing, the samples were incubated for 1 h at −20 °C for protein precipitation. Then the samples were centrifuged at 13,000 r/m and 4 °C for 15 min. After filtering with a 0.22 µm filter, the supernatant (about 0.45 mL) was dried with nitrogen and stored at −80 °C. QC sample mixed with equal amount of each sample was prepared according to above steps.
LC/MSMS analysis
The samples were redissolved with 50 µL pre-cooled mixture of methanol, isopropanol, and water (1:1:2, v/v/v), and were added into a 4 °C autosampler and separated on a DIONEX UltiMate_3000 UHPLC system using a C18 column. The volume of the sample was 3 µL, the column temperature was 45 °C, and the flow rate was 0.35 mL/min. Chromatographic mobile phase A: 0.1% formic acid; B: acetonitrile in 0.1% formic acid. Chromatographic gradient elution programme: 0–0.5min, 98% A; 0.5–15 min, A with a linear change from 98% to 2%; 15–17 min, 2% A; 17.1–20 min, A with a linear change from 2% to 98%. QC samples were inserted every 6 samples to evaluate the stability of the system and the reliability of the data.
The samples were separated by UPLC and analyzed by a Q-Exactive mass spectrometer (Thermo Scientific, San Jose, CA, USA). Each sample was electrospray-ionized (ESI) and detected with positive and negative ion mode, respectively. The ESI source conditions were as follows: spray voltage (kV), 3.5 ESI+ and 3.2 ESI- (positive and negative modes); source temperature, 320 °C; sheath gas flow rate (Arb), 45; aux gas flow rate (Arb), 15. A positive/negative data-dependent (DD) high-energy collision dissociation (HCD)-MS2 mode was used for data acquisition with full MS scan (resolution: 70,000; AGC target: 1e6; maximum IT: 100 ms; scan range: m/z 80-1200). Parameters in HCD-based data dependent MS/MS (DDMS2) acquisition: resolution, 175,00; AGC target, 5e4; maximum IT, 50 ms; loop count, 5; TopN, 5; isolation window, m/z 1.0; scan range, m/z 50–750; NCE/stepped NCE, 10, 30, 60; underfill ratio, 1.0%; intensity threshold, 8e3; dynamic exclusion, 10 s. Except for QC samples whose data were acquired using full MS scan plus DDMS2 mode, other samples were run using the full MS scan mode. Compound Discoverer 3.0 was used for search of the raw data, peak alignment, peak deconvolution, adduct treatment, compound detection, grouping, and metabolite identification. A blank sample was used for background subtraction and noise removal during the pre-processing step. The precision mass matching (5 ppm) (Cao et al., 2016), and MS1 and MS2 matching to search MZcloud and ChemSpider database were used to determine the metabolite structure. For MZcloud database, the metabolites were identified by exact mass (m/z), molecular formula, and fragmentation spectrum (MS2). For ChemsPider database, the metabolites were identified by exact mass (m/z) and molecular formula. The detailed workflow and the parameters are provided in Table S5. The SIMCA-P14.1 application software (Umetrics, Umea, Sweden) was used for pattern recognition. After processing by Pareto scaling, the data were subjected to multidimensional statistical analysis, including orthogonal partial least squares discriminant analysis.
Data analysis
Pareto variance SIMCA software (Umetrics) was used to establish the orthogonal partial least squares discriminant analysis (OPLS-DA) model after data were scaled to Pareto variance (Liu et al., 2019). For analyzing differential metabolites of each comparison group, a 1.2 fold change (FC) in metabolite abundance, a VIP (variable importance for the projection) score greater than 1 and a FDR (false discovery rate) adjusted p-value less than or equal to 0.05 for student’s t-test were considered as having statistically significant differences. Hierarchical clustering of the metabolite abundance data was conducted using the Euclidean method for calculating the distance and building the linkage trees. Perseus 1.6.0.2 was used for hierarchical clustering analyses.
RNA isolation and quantitative real-time PCR
Four-week-old wild-type Col-0 plants were used as materials in expression analysis. Avr or Vir with an OD600 of 0.002 were infiltrated into 3 rosette leaves. The distal uninfected leaves were used as materials in isolation of total RNA with Trizol reagent (Invitrogen). Complementary DNA (cDNA) was prepared with PrimeScript First Strand cDNA Synthesis Kit (Takara). 1.5 µL of cDNA, 5 µL FastStart Essential DNA Green Master (Roche), and gene-specific primers (0.75 µmol/L) were mixed in each PCR with a total volume of 10 µL. ACT8 was used as a reference gene. The primer sequences were as follows: PR1 forward: GCTCTTGTAGGTGCT CTTGTTC, PR1 reverse: GCCTCTTAGTTGTTCTGCGTAG; ACT8 forward: TGTGCCTATCTACGAGGGTTT, ACT8 reverse: TTTCCCGTTCTGCTGTTGT. The amplification conditions included denaturation at 95 °C for 10 min, 39 cycles of denaturation at 95 °C for 10s and annealing at corresponding temperature for 30s. 2−ΔΔCt (cycle threshold) method was used to calculate the relative expression levels. The values were normalized to those of the reference gene and to those of the mock sample [ΔΔCt = (CtPR1 − Ctactin) different sample − (CtPR1 − Ctactin) CK]. One-way repeat measures analysis of variance (ANOVA) was used to determine the significant differences.
Results
Phenotypes shown in Psm-inoculated Arabidopsis plants
Three leaves of four-week-old Arabidopsis seedlings were inoculated with SAR-inducing pathogens, avirulent Psm avrRpm1 (Avr) and virulent Psm ES4326 (Vir), and MgCl2 (CK) was used as the negative control. After 48 h, the distal leaves (termed as DL-Avr, DL-Vir, and DL-CK) were used for RT-qPCR analysis of PR1 (AT2G14610, PATHOGENESIS-RELATED GENE 1, the marker gene of SAR). The result showed that the accumulation levels of PR1 transcripts in DL-Avr and DL-Vir were higher than that in DL-CK (Fig. 1A). To evaluate the sample quality, the distal leaves of the plants locally inoculated with Avr, Vir and CK were further inoculated with Vir. 72 h later, these distal leaves secondarily inoculated with Vir were used for phenotype observation and bacteria counting. As shown in Figs. 1B and 1C–1E, DL-Avr and DL-Vir displayed a much lighter chlorosis and a less colony forming unit in comparison with DL-CK, indicating SAR was successfully induced.
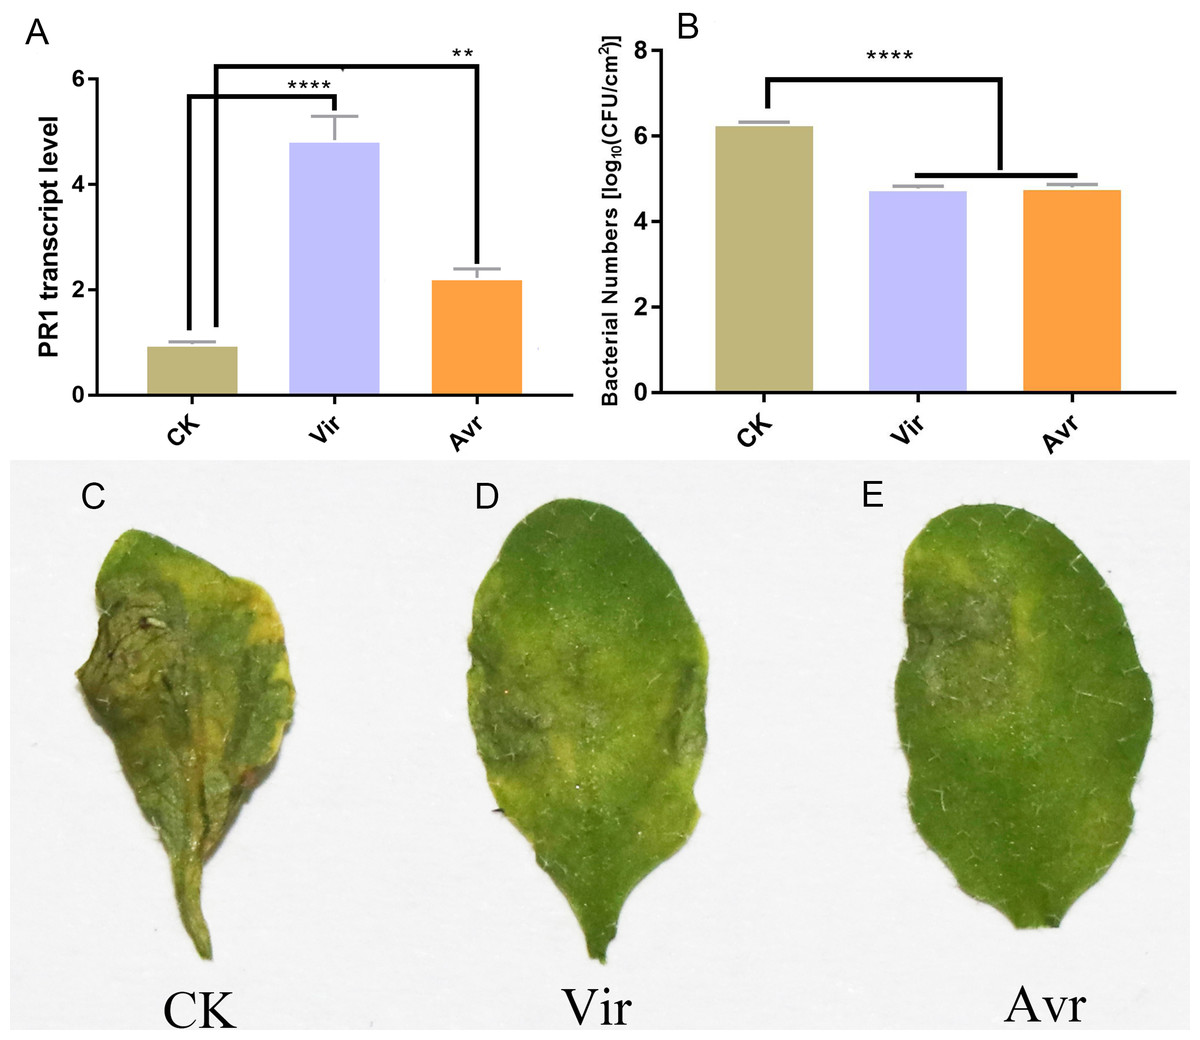
Figure 1: Sample evaluation of different treated groups.
Arabidopsis Col-0 plants were inoculated with avirulent Psm avrRpm1 (Avr), virulent Psm ES4326 (Vir) and MgCl2 (CK). RT-qPCR and bacterial growth data represent an average of three biological replicates, One-way ANOVA was used to determine significant differences. (A) Expression analysis of PR1 gene in distal leaves (DL) of plants locally Vir and Avr inoculated. One-way ANOVA was used to determine significant differences. (B) Assessment of the bacterial growth in DL after secondary infection with Vir, when LL was infected with Avr, Vir and CK at first. ** represented P < 0.01, **** represented P < 0.0001. (C–E) Phenotype of DL after secondary infection. Local leaves was infected with Avr, Vir and CK at first, after 48 h, the DL was infected with Vir. The phenotype of DL was observed 72 h later.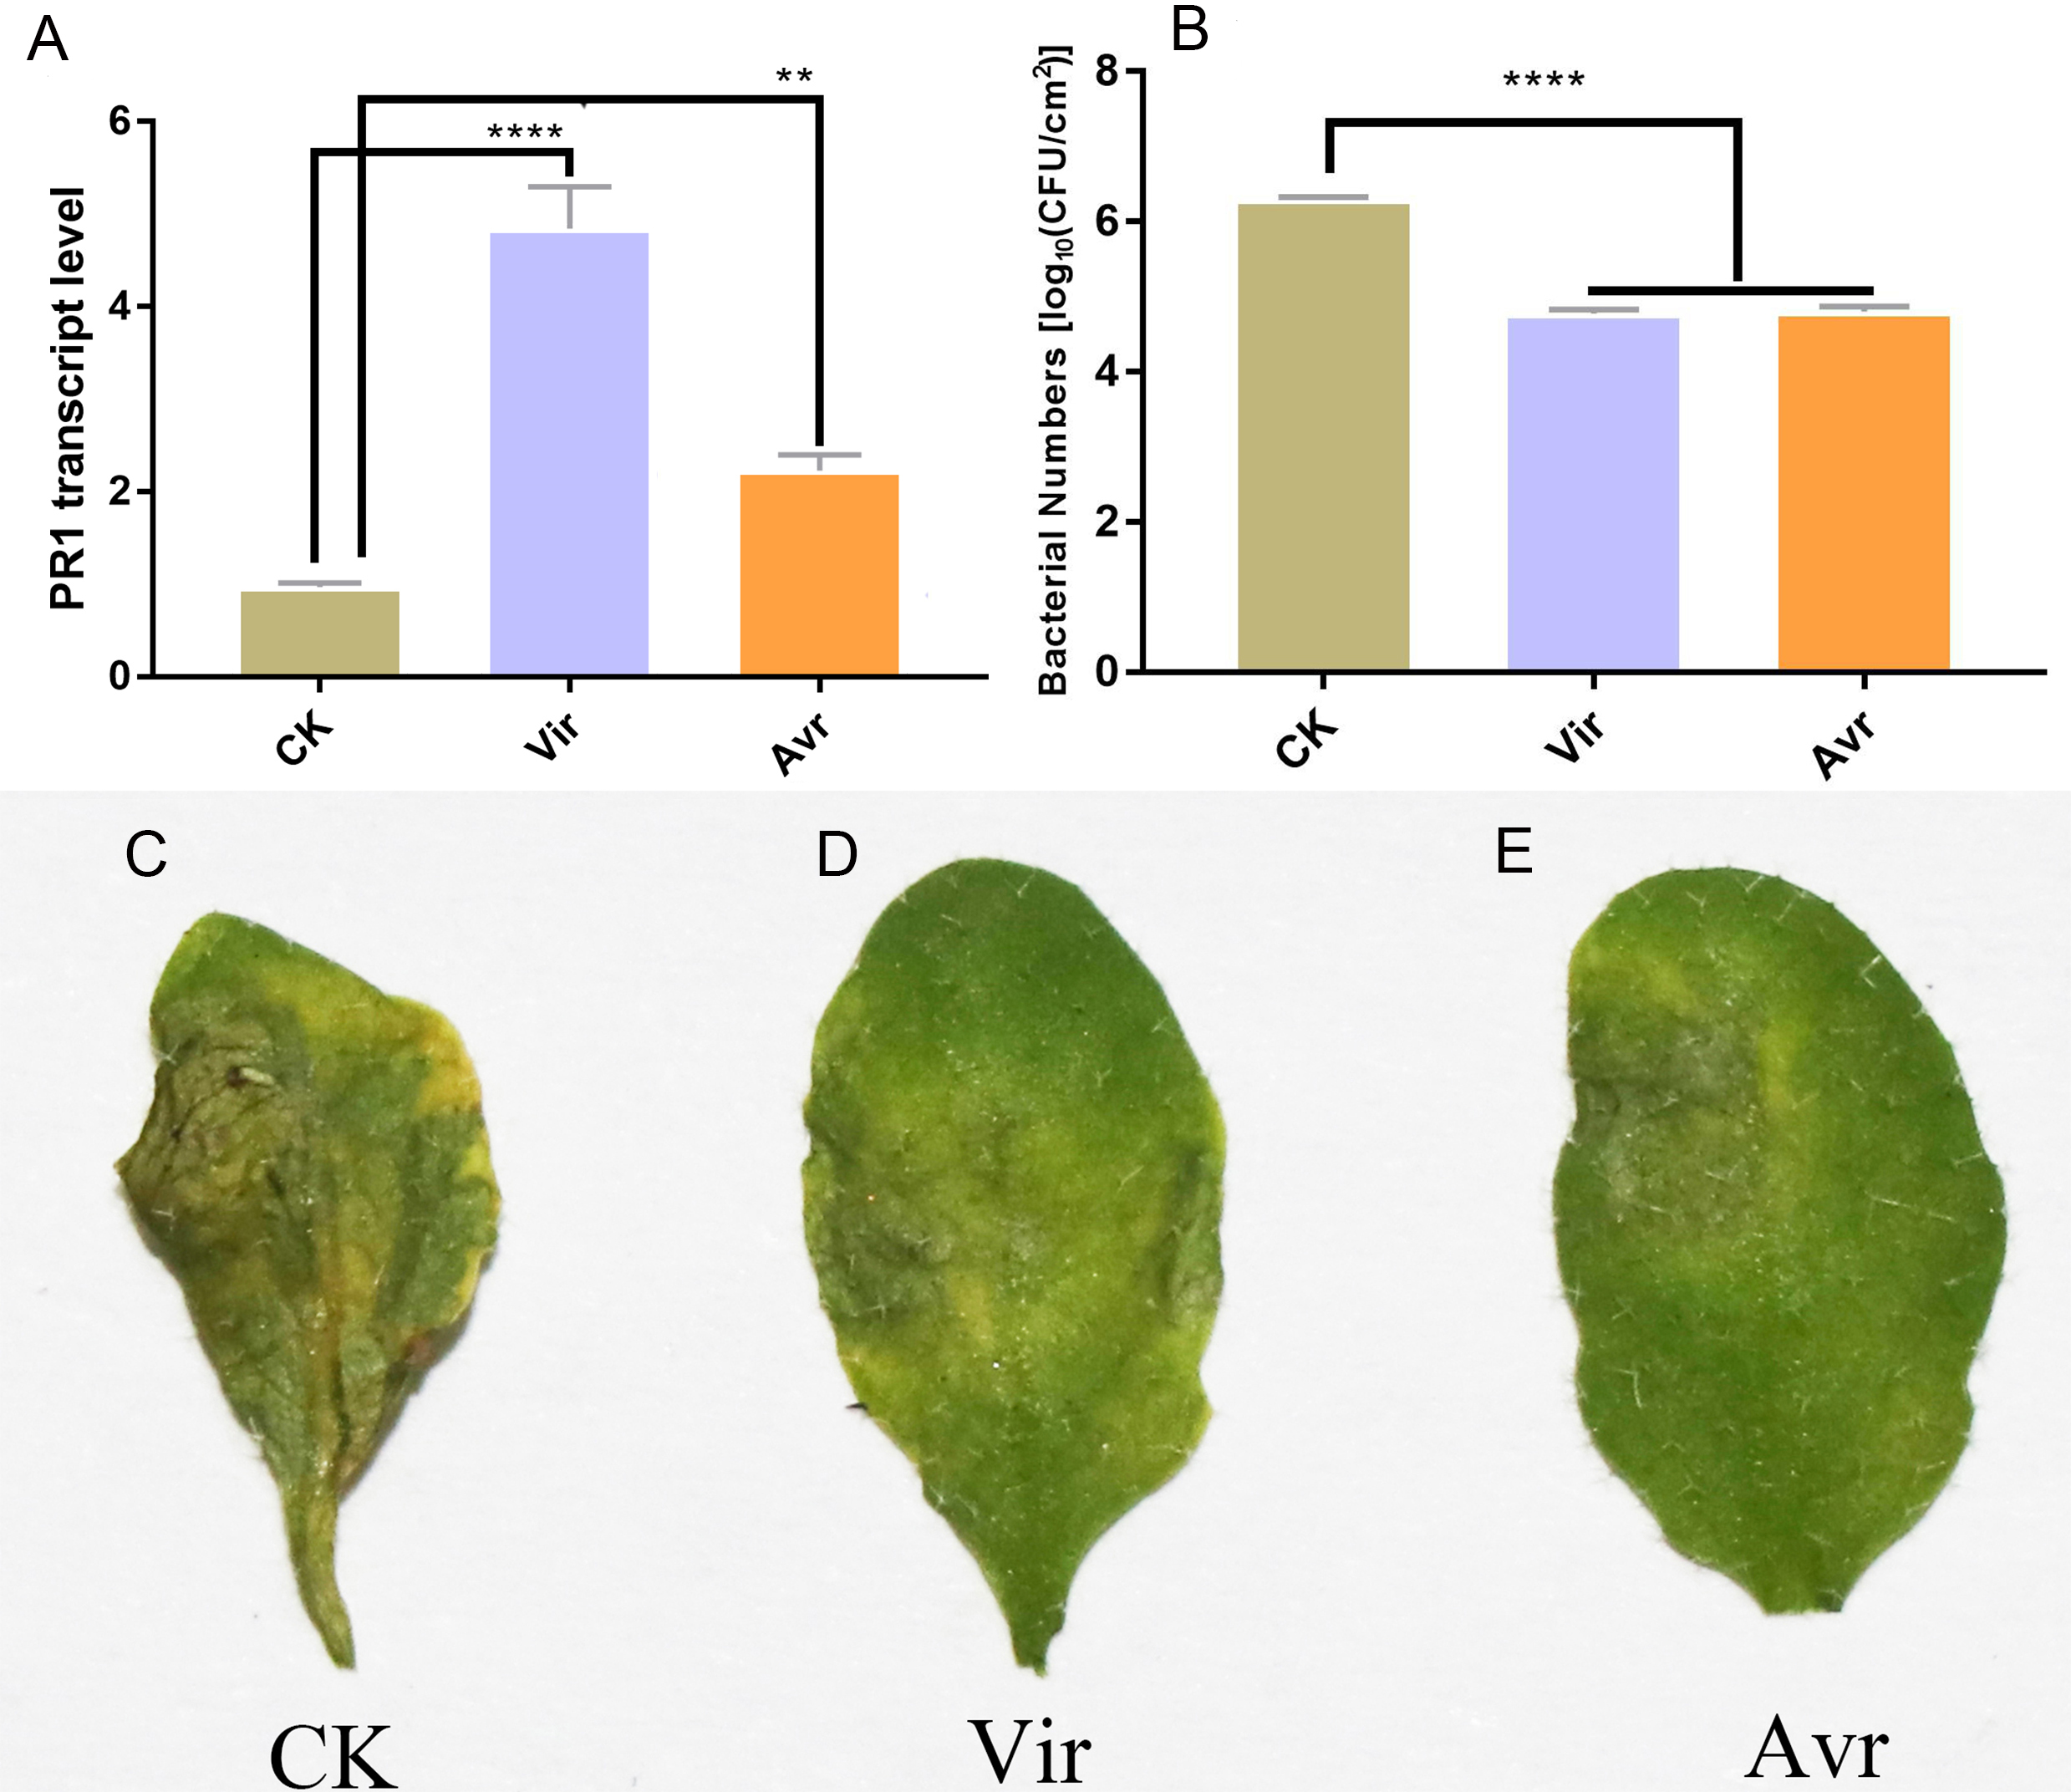
To investigate the metabolomics responses of Psm-inoculated local leaves and uninoculated distal leaves, three local leaves of four-week-old Arabidopsis seedlings were infiltrated with Avr, Vir or CK. Two days later, the inoculated local leaves and the uninoculated distal leaves were harvested. The samples used for metabolomics analyses were divided into 6 groups, including Avr-inoculated local leaves (LL-Avr), Vir-inoculated local leaves (LL-Vir), MgCl2-infiltrated local leaves (LL-CK), distal leaves of the plants locally inoculated with Avr (DL-Avr), distal leaves of the plants locally inoculated with Vir (DL-Vir), distal leaves of the plants locally infiltrated with MgCl2 (DL-CK). Each group contains 6 biological replicates.
Multivariate data analysis
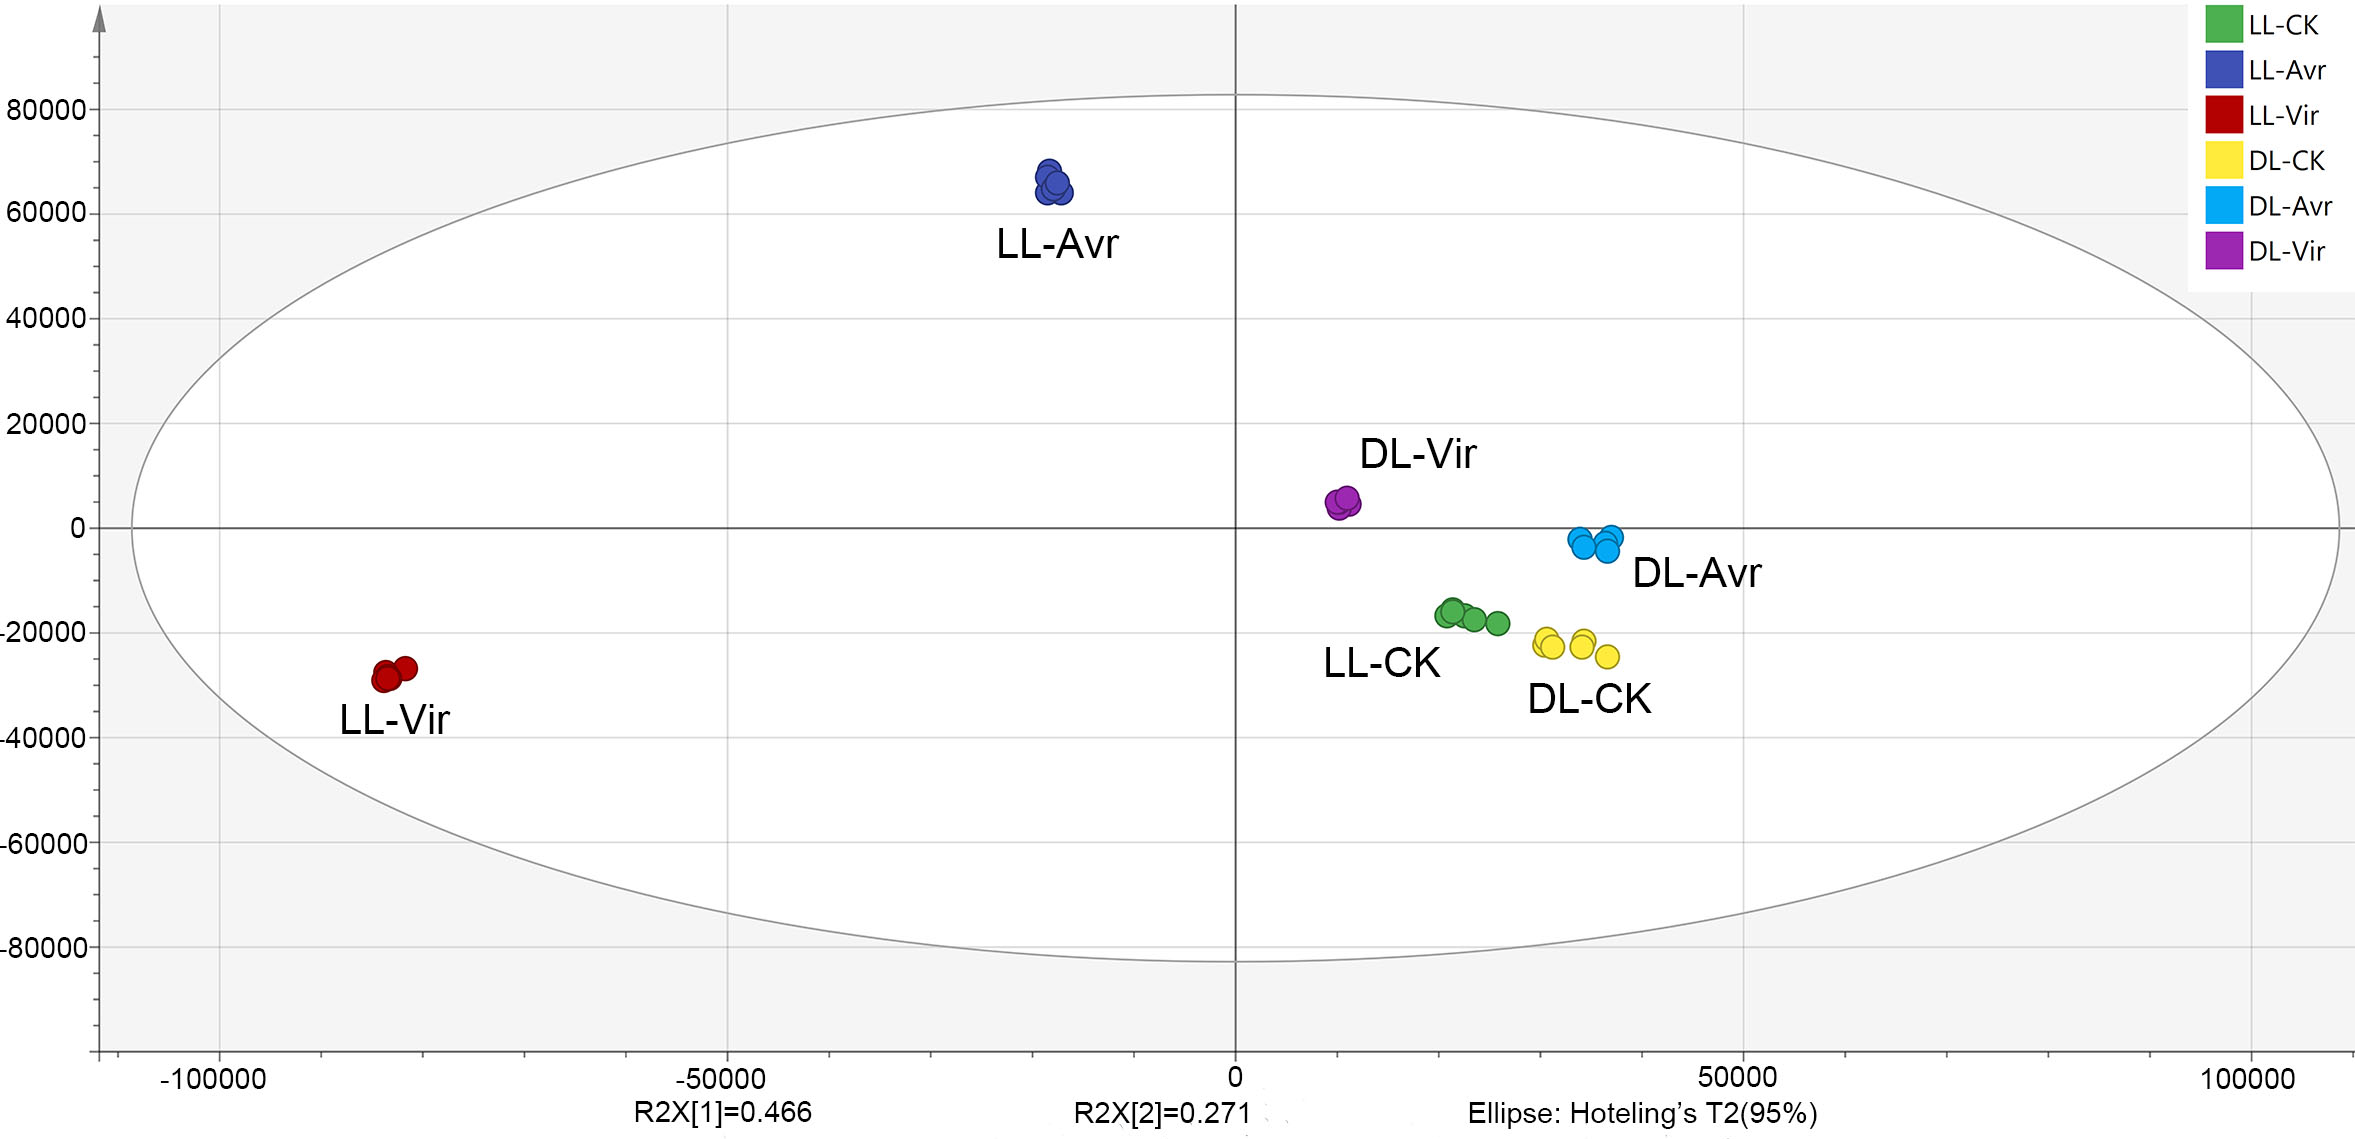
In the present work, the OPLS-DA model was established for the metabolites of LL-Avr, LL-Vir, LL-CK, DL-Avr, DL-Vir, and DL-CK to reveal the intrinsic differences within the signals (Fig. 2). The R2Y was 0.994, and the Q2 was 0.99. The results indicated that the OPLS-DA model could clearly differentiate the groups of LL-Avr, LL-Vir, LL-CK, DL-Avr, DL-Vir and DL-CK, indicating a significant difference existed between different groups (Fig. 2). The longer distance between LL-Avr and LL-Vir indicated that there were significant differences in the metabolome between these two treatment groups. Moreover, the shorter distance between DL-Avr and DL-Vir indicated that Avr and Vir could induce similar SAR response in distal leaves (Fig. 2).
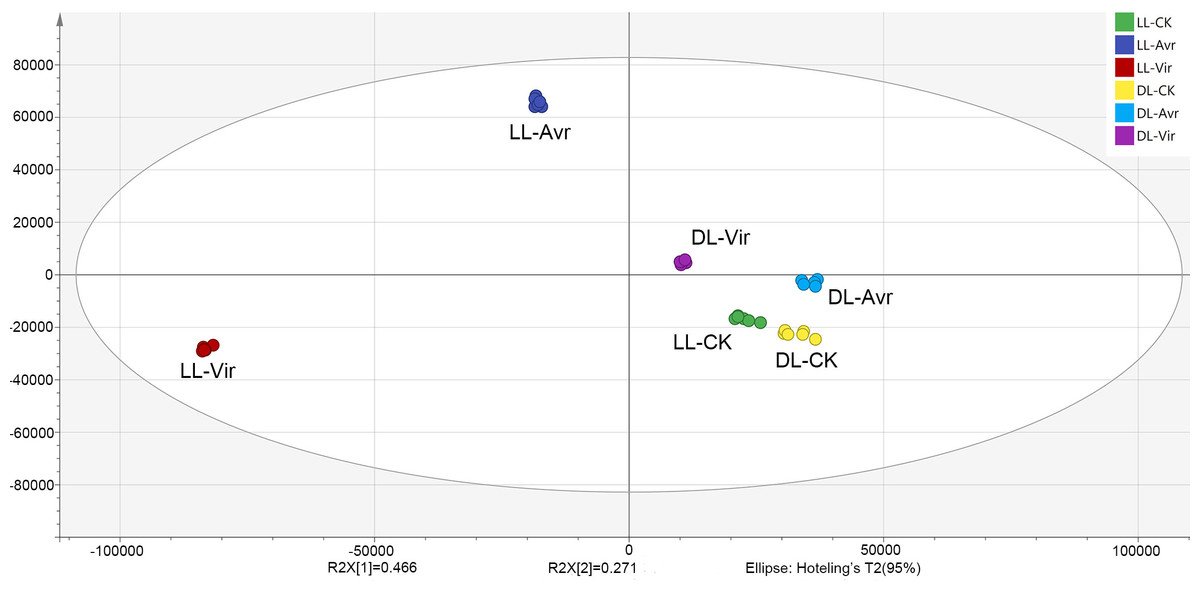
Figure 2: Orthogonal Partial Least Squares Discrimination Analysis (OPLS-DA) scores plots of LLAvr, LL-Vir, LL-CK, DL-Avr, DL-Vir and DL-CK.
The Avr and Vir responsive metabolites in local leaves and distal leaves
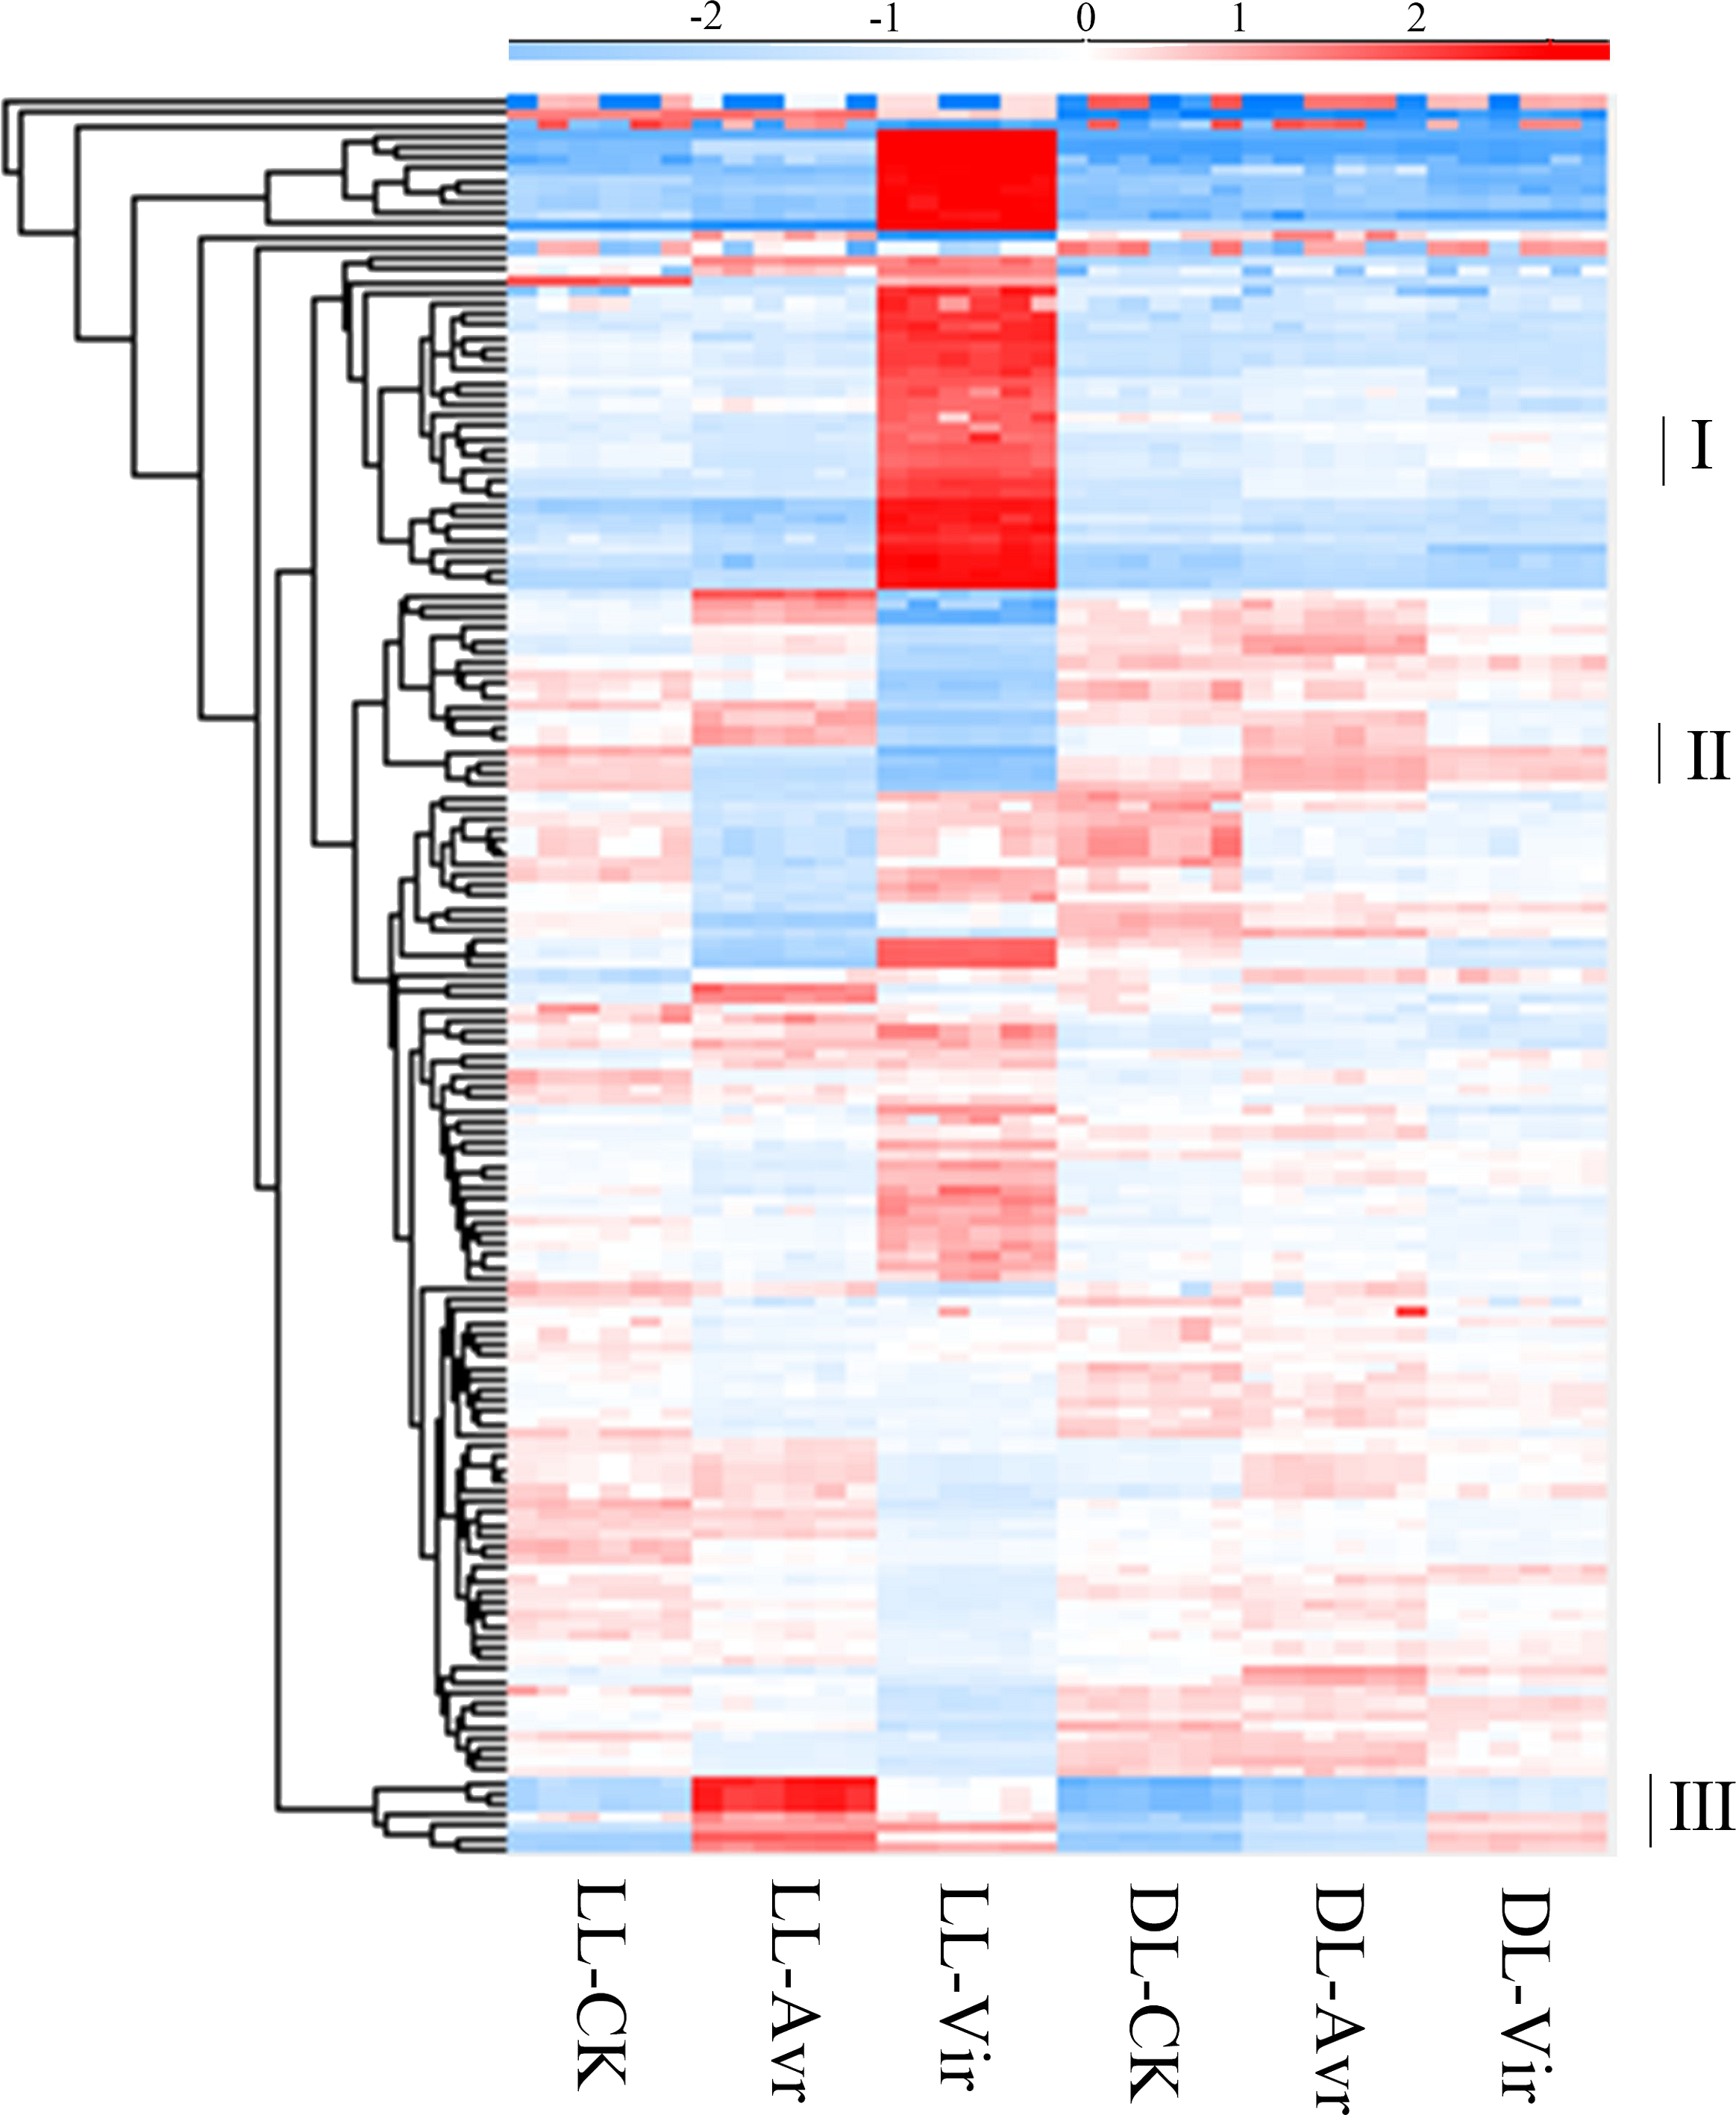
In metabolomics analyses, 157 metabolites were qualitatively and quantitatively identified across six biological replicates (Table S1). The accumulation patterns of these metabolites in all the 36 samples are shown in Fig. 3. The labelled three clusters are probably related with SAR. Compared to LL-CK, metabolites in cluster III showed a higher abundance in LL-Avr and LL-Vir, including cinnamyl alcohol, adenylthiomethylpentose, aspartyl-L-proline, 3-phenylpropanoic acid, tris(hydroxymethyl)aminomethane, and sinapoylspermine. These metabolites are possibly associated with the generation of the systemic signals in local leaves. In DL-Avr and DL-Vir, the abundance of the metabolites in cluster I and cluster II was higher than that in DL-CK, including camalexin, glutamine, histidine, lysine, 5′-O-beta-D-glucosylpyridoxine, 2,4-dihydroxyheptadec-16-enyl acetate, and 2,4-dihydroxyheptadec-16-ynyl acetate. These metabolites may contribute to SAR in distal leaves.

Figure 3: The results of the identified metabolites clustering analysis in LL-CK, LL-Avr, LL-Vir, DLCK, DL-Avr and DL-Vir groups. The raw abundance values were normalized by raw mean and log2.
Within the 157 identified metabolites, 41 and 58 differentially accumulated metabolites (DAMs) showed significant changes in LL-Avr vs. LL-CK and LL-Vir vs. LL-CK, respectively (fold change < 0.83 or >1.2, VIP >1, P < 0.05, Table S2). Compared to LL-CK, the contents of 15 DAMs are increased in LL-Avr, including 2′-hydroxy-4, 4′, 6′-trimethoxychalcone, 3-O-feruloyl-D-quinic acid, sinapinic acid, citrulline, citric acid, ketoglutaric acid, hexadecasphinganine, and the contents of 26 DAMs are decreased in LL-Avr (Fig. 4A, Table S2), including threonine, cinnamic acid, leucine, and valine (Table 1). Compared to LL-CK, 28 DAMs showed an increased accumulation level and 30 DAMs showed a decreased accumulation level in LL-Vir (Fig. 4A, Table S2). The increased DAMs include benzoic acid, valine, theanine, phenylalanine, lysine, histidine, and hexadecasphinganine. The decreased DAMs include sinapinic acid, glutamine, glutamic acid, and aspartic acid (Table 1).
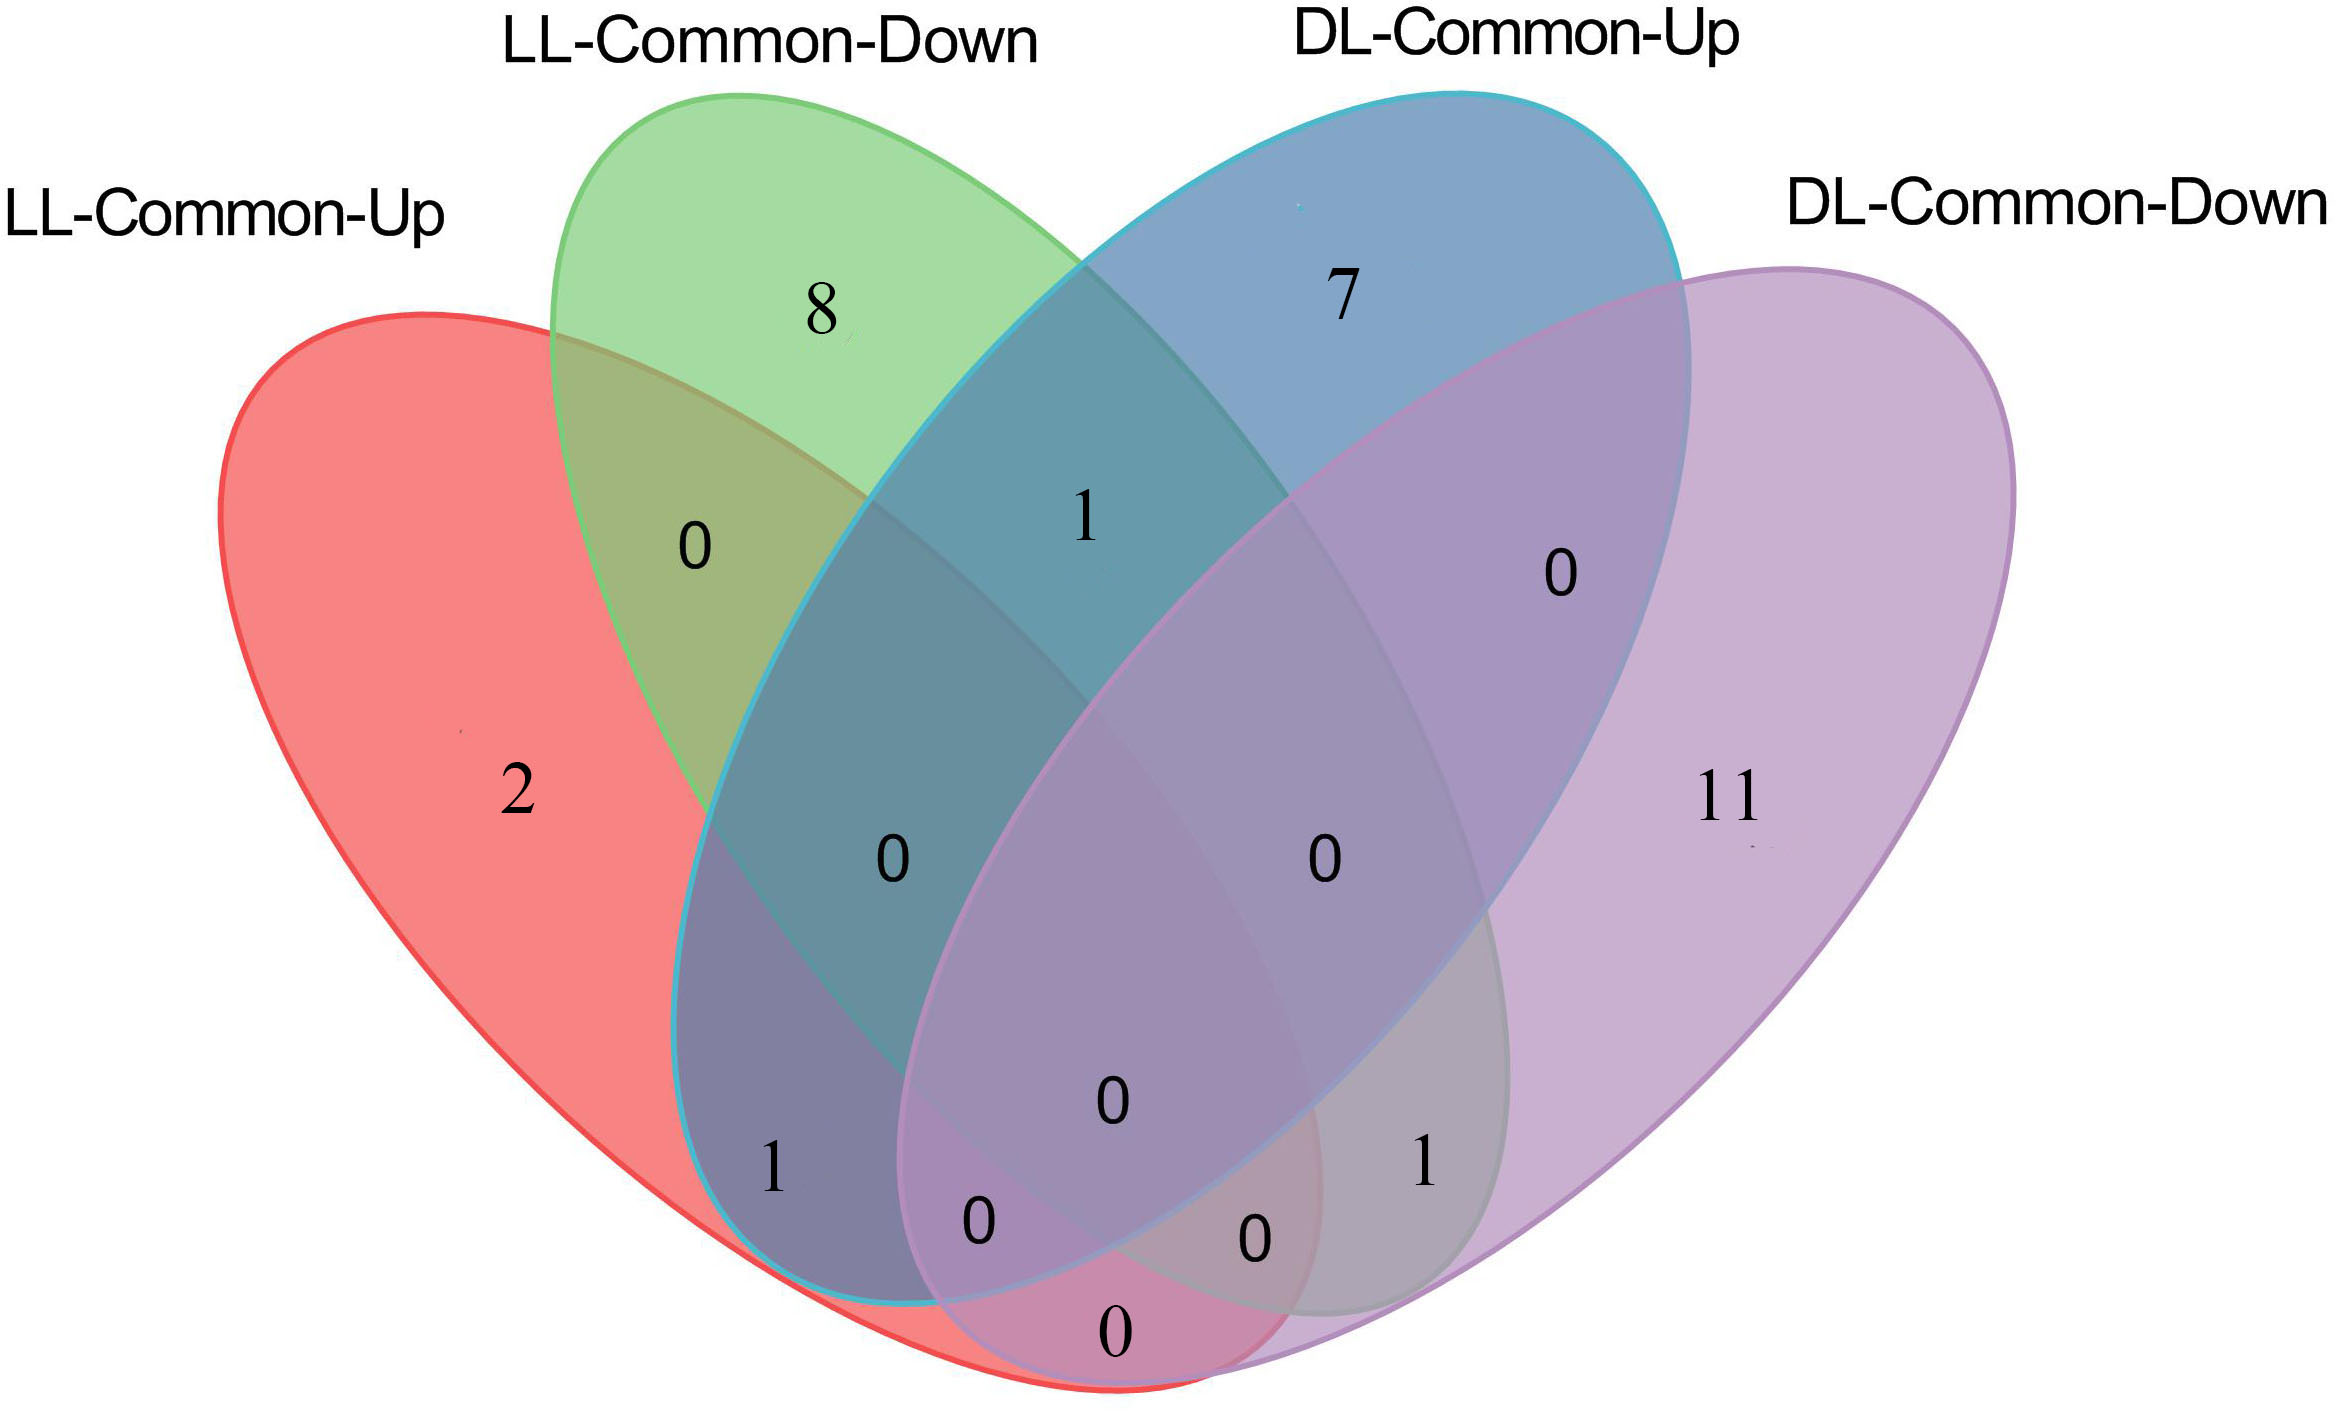
Venn diagram analysis showed that 3 DAMs were commonly up-accumulated both in LL-Avr and in LL-Vir (Fig. 4B, Table S3), and 10 DAMs were commonly decreased in LL-Avr and in LL-Vir (Fig. 4C, Table S3). The interesting DAMs include hexadecasphinganine, trans-3-indoleacrylic acid, arginine, and choline (Table 1). To investigate the DAMs related with SAR in distal leaves, we then focused on the analysis of the DAMs in DL-Avr and in DL-Vir. As shown in Fig. 4D, 24 and 14 DAMs are up-accumulated in DL-Avr and DL-Vir, while 14 and 25 DAMs are decreased in DL-Avr and DL-Vir, respectively (fold change < 0.83 or > 1.2, VIP > 1, P < 0.05, Table S2). Among them, 9 DAMs are commonly increased (Fig. 4E, Table S4) and 12 DAMs are commonly decreased (Fig. 4F, Table S4). Numerous DAMs are interesting, such as 2′-hydroxy-4, 4′, 6′-trimethoxychalcone, glutamine, phenylalanine, pyroglutamic acid, and (9S,13S)-12-oxophytodienoic acid.
Identification of DAMs associated with SAR
Except for transcriptional reprogramming and activation of immunity signalling pathways, defense responses can also affect the accumulation of metabolites, including organic acids, amino acids, phenolic compounds, and many defense-associated phytohormones. In the present work, the metabolite profiles were investigated to explore the DAMs associated with SAR. In LL-Avr vs. LL-CK or LL-Vir vs. LL-CK, several phenolic compounds were differentially accumulated, such as 3-O-feruloyl-D-quinic acid, sinapinic acid, coumarone, p-coumaric acid, and cinnamic acid (Table 1). In addition, the content of 14 amino acids and their derivatives were significantly changed, such as glutamine, leucine, valine, glutamic acid, asparagine, and aspartic acid (Table 1). Moreover, citric acid and ketoglutaric acid showed a significant up-accumulation in LL-Avr, and the content of 2-methylcitric acid was decreased in LL-Vir (Table 1). Besides, the accumulation level of many other interesting metabolites were significantly changed in local leaves, such as adenine, adenosine, hexadecasphinganine, choline, and (9S, 13S)-12-oxophytodienoic acid.
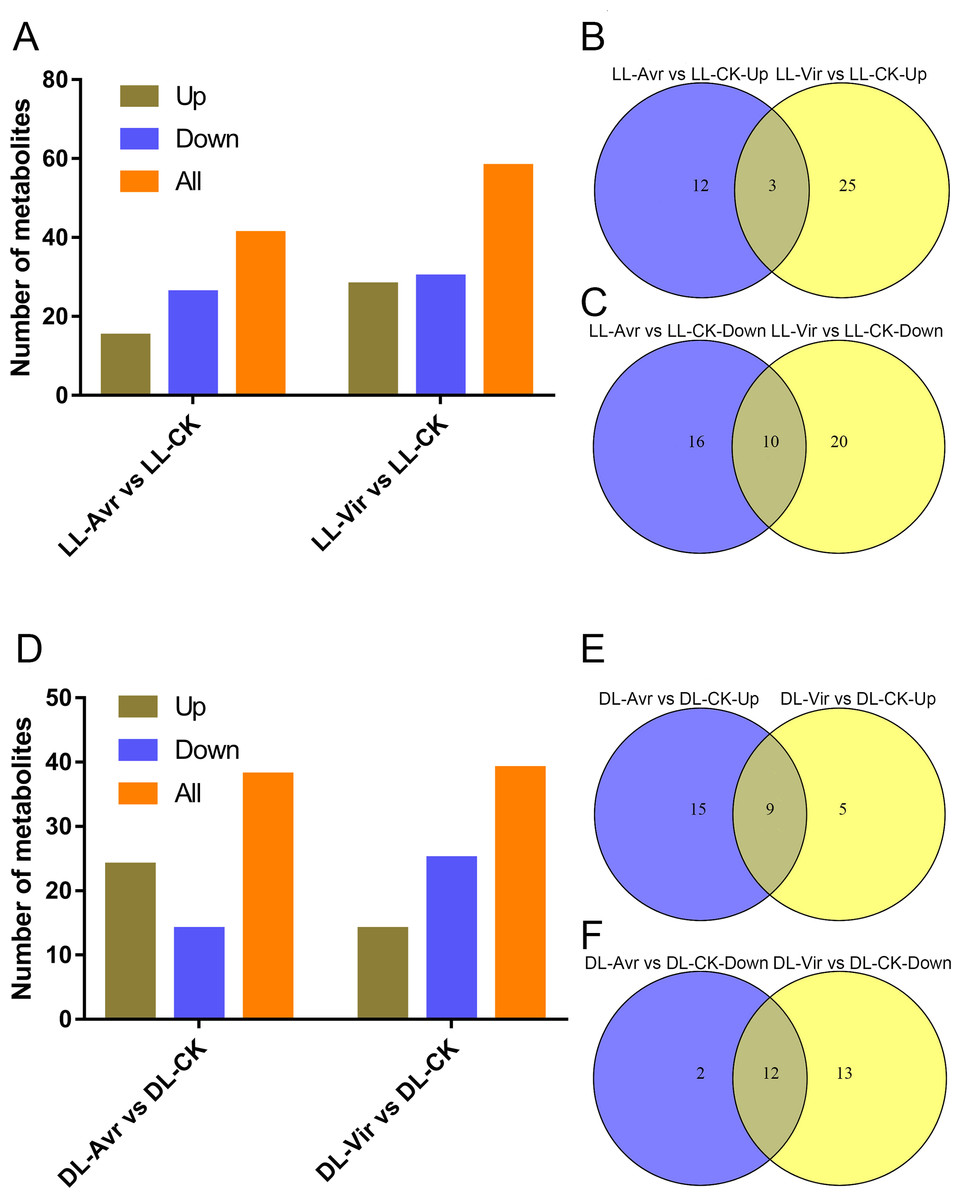
Figure 4: Summary of Arabidopsis metabolites response to the infection of Avr and Vir in LL and DL of locally Avr and Vir inoculated plants.
(A) Number of up- or down-regulated metabolites in LL-Avr vs. LL-CK and LL-Vir vs. LL-CK. (B) Venn diagram representing up regulated metabolites in LL-Avr vs. LL-CK and LL-Vir vs. LL-CK. (C) Venn diagram representing down-regulated metabolites in LL-Avr vs LL-CK and LL-Vir vs. LL-CK. (D) Number of up- or down-regulated metabolites in DL-Avr vs. DL-CK and DL-Vir vs. DL-CK. (E) Venn diagram representing up regulated metabolites in DL-Avr vs. DLCK and DL-Vir vs. DL-CK. (F) Venn diagram representing down-regulated metabolites in DL-Avr vs. DLCK and DL-Vir vs. DL-CK.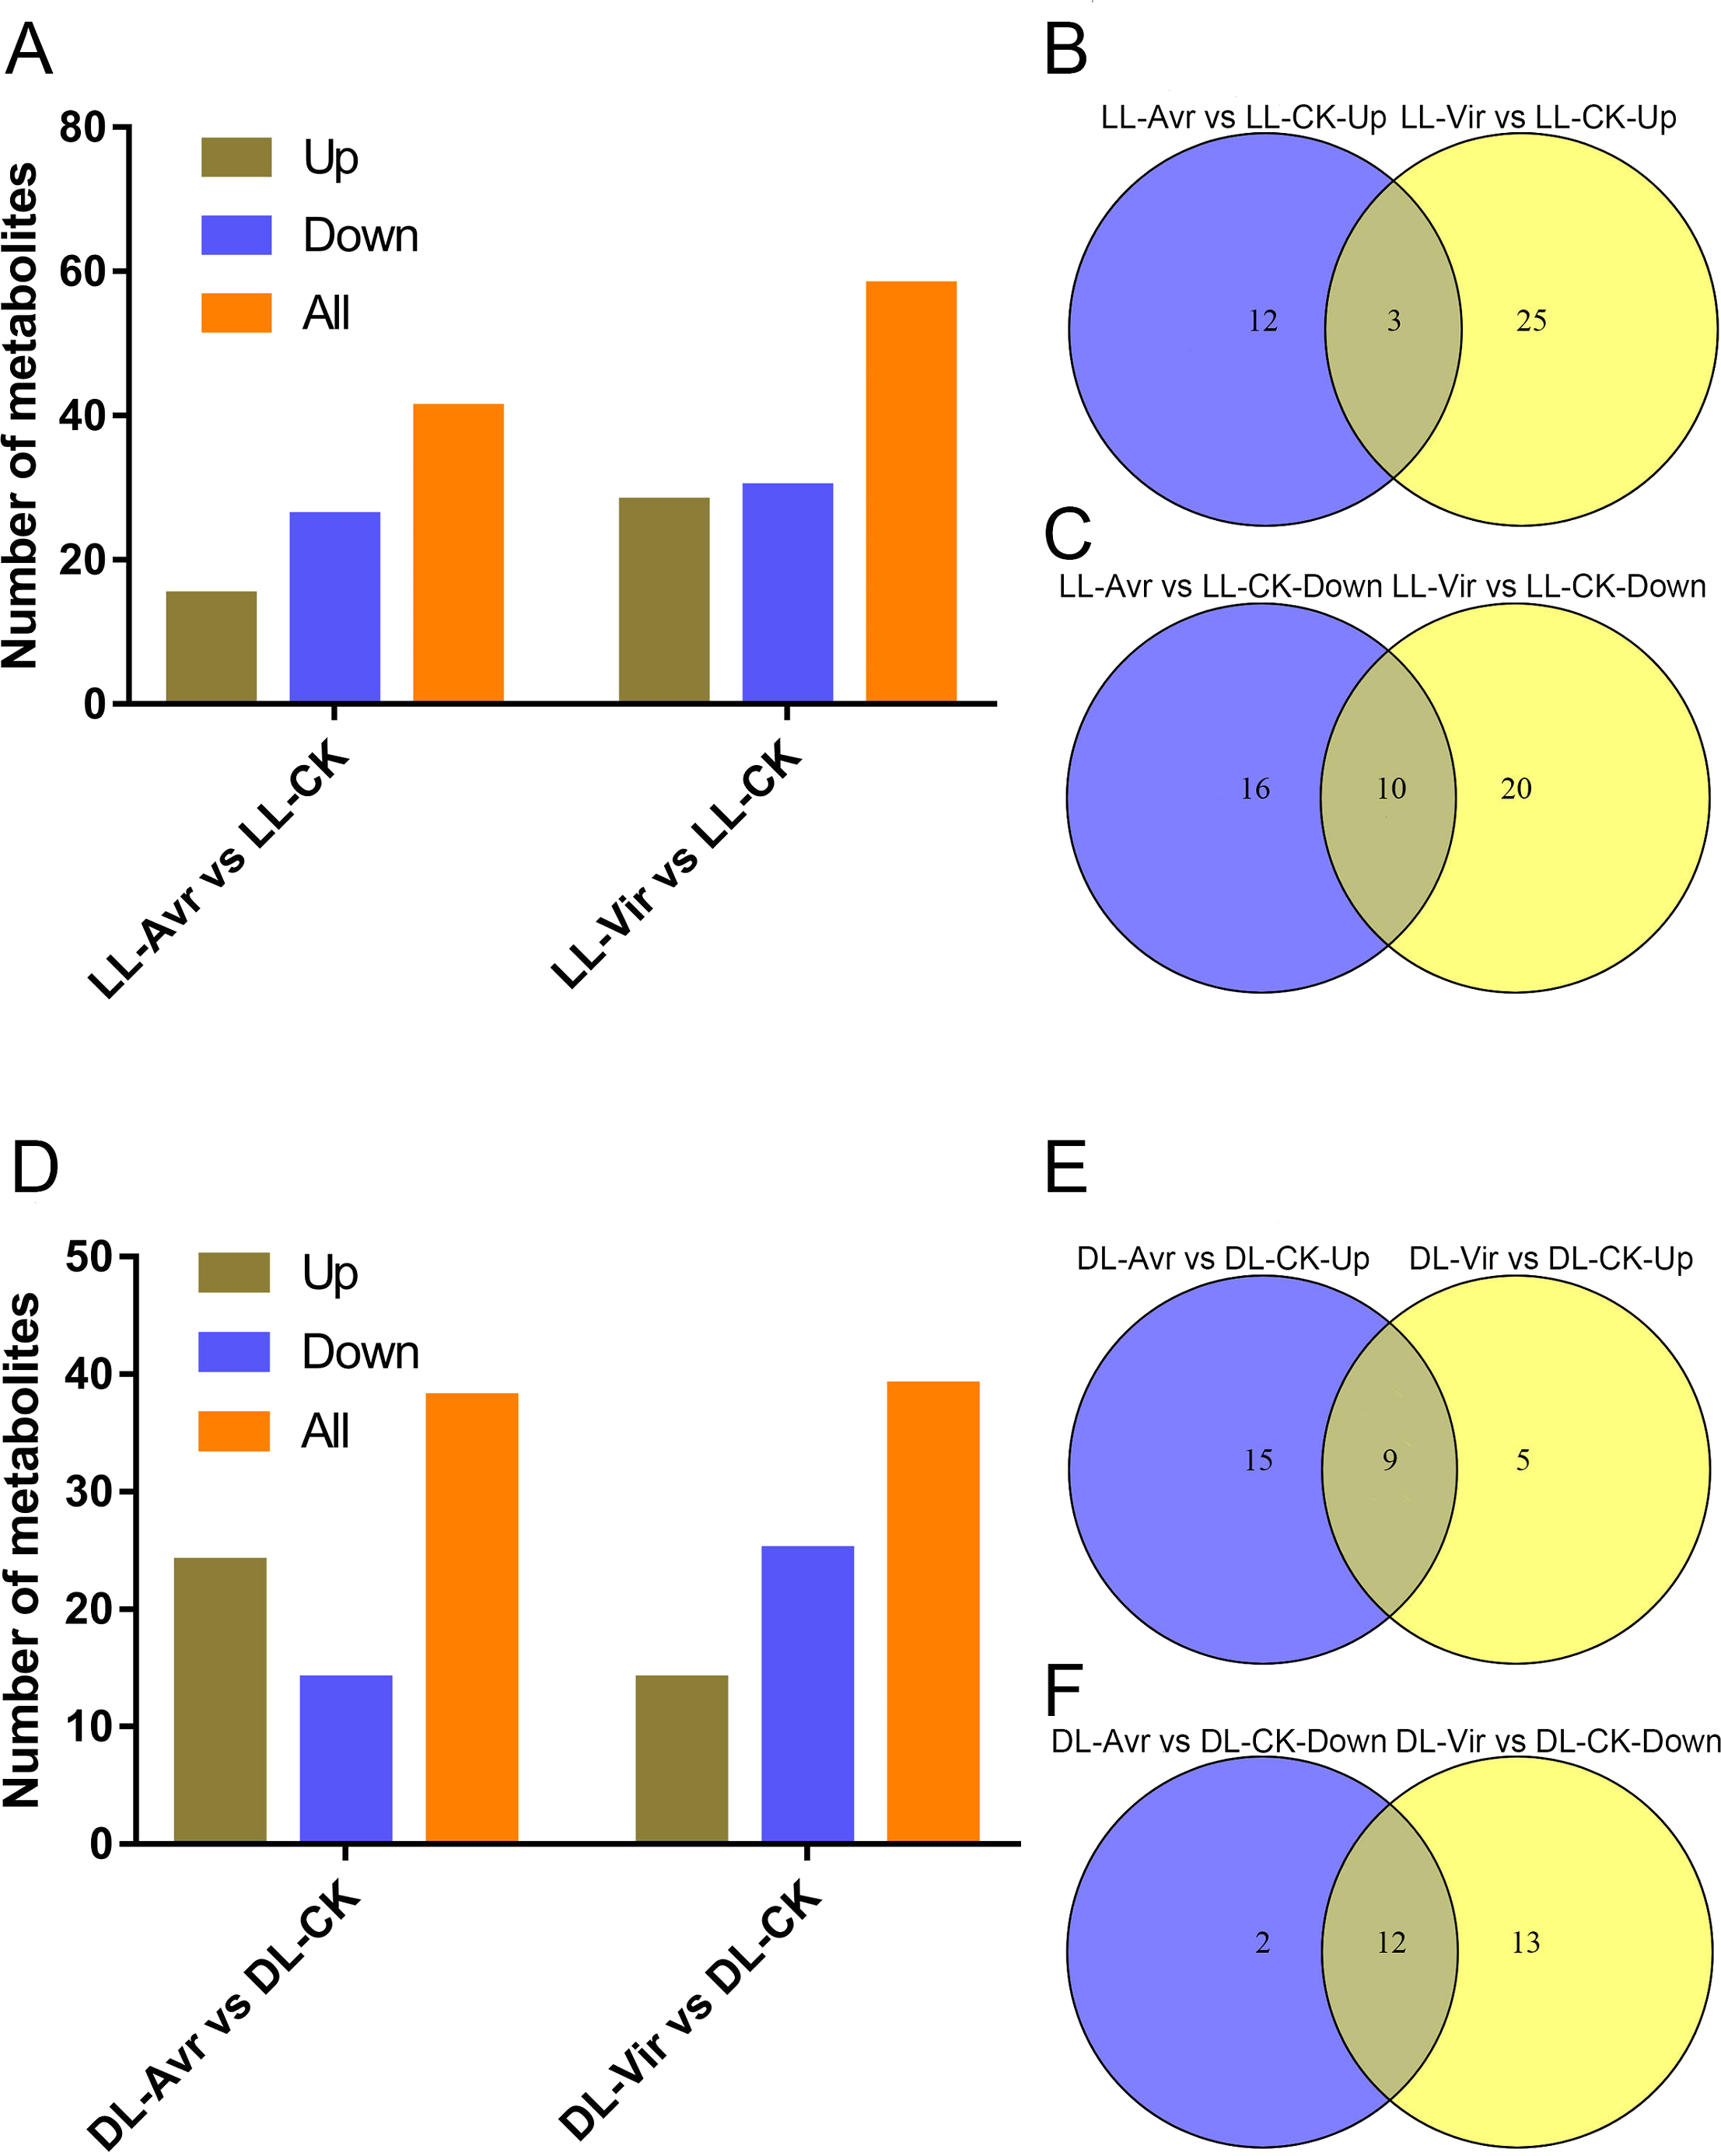
| Metabolites | Formula | Fold change | |||
|---|---|---|---|---|---|
| LL-Vir vs. LL-CK | LL-Avr vs. LL-CK | DL-Vir vs. DL-CK | DL-Avr vs. DL-CK | ||
| Phenolic compounds | |||||
| 2′-Hydroxy-4,4′,6′-trimethoxychalcone | C18 H18 O5 | 5.2 | 5.1 | 4.7 | 1.8 |
| 3-O-feruloyl-D-quinic acid | C17 H20 O9 | 0.37 | 1.4 | / | / |
| Sinapinic acid | C13 H23 N7 O9 | 0.23 | 1.6 | / | 1.9 |
| Cinnamic acid | C9 H8 O2 | 3.6 | 0.5 | 1.7 | / |
| P-coumaric acid | C9 H8 O3 | 8.4 | / | 1.3 | 1.72 |
| Coumarone | C8 H6 O | 9 | / | / | 1.8 |
| octyl methoxycinnamate | C18 H26 O3 | 3.1 | / | / | / |
| Benzoic acid | C7 H6 O2 | 5.9 | / | / | / |
| Salicylic acid | C7 H6 O3 | 4.25 | / | / | / |
| Amino acids and its derivatives | |||||
| Glutamine | C5 H10 N2 O3 | 0.53 | / | 1.35 | 1.72 |
| Leucine | C6 H13 N O2 | 1.66 | 0.67 | 1.48 | 1.64 |
| Serine | C3 H7 N O3 | 0.54 | / | 1.33 | 1.65 |
| Valine | C5 H11 N O2 | 1.94 | 0.61 | 1.4 | 1.46 |
| Theanine | C7 H14 N2 O3 | 2.6 | / | / | 1.35 |
| Phenylalanine | C9 H11 N O2 | 3.7 | / | 1.85 | 1.37 |
| Glutamic acid | C5 H9 N O4 | 0.5 | / | / | 1.25 |
| Asparagine | C4 H8 N2 O3 | 0.6 | / | 1.22 | / |
| Proline | C5 H9 N O2 | / | 0.83 | 0.83 | / |
| Lysine | C6 H14 N2 O2 | 4.4 | / | / | / |
| Histidine | C6 H9 N3 O2 | 4.7 | / | / | / |
| Arginine | C6 H14 N4 O2 | 0.4 | 0.83 | / | / |
| Aspartic acid | C4 H7 N O4 | 0.57 | 0.73 | / | / |
| Threonine | C4 H9 N O3 | 1.51 | 0.69 | / | / |
| Citrulline | C6 H13 N3 O3 | 0.73 | 1.25 | / | 1.57 |
| Tiglylglycine | C7 H11 N O3 | 2.56 | / | / | 1.33 |
| Pyroglutamic acid | C5 H7 N O3 | 0.53 | / | 1.3 | 1.72 |
| Organic acids and sugars | |||||
| 1,2-bis-O-sinapoyl β-D-glucoside | C28 H32 O14 | 0.24 | 1.68 | / | 1.79 |
| 2-methylcitric acid | C7 H10 O7 | 0.18 | / | 0.68 | 0.78 |
| cyclo-Dopa 5-O-glucoside | C15 H19 N O9 | 0.2 | / | 0.56 | / |
| Itaconic acid | C5 H6 O4 | 0.51 | / | 0.74 | / |
| α-Lactose | C12 H22 O11 | 0.34 | 0.74 | 0.81 | / |
| D-Glucose 6-phosphate | C6 H13 O9 P | 0.54 | / | / | / |
| Glycerophosphoglycerol | C6 H15 O8 P | 0.3 | / | 0.55 | / |
| Citric acid | C6 H8 O7 | / | 15.04 | / | / |
| alpha-Ketoglutaric acid | C5 H6 O5 | / | 14.95 | / | / |
| 5-Hydroxy-2-furoic acid | C5 H4 O4 | / | 15.17 | / | / |
| Nucleotides and its derivatives | |||||
| Adenine | C5 H5 N5 | / | 0.29 | 0.41 | 0.41 |
| Adenosine | C10 H13 N5 O4 | / | 0.28 | 0.37 | 0.38 |
| Adenosine 5′-monophosphate | C10 H14 N5 O7 P | / | / | 0.37 | 0.5 |
| uridine 5′-diphosphate | C9 H14 N2 O12 P2 | 0.47 | / | 0.78 | / |
| Coenzymes and its derivatives | |||||
| 5′-O-beta-D-Glucosylpyridoxine | C14 H21 N O8 | 0.49 | 0.65 | / | / |
| 6-Decylubiquinol | C19 H32 O4 | 0.06 | 0.29 | 1.72 | 1.75 |
| Others | |||||
| Hexadecasphinganine | C16 H35 N O2 | 57.38 | 3.35 | / | / |
| Choline | C5H14NO | 0.65 | 0.63 | 0.72 | 0.55 |
| (9S,13S)-12-Oxophytodienoic acid | C18 H28 O3 | / | 0.2 | 0.43 | 0.71 |
| Ethyl docosahexaenoate | C24 H36 O2 | 11.3 | 15.2 | 8.4 | 2.19 |
| Camalexin | C11 H8 N2 S | 178.2 | / | 0.72 | 0.81 |
Notes:
/ represented this metabolite was not detected in this group.
In DL-Avr vs. DL-CK or DL-Vir vs. DL-CK, many DAMs, including organic acids, amino acids and phenolic compounds, were differentially accumulated. Except proline, the content of almost all the detected amino acids was increased, such as glutamine, leucine, serine, valine, phenylalanine, and asparagine (Table 1). Besides, the accumulation level of all the detected phenolic compounds was increased in DL-Avr or DL-Vir, including 2′-hydroxy-4, 4′, 6′-trimethoxychalcone, sinapinic acid, cinnamic acid, p-coumaric acid and coumarone (Table 1). These results indicated that up-accumulation of amino acids and phenolic compounds was associated with SAR.
Since both Avr and Vir strains can induce SAR (Gruner et al., 2013), the DAMs that are consistently different in LL-Vir and LL-Avr or DL-Vir and DL-Avr are considered to be more related to SAR. Numerous DAMs showed the same accumulation tendency in LL-Vir and LL-Avr (termed as LL-common), such as 2′-hydroxy-4, 4′, 6′-trimethoxychalcone, aspartic acid, and hexadecasphinganine. In like manner, a number of DAMs displayed the same accumulation tendency in DL-Vir and DL-Avr (termed as DL-common), including coumaric acid, glutamine, leucine, serine, valine, phenylalanine, and adenine (Figs. 4B–4C, 4E and 4F, Table 1). Two DAMs showed the same accumulation trend both in LL-Common and DL-Common (Fig. 5). In detail, 2′-hydroxy-4, 4′, 6′-trimethoxychalcone was increased in LL-common and DL-common, whereas choline was decreased in LL-common and DL-common, suggesting these two DAMs were probably involved in signalling of SAR (Fig. 5, Table 1).
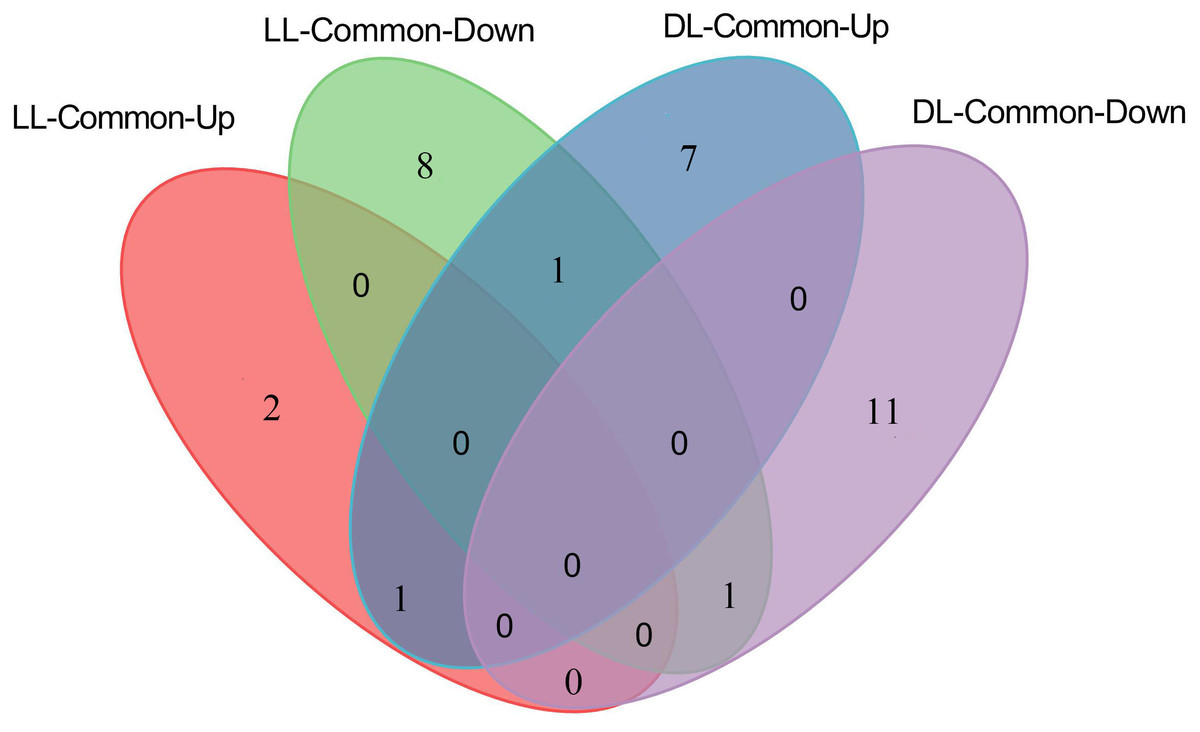
Figure 5: Number of up- and down-regulated metabolites commonly shared by LL-Avr vs. LL-CK and LL-Vir vs. LL-CK, DL-Avr vs. DL-CK and DL-Vir vs. DL-CK.
Discussion
Previous research showed that SAR could be fully established two days after induction by pathogens (Shah & Zeier, 2013). In the present work, the DAMs associated with SAR were identified, including phenolic compounds, amino acids, organic acids, sugars, nucleotides, coenzymes, and many other metabolites. The pathways related to these DAMs are shown in Fig. 6.
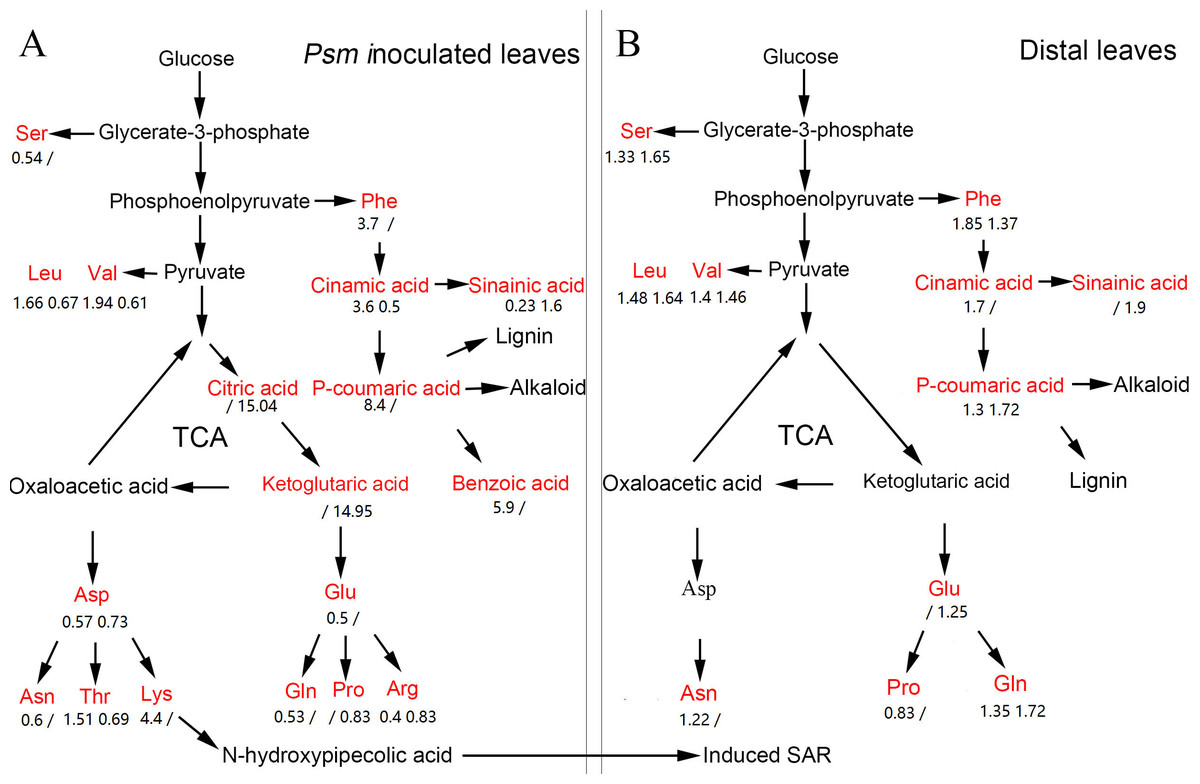
Figure 6: The pathway map involved in DAMs associated with phenolic compounds, amino acids, and organic acids in Psm-inoculated local leaves (A) and distal leaves of plants locally Psm-inoculated (B).
Red represents differentially accumulated metabolites. Numbers represent fold change of metabolites in LL-Vir vs. LL-CK and LL-Avr vs. LL-CK, or in DL-Vir vs. DL-CK and DL-Avr vs. DL-CK, respectively. A ‘/’ represented that this metabolite was not detected.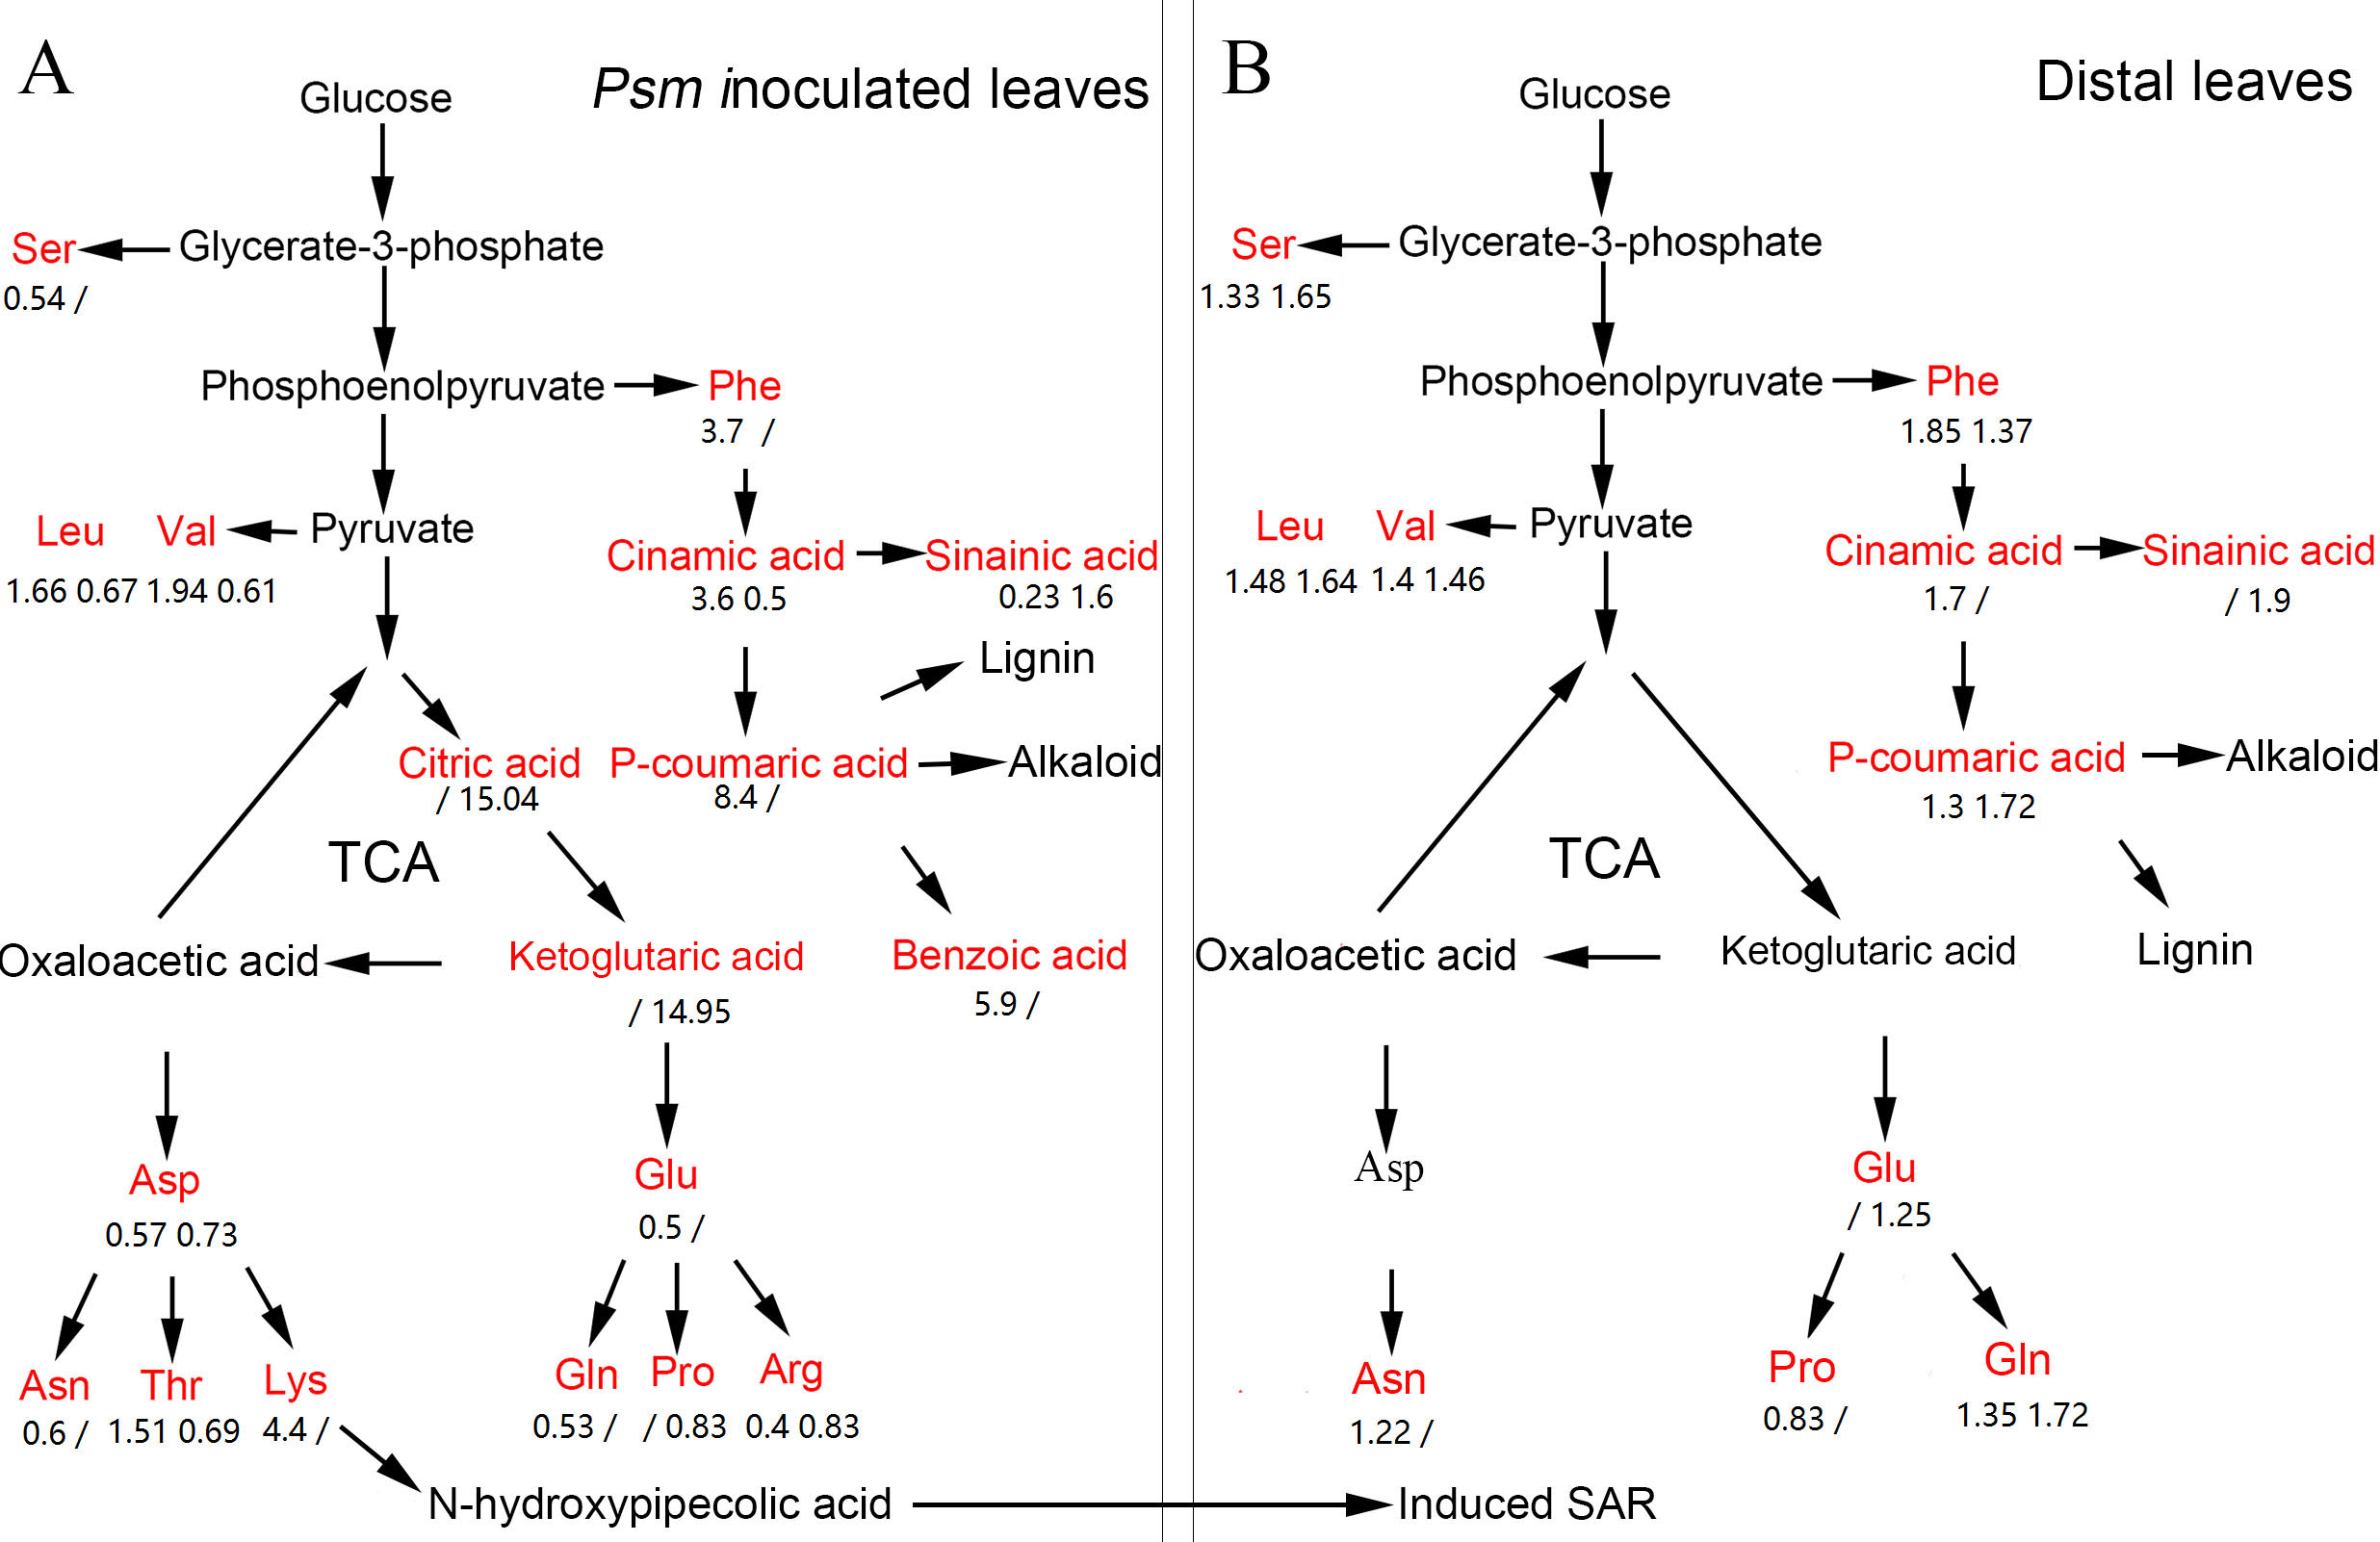
Phenolic compounds
Phenolic compounds are often produced and accumulated in plant tissues exposed to biotic or abiotic stresses (Clé et al., 2008; Schmitz-Hoerner & Weissenböck, 2003). To date, a lot of phenolic compounds have been confirmed to be biologically active in resistance to pathogens, such as soluble phenylpropanoids, flavones, and phytoalexins (Bhattacharya, Sood & Citovsky, 2010). Balmer et al. (2013) reported that the accumulation level of phenolic compounds was dramatically changed in local leaves infected by Colletotrichum graminicola and in systemic leaves in maize. In the present work, a number of phenolic compounds showed significant changes in Psm-inoculated local leaves and in uninfected distal leaves (Table 1, Fig. 6), such as 2′-hydroxy-4, 4′, 6′-trimethoxychalcone, sinapinic acid, cinnamic acid, and p-coumaric acid.
As the precursors of flavonoids that are widely found in plants, chalcones possess a relatively simple structure and diverse pharmacological effects, including antibacterial and antifungal activities (Alcaraz et al., 2004; Boeck et al., 2005; Chiaradia et al., 2008; Mascarello et al., 2010). As a derivative of chalcone, 2′-hydroxy-4, 4′, 6′-trimethoxychalcone can inhibit the growth of fungal pathogens (Costa et al., 2016). As a critical intermediate in the synthesis of lignin and alkaloids, p-coumaric acid plays an important role in plant defense responses. Previous research showed that p-coumaric acid could repress T3SS of Dickeya dadantii through the HrpX/Y two-component system (Li et al., 2009). In this study, 2′-hydroxy-4, 4′, 6′-trimethoxychalcone and p-coumaric acid were up-accumulated both in infected local leaves and in uninfected distal leaves, suggesting these two metabolites are related to SAR.
Sinapinic acid, an intermediate in phenylpropanoids metabolism, is involved in synthesis of many secondary metabolites in plants, including SA, lignin, and sinapoylglucose. In Arabidopsis, sinapoylglucose could specifically inhibit the growth of fungal pathogens, and a mutant of a sinapinic acid synthesis gene exhibited enhanced susceptibility to Verticillium longisporum (König et al., 2014). Cinnamic acid (CA) is an organic acid first isolated from cinnamon bark. The antimicrobial activities of CA and its derivatives have been confirmed in in vitro experiments (Sadeghi et al., 2013). CA can also damage the integrity of the plasma membrane and elevate the intracellular level of reactive oxygen species in Botrytis cinerea, indicating reactive oxygen species appeared to be responsible for the inhibitory effects of CA on the growth of fungal pathogens (Zhang et al., 2015). In the present work, the accumulation level of sinapinic acid and cinnamic acid were significantly increased in distal leaves of locally Psm-inoculated plants (Table 1, Fig. 6), indicating these two metabolites may play an important role in SAR.
Amino acids and the derivatives
It has been reported that the change of amino acid content in maize was related to the establishment of SAR (Balmer et al., 2013). In the present work, the accumulation levels of 14 amino acids and 3 amino acid derivatives were significantly changed in Psm-inoculated local leaves and in uninoculated distal leaves. Compared to MgCl2-infiltrated leaves, the contents of serine, aspartic acid, asparagine, glutamic acid, glutamine, arginine, and proline were decreased in LL-Avr and LL-Vir, whereas the contents of phenylalanine and lysine were increased. Except for proline, all the detected amino acids were up-accumulated in DL-Avr and DL-Vir, including serine, phenylalanine, leucine, valine, asparagine, glutamic acid, and glutamine (Table 1, Fig. 6).
Previous research showed that a number of plant pathogens have evolved to utilize the amino acids that are present in their hosts as carbon and nitrogen sources. For instance, the pathogenic P. syringae pv. tomato has been found to be nutritionally specialized to catabolize the abundant amino acids in tomato apoplast, including glutamine, glutamate, and aspartate (Rico & Preston, 2008; Seifi et al., 2013). The decrease of most amino acids in inoculated local leaves indicated that Arabidopsis is likely to cope with the infection of P. syringae by down-regulation of the content of some amino acids, such as glutamine, glutamate, and aspartate.
As an Asp-derived amino acid, lysine plays an important role in plant resistance to biotic stress. Loss-of-function of AGD2-LIKE DEFENSE RESPONSE PROTEIN1 (ALD1), a gene involved in lysine catabolism, resulted in reduction of the SA content and attenuation of the plant resistance to P. syringae (Song et al., 2004; Song, Lu & Greenberg, 2004; Hudson et al., 2006). N-hydroxypipecolic acid, a product of lysine catabolism, is an immune signal which can amplify the defense responses in plants, and acts as a critical regulator in local resistance, priming of systemic immunity and SAR (Zeier, 2013). In the present work, the content of aspartic acid was decreased in Psm-inoculated local leaves (Table 1, Fig. 6), further confirming that lysine is a strong feedback suppressor of the Asp-pathway (Yang & Ludewig, 2014),
Phenylalanine is the main precursor of many phenolic compounds, and plays important roles in plant resistance to biotic stress, such as protecting the plant tissue from infection and inhibiting the spore germination and the hyphal growth of the fungal pathogens (Tzin & Galili, 2010; Vogt, 2010; Maeda & Dudareva, 2012; Tohge et al., 2013). Consistent with this, phenylalanine and most detected phenolic compounds were up-accumulated in Psm-inoculated local leaves and in distal uninfected leaves in the present work (Table 1, Fig. 6), indicating the metabolic pathway of phenylalanine might be associated with the establishment of SAR.
Glutamine is a major amino donor for the synthesis of nucleotides and amino acids. Exogenous application of glutamine could rapidly induce the key transcriptional factor genes involved in stress responses (Kan et al., 2015). In the present work, glutamine was up-accumulated in distal leaves of the locally Psm-inoculated plants, revealing a relationship with the activation of the stress-related genes. In summary, our data showed that amino acids played important roles in SAR in Arabidopsis.
Organic acids
The accumulation level of 6 organic acids were significantly changed in local Psm-inoculated leaves or distal uninfected leaves. Two intermediates of the TCA cycle, citric acid and ketoglutaric acid, were up-accumulated in LL-Avr (Table 1, Fig. 6). The TCA cycle is a central metabolic pathway for aerobic processes, and is responsible for energy production from fatty acid, carbohydrate, and amino acids (Fernie, Carrari & Sweetlove, 2004). It has been shown that the defense induction is a cost-intensive process, and almost all of the inducible resistances are known to be highly energy-demanding and heavily rely on the intermediates generated by the TCA cycle (Berger, Sinha & Roitsch, 2007). The up-accumulation of citric acid and ketoglutaric acid indicated that the TCA cycle could be enhanced by Avr inoculation in local leaves, which could provide more energy and more intermediates for resistance to pathogens.
Other DAMs associated with SAR
Besides phenolic compounds, amino acids, and organic acids, many other DAMs were identified as potential candidates associated with SAR, such as hexadecasphinganine, choline, and (9S,13S)-12-oxophytodienoic acid. Sphingolipids, the primary lipid components of eukaryotic membranes, play important roles in regulation of signal transduction, programmed cell death, vesicular trafficking, autophagy, and alternative splicing (Sentelle et al., 2012; Young, Kester & Wang, 2013). Mutants of AtACER, which encodes a ceramidase involved in hydrolyzation of sphingolipids into sphingosine and fatty acids, exhibited susceptibility to P. syringae (Wu et al., 2015). The data of the present work showed that hexadecasphinganine, a sphingolipid, was up-accumulated in Psm-inoculated local leaves (Table 1). It suggests that hexadecasphinganine may contribute to the basic resistance and the establishment of SAR.
As an important phytohormone, JA (jasmonic acid) mediates the responses against necrotrophic pathogens, and acts as a signalling molecule to facilitate the interaction between the plants and the root-associated beneficial microorganisms (Pieterse et al., 2009). Different from JA, SA plays a key role in plant immunity against biotrophic pathogens (Betsuyaku et al., 2018). It is well known that JA and SA can antagonistically regulate many processes of plant resistances to biotic stress (Betsuyaku et al., 2018). Consistently, the (9S,13S)-12-oxophytodienoic acid, a precursor of JA, was decreased in LL-Avr, DL-Vir and DL-Avr, suggesting suppression of the JA-mediated pathways contributes to the establishment of SAR.
Conclusions
In the present work, we explored the differentially accumulated metabolites by UPLC-MS/MS at the time when SAR was just fully established. The results of this study provide a new viewpoint that will assist to better understand the complex molecular and cellular events occur during the establishment of SAR. A number of metabolites were identified as potential components associated with SAR. The significant changes of phenolic compounds, amino acids, nucleotides and nucleotide derivatives, organic acids, and other metabolites in Psm-inoculated local leaves and distal leaves suggest that these DAMs may play important roles in SAR. The up-accumulation of phenolic compounds in Psm-inoculated local leaves and distal leaves illustrates that these metabolites could be used as key intermediates for the synthesis of various secondary metabolites contributing to basal defense and systemic immunity. Furthermore, the contents of multiple amino acids are increased both in DL-Avr and DL-Vir, including leucine, serine, valine and phenylalanine, suggesting these amino acids may play a crucial role in establishment of SAR. In addition, the changed contents of various metabolites in Psm-inoculated local leaves and distal leaves indicate that plants can reallocate a portion of the physiological activities during the establishment of the basic resistance and the SAR to cope with the imminent infection of the pathogens.