Quantifying spatial patterns of grass response to nutrient additions using empirical and neutral semivariogram models
- Published
- Accepted
- Subject Areas
- Conservation Biology, Ecology, Ecosystem Science
- Keywords
- fertilization, geostatistics, Africa, spatial autocorrelation, scale, autocorrelation, grassland, nutrient limitation, semivariogram, maximum likelihood
- Copyright
- © 2016 Smithwick et al.
- Licence
- This is an open access article distributed under the terms of the Creative Commons Attribution License, which permits unrestricted use, distribution, reproduction and adaptation in any medium and for any purpose provided that it is properly attributed. For attribution, the original author(s), title, publication source (PeerJ Preprints) and either DOI or URL of the article must be cited.
- Cite this article
- 2016. Quantifying spatial patterns of grass response to nutrient additions using empirical and neutral semivariogram models. PeerJ Preprints 4:e2078v1 https://doi.org/10.7287/peerj.preprints.2078v1
Abstract
Disturbances influence vegetation patterns at multiple scales, but studies that isolate the effect of scale are rare, meaning that scale and process are often confounded. To explore this, we imposed a large (~3.75 ha) experiment in a South African coastal grassland ecosystem to determine the spatial scale of grass response to nutrient additions. In two of six 60 x 60 m grassland plots, we imposed nutrient additions using a scaled sampling design in which fertilizer was added in replicated sub-plots of varying sizes (1 x 1 m, 2 x 2 m, and 4 x 4 m). The remaining plots either received no additions, or were fertilized evenly across the entire plot area. We calculated empirical semi-variograms for all plots one year following nutrient additions to determine whether the scale of grass response (biomass and nutrient concentrations) corresponded to the scale of the sub-plot additions and compared these results to reference plots (unfertilized or unscaled). In addition, we calculated semi-variograms from a series of simulated landscapes generated using random or structured patterns (neutral models) and compared the semivariogram parameters between simulated and empirical landscapes. Results from the empirical semivariograms showed that there was greater spatial structure in plots that received additions at sub-plot scales, with range values that were closest to the 2 x 2 m grain. These results were in agreement with simulated semivariograms using neutral models, supporting the notion that our empirical results were not confounded by random effects. Overall, our results highlight that neutral models can be combined with empirical semivariograms to identify multi-scalar ecological patterns and this hybrid approach should be used more widely in ecological studies.
Author Comment
This is a submission to PeerJ for review.
Supplemental Information
Soil N, P, C, pH. Soil nutrients and pH
Soil nitrogen (%) and phosphorus content (mg kg-1), and soil pH (mean ± 1 standard error (SE)) across fenced treatments only, and in Mkambathi Nature Reserve, one year following nutrient additions.
Empirical and simulated spatial model parameters of biomass
Spatial model parameters [range (3* φ), sill (σ2), nugget (τ2), and noise to signal ratio (τ2/(τ2 + σ2)] of empirical and simulated biomass across treatments. Sill and nugget values are scaled (0-1) to facilitate comparisons across treatments.
Empirical spatial model parameters of vegetation and soil nutrients
Parameters of the empirical spatial model of vegetation phosphorus and nitrogen (%), soil phosphorus (P) and nitrogen (N), and soil (C) using maximum likelihood analysis across experimental plots in Mkambathi Nature Reserve, one year following nutrient fertilization. nd=not defined.
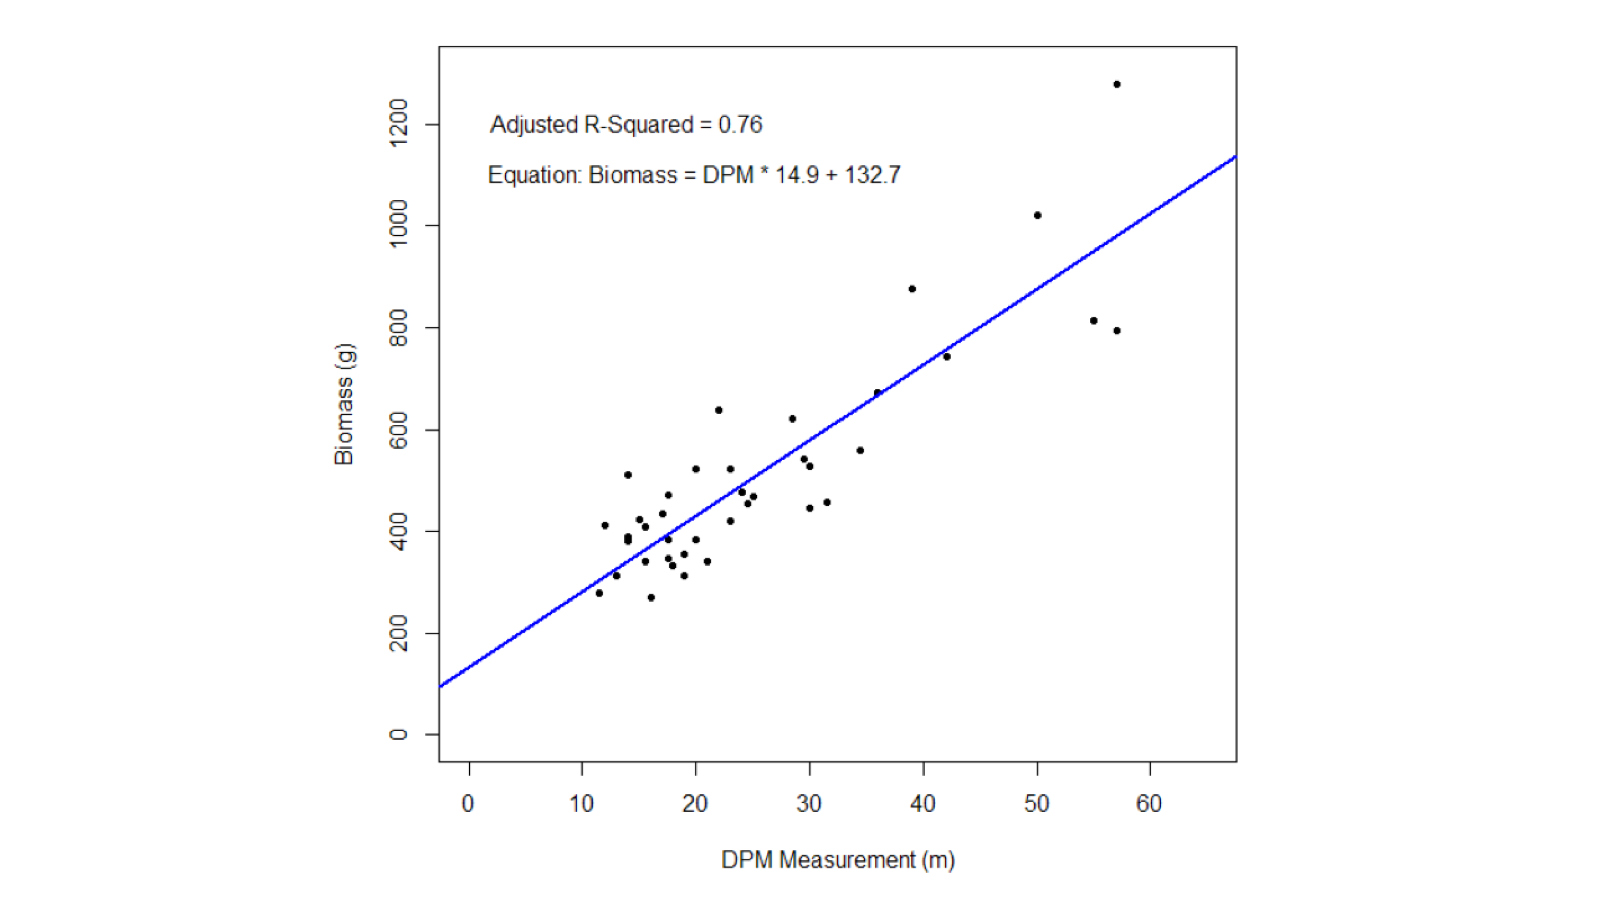
Disc Pasture Meter calibration
Results of the linear regression to calibrate disc pasture meter (DPM) readings to vegetation biomass (n=60).