
Demographic history and population genetic analysis of Decapterus maruadsi from the northern South China Sea based on mitochondrial control region sequence
- Published
- Accepted
- Received
- Academic Editor
- Per Palsboll
- Subject Areas
- Biodiversity, Marine Biology, Population Biology
- Keywords
- Decapterus maruadsi, Demographic history, Population genetic, The northern South China Sea
- Copyright
- © 2019 Niu et al.
- Licence
- This is an open access article distributed under the terms of the Creative Commons Attribution License, which permits unrestricted use, distribution, reproduction and adaptation in any medium and for any purpose provided that it is properly attributed. For attribution, the original author(s), title, publication source (PeerJ) and either DOI or URL of the article must be cited.
- Cite this article
- 2019. Demographic history and population genetic analysis of Decapterus maruadsi from the northern South China Sea based on mitochondrial control region sequence. PeerJ 7:e7953 https://doi.org/10.7717/peerj.7953
Abstract
Late Pleistocene climate oscillations are believed to have greatly influenced the distribution, population dynamics, and genetic variation of many marine organisms in the western Pacific. However, the impact of the late Pleistocene climate cycles on the demographic history and population genetics of pelagic fish in the northern South China Sea (SCS) remains largely unexplored. In this study, we explored the demographic history, genetic structure, and genetic diversity of Decapterus maruadsi, a typical pelagic fish, over most of its range in the northern SCS. A 828–832 bp fragment of mitochondrial control region were sequenced in 241 individuals from 11 locations. High haplotype diversity (0.905–0.980) and low nucleotide diversity (0.00269–0.00849) was detected, revealing low levels of genetic diversity. Demographic history analysis revealed a pattern of decline and subsequent rapid growth in the effective population size during deglaciation, which showed that D. maruadsi experienced recent demographic expansion after a period of low effective population size. Genetic diversity, genetic structure, and phylogenetic relationship analysis all demonstrated that no significant genetic differentiation existed among the populations, indicating that D. maruadsi was panmictic throughout the northern SCS. Periodic sea-level changes, fluctuation of the East Asian Monsoon, and Kuroshio variability were responsible for the population decline and expansion of D. maruadsi. The demographic history was the primary reason for the low levels of genetic diversity and the lack of significant genetic structure. The life history characteristics and ocean currents also had a strong correlation with the genetic homogeneity of D. maruadsi. However, the genetic structure of the population (genetic homogeneity) is inconsistent with biological characteristics (significant difference), which is an important reminder to identify and manage the D. maruadsi population carefully.
Introduction
Late Pleistocene climate oscillations drastically altered the sea-level and nutrient inputs into the western Pacific marginal seas. This is believed to have greatly influenced the population distribution, genetic variation, and demographic history of marine organisms (Hewitt, 2000; Lambeck, Esat & Potter, 2002; Liu et al., 2007; Xue et al., 2014; He et al., 2015). For example, the South China Sea (SCS) became a semi-enclosed sac-shaped gulf and a total of 0.7 million km2 of continental shelf was exposed during the Last Glacial Maximum (LGM, 26.5–19.0 kyr before present) (Wang & Sun, 1994; Clark et al., 2009). The remarkable changes would have greatly reduced the available habitat for marine organisms, and the displaced populations would have likely retreated to the glacial refuge of the SCS during the LGM (Liu et al., 2006; He et al., 2014). Meanwhile, the LGM also unquestionably changed the surface circulation in the SCS, with the eastward shift of the Kuroshio path, for example (Nan, Xue & Yu, 2015). Nutrient inputs changed along with the East Asian Monsoon circulations and sea-level fluctuations, which are closely associated with primary productivity and fish production (Jian, Wang & Kienast, 1999; Jian et al., 1999). Thus, the cyclic changes during the Late Pleistocene era in the sea-level and nutrient inputs likely led to expansions and contractions in the populations of marine organisms (Grant & Bowen, 1998; Liu et al., 2006; He et al., 2014). These historic processes are thought to have greatly influenced the evolutionary patterns of the populations of several coastal organisms in the northern SCS, such as genetic differentiation caused by population contraction or genetic homogeneity resulting from population expansion (Liu et al., 2007; He et al., 2010; He et al., 2015). However, the impact of late Pleistocene climatic cycles on the demographic history and population genetics of pelagic fish in the northern SCS remains largely unexplored.
The round scad, Decapterus maruadsi (Temminck & Schlegel, 1844), is a warm-water pelagic fish of the family Carangidae (Teleostei, Perciformes). It is widely distributed in the coastal waters of the western Pacific, including those near China, Korea, and Japan (Liu et al., 2016). It is one of the most important fish in China and is especially abundant in the northern SCS (Deng & Zhao, 1991). The annual catch from the northern SCS reached about 2. 8 ×10⁵ tons between 1998–2017, with a maximum catch of approximately 3. 6 ×10⁵ tons being recorded in 2002 (Ministry of Agriculture Fishery Administration, 1999-2018). In the northern SCS, D. maruadsi is endemic and has obvious regional characteristics (Deng & Zhao, 1991). The fish is not a long-distance migration species and only migrates seasonally over short distances from North-South or deep-shallow in the continental shelf (<180 m) of the northern SCS (Zheng et al., 2014). Moreover, D. maruadsi spawns mainly in the northern shallow continental shelf of the SCS (less than 120 m). The exposure of the shallow continental shelf of the northern SCS during the late Pleistocene climate fluctuations would inevitably change the population abundance, demographic history, and genetic variation of D. maruadsi. For these reasons, D. maruadsi is a good fish with which to research the effects of paleoclimatic fluctuations on the demographic history and population genetics of pelagic fish in the northern SCS.
The previous studies of D. maruadsi have mainly focused on resource and fishery biology and little is known about their demographic history. Although the population genetics of D. maruadsi in the northern SCS have been analyzed by mitochondrial cytochrome b (Cyt b) sequence variation (Niu et al., 2018), the results of population genetic homogeneity are not consistent with those of the demographic structure. According to its distribution and ecological characteristics, D. maruadsi in the northern SCS is divided into seven different stocks, including the Minnan-Taiwan shoal, the area off Jiazi in the east Guangdong, the Pearl River estuary, western Guangdong, Hainan Qinglan, Beibu Gulf, and the sea off of the Pearl River estuary (Deng & Zhao, 1991). These inconsistencies require us to determine the population structure of D. maruadsi in the northern SCS using a mitochondrial control region sequence that has a faster evolutionary rate than Cyt b. Accurate genetic data is necessary to appropriately identify the ‘Management Units’ (MUs), which are fundamental to proper short-term management (Moritz, 1994). Genetic data has been widely used recently in the identification of the populations and conservation units for some aquatic species (Waples, Punt & Cope, 2008).
In the present study, 11 populations of D. maruadsi were collected throughout the northern SCS to assess the evolutionary history and population genetics based on the mitochondrial control region sequence. Specifically, we attempted to investigate the evolutionary influences of Late Pleistocene era sea-level fluctuations, monsoon oscillations, and the shift of surface circulation on the demographic history and genetic variation of D. maruadsi. The results will provide new insights into the MU’s identification and consequently, the fishery management of D. maruadsi.
Materials & Methods
Sample collection
Two hundred forty-one adult D. maruadsi were collected between March 2010 and May 2014 from 11 populations in the northern SCS (Fig. 1 and Table 1) namely, the Shantou inshore water (ST, N = 37), the Zhuhai inshore water (ZH, N = 20), the Yangjiang inshore water (YJ, N = 10), the Maoming inshore water (MM, N = 30), the Zhanjiang inshore water (ZJ, N = 10), the Wenchang inshore water (WC, N = 28), the Sanya inshore water (SY1, N = 25), the Sanya offshore water (SY2, N = 10), the Baimajing inshore water (BMJ1, N = 26), the Baimajing offshore water (BMJ2, N = 18), and the Beihai inshore water (BH, N = 27). After morphological identification, muscle tissues were taken from individual fish and stored in 95% ethanol at −20 °C until DNA extraction.
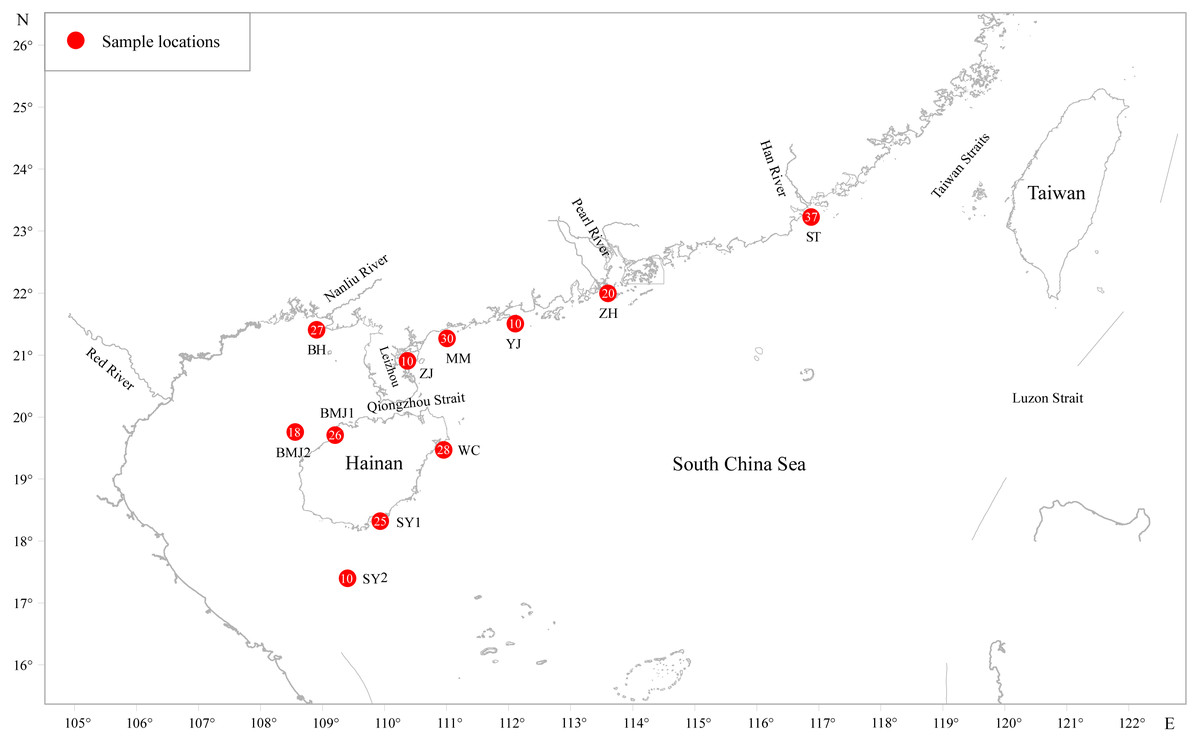
Figure 1: Sampling localities for D.maruadsi in the northern South China Sea.
Populations are marked by abbreviations and the accompanying pie charts with numbers indicate the number of individuals for each locality.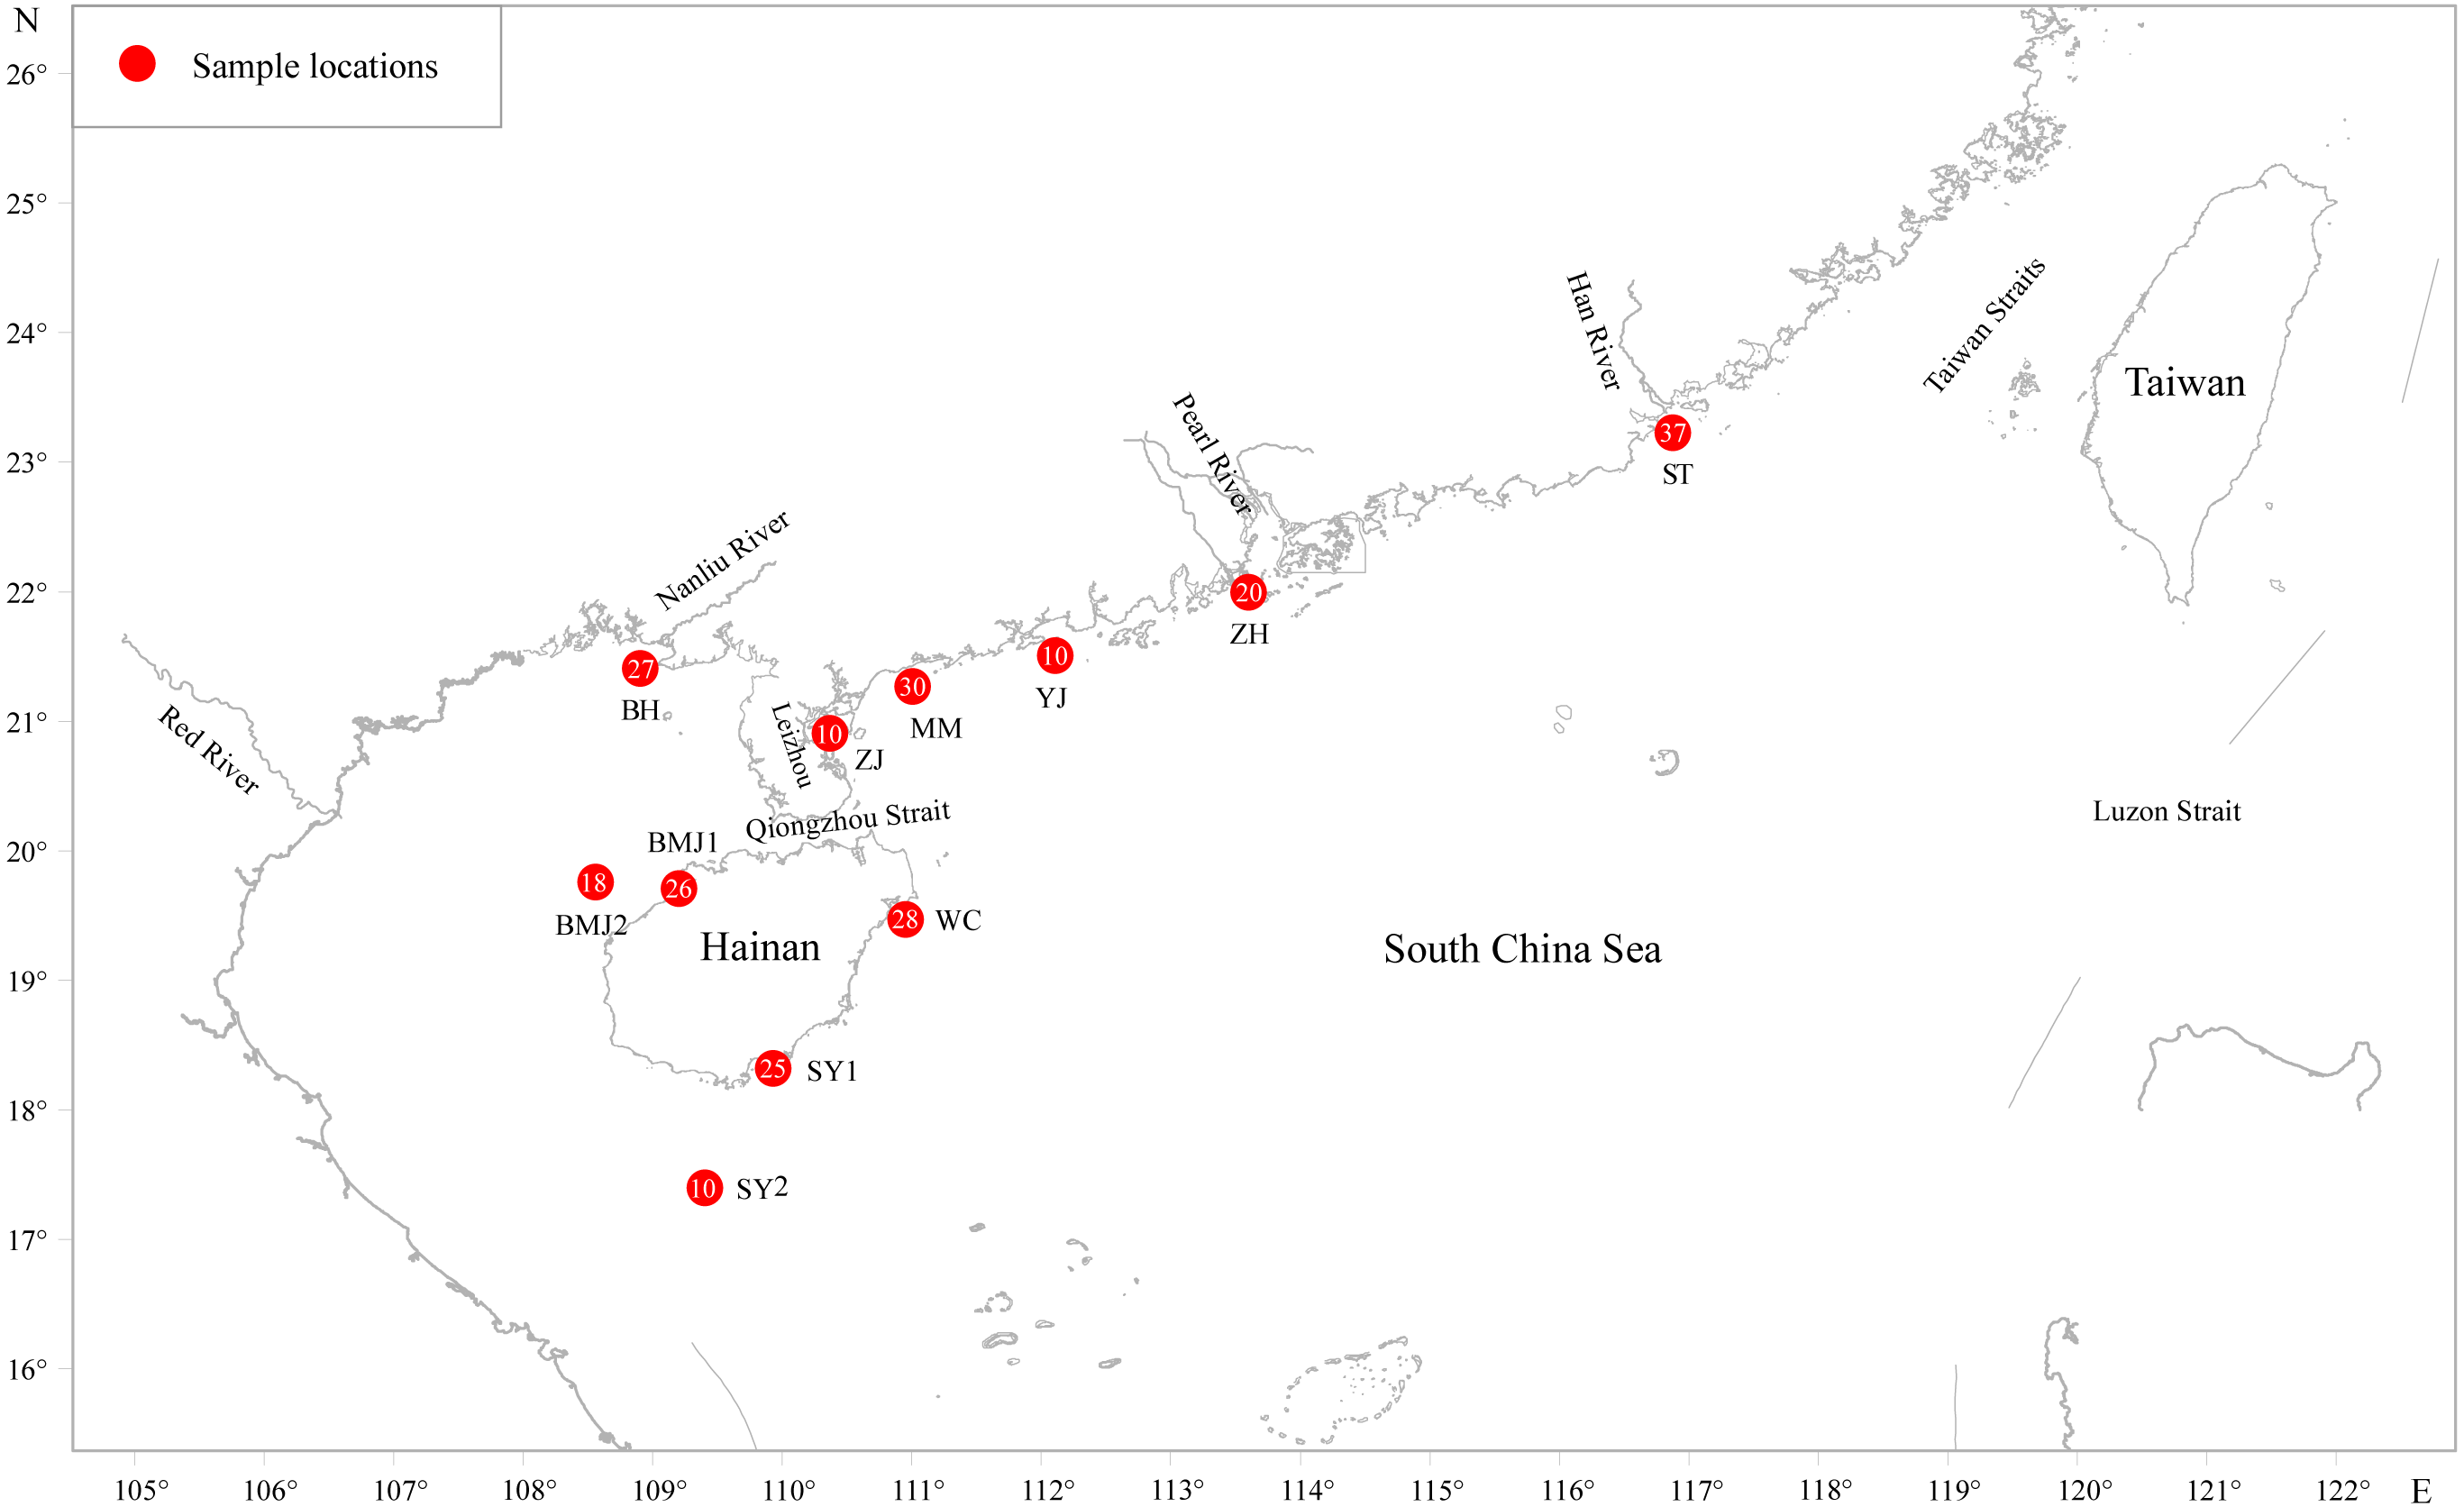
| Populations | D | N | Hn | h ± SD | π ± SD | K ± SD | PS |
|---|---|---|---|---|---|---|---|
| ST | 2014.03 | 37 | 20 | 0.946 ± 0.021 | 0.00392 ± 0.00230 | 3.252 ± 1.714 | 23 |
| ZH | 2014.01 | 20 | 13 | 0.905 ± 0.054 | 0.00382 ± 0.00230 | 3.171 ± 1.712 | 18 |
| YJ | 2014.04 | 10 | 9 | 0.978 ± 0.054 | 0.00453 ± 0.00282 | 3.757 ± 2.068 | 14 |
| MM | 2012.05 | 30 | 21 | 0.960 ± 0.022 | 0.00350 ± 0.00210 | 2.912 ± 1.572 | 20 |
| ZJ | 2013.07 | 10 | 9 | 0.978 ± 0.054 | 0.00269 ± 0.00183 | 2.233 ± 1.341 | 9 |
| WC | 2014.05 | 28 | 18 | 0.960 ± 0.020 | 0.00404 ± 0.00238 | 3.350 ± 1.771 | 22 |
| SY1 | 2014.04 | 25 | 19 | 0.967 ± 0.024 | 0.00849 ± 0.00460 | 7.053 ± 3.426 | 58 |
| SY2 | 2010.03 | 10 | 7 | 0.933 ± 0.062 | 0.00354 ± 0.00229 | 2.934 ± 1.677 | 9 |
| BMJ1 | 2014.04 | 26 | 16 | 0.942 ± 0.029 | 0.00402 ± 0.00238 | 3.339 ± 1.770 | 18 |
| BMJ2 | 2013.11 | 18 | 15 | 0.980 ± 0.024 | 0.00468 ± 0.00275 | 3.881 ± 2.043 | 23 |
| BH | 2013.01 | 27 | 17 | 0.940 ± 0.031 | 0.00482 ± 0.00277 | 4.001 ± 2.064 | 22 |
| Total | 241 | 94 | 0.953 ± 0.007 | 0.00443 ± 0.00249 | 3.691 ± 1.873 | 91 |
Notes:
- D
-
date of collection
- N
-
sample size
- Hn
-
number of haplotype
- h ± SD
-
haplotype diversity including standard deviation (SD)
- π ± SD
-
nucleotide diversity including SD
- K ± SD
-
mean number of pairwise differences including SD
- PS
-
polymorphic site
- ST
-
Shantou inshore water
- ZH
-
Zhuhai inshore water
- YJ
-
Yangjiang inshore water
- MM
-
Maoming inshore water
- ZJ
-
Zhanjiang inshore water
- WC
-
Wenchang inshore water
- SY1
-
Sanya inshore water
- SY2
-
Sanya offshore water
- BMJ1
-
Baimajing inshore water
- BMJ2
-
Baimajing offshore water
- BH
-
Beihai inshore water
DNA extraction, PCR, and sequencing
Total genomic DNA was extracted from muscle tissue using the phenol-chloroform protocol (Huang et al., 2002). Polymerase chain reactions (PCRs) for mtDNA control regions were performed in 50 µl containing 39.5 µL dH2O, 5 µL 10 × EasyTaq buffer, 1 µL dNTP mixture (10 mM), 1 µL forward primer (10 µM, 5′-AACTCCCAAAGCTAGGATTCT-3′), 1 µL reverse primer (10µM, 5′-TTTGTGCTTGCGGGGCTTT-3′) (Niu et al., 2012), 2.5U EasyTaq DNA polymerase (TransGen Biotech Co., Ltd., Beijing, China), and 2 µL template DNA (50–100 ng). PCR reactions were performed in a Veriti 96 Well Fast Thermal Cycler (Applied Biosystems, Foster City, CA, USA) under the following parameters: initial denaturation at 94 °C for 5 min followed by 35 cycles of 45 s denaturation at 94 °C, 45 s annealing at 55 °C, and 1 min elongation at 72 °C. The amplification cycle finished with a final elongation at 72 °C for 10 min. All sets of PCR included a negative control reaction tube in which all reagents were included except the template DNA. The PCR products were separated by electrophoresis on 1.2% agarose gel and the Trans 2K DNA Marker (TransGen Biotech Co., Ltd., Beijing, China) was used for identifying the target gene size. Successfully amplified PCR products were sent to GenScript Biotech (Nanjing, China) for sequencing.
Data analysis
Sequences were edited and aligned with the DNASTAR software package (Allex, 1999). All sequences were trimmed using the MEGA 6.06 software (Tamura et al., 2013). Molecular diversity indices, including haplotype diversity (h), nucleotide diversity (π), the mean number of pairwise differences (K), indels, and polymorphic sites, were calculated using the software Arlequin 3.5 (Excoffier & Lischer, 2010). The models of the nucleotide sequence evolution were evaluated by jModelTest v2.1.10 (Darriba et al., 2012), and the Hasegawa-Kishino-Yano (HKY) nucleotide substitution model with a gamma distribution (0.811) and a proportion of invariable sites (0.792) was chosen for the evolutionary analyses.
A Bayesian phylogeny was inferred for all haplotypes under the HKY+G+I model by MrBayes 3.2.6 software (Ronquist et al., 2012). The analysis was run for 10,000,000 generations until the average standard deviation of split frequencies fell below 0.01. The first 25% of burn-in trees were discarded and the subsequent trees were combined to produce a phylogram. Ultimately, a Bayesian inference tree was created and viewed using FigTree 1.4.3 software. The congener, Decapterus macarellus (GenBank accession number: KM986880) and Decapterus macrosoma (GenBank accession number: KF841444) mtDNA control regions were used as the outgroup. The genealogical relationship among the haplotypes was further evaluated using the media-joining network constructed with Network 5.0.0.3 software (Bandelt, Forster & Rohl, 1999).
Hierarchical analysis of molecular variance (AMOVA) with 10,000 permutations was performed to test the population genetic structure of D. maruadsi in the northern SCS. To quantify the genetic divergence, we computed pairwise FST (fixation index) values between populations with 10,000 permutations. An exact test of population differentiation based on haplotype frequencies was also examined with 100,000 steps in the Markov Chain. AMOVA, FST , and the exact test were all calculated using the software Arlequin 3.5.
Historical expansion patterns of D. maruadsi for all populations pooled together were calculated using three different approaches. First, Tajima’s D and Fu’s Fs neutrality tests with 10,000 permutations were calculated in Arlequin 3.5 to test the selective neutrality of the D. maruadsi control region. Secondly, nucleotide mismatch distribution was performed in Arlequin 3.5 and DnaSP 5.10.01 (Librado & Rozas, 2009) to detect the population expansion history. The fit between the unimodal observed and expected distributions was evaluated by the test statistics of goodness-of-fit, including the sum of squared deviation (SSD) and Harpending’s raggedness index (Hri). The statistical significance was estimated with 1,000 bootstrap replicates. Finally, the Bayesian skyline plot was implemented in BEAST 1.7.5 under the HKY+G+I nucleotide substitution model and strict molecular clock model to estimate the change in effective population size across time (Drummond et al., 2012). The Markov Chain Monte Carlo (MCMC) analysis was run for 1 billion generations, yielding high effective sample sizes (ESS) of at least 200, of which the first 10% were discarded as a burn-in. The analysis results were visualized using Tracer 1.7 (Rambaut et al., 2018).
Molecular rate and its calibration
The molecular rate of control region seems to vary among different bony fishes, such as 3% per myr for rainbow fishes (Zhu et al., 1994), 6.5–8.8% per myr for cichlid fishes (Sturmbauer et al., 2001), and 5–10% per myr for Arctic charr (Brunner et al., 2001). However, there has been no a molecular rate specialized for control region of the fish from Carangidae family. D. maruadsi has a small body size, high metabolic rate, and short generation time, suggesting that a rapid molecular clock may be more appropriate for the D. maruadsi control region. Thus, a per lineage mutation of 3.75% per myr calculated from the reported control region divergence rates (5–10% per myr) was used for the Bayesian skyline plot analysis of D. maruadsi in the present study (Brunner et al., 2001; Liu, 2006; Li et al., 2018).
Several researchers have suggested that it is necessary to calibrate the molecular mutation rate in the analysis of historical population demography (Ho et al., 2005; Ho et al., 2008; Crandall et al., 2012). If the molecular rate is not calibrated on timescales of less than approximately 1–2 Myr before the present, the population expansion time will be overestimated. According to the research results of Ho et al. (2008) and Crandall et al. (2012), 3–10 × faster mutation rates were used to calibrate the population expansion time in the present study. Even so, the evolutionary time estimated based on molecular rate provides an approximate time frame for demographic history.
Results
Genetic diversity and haplotype patterns
The partial length sequences of the control region were 828–832 bp. The calculated genetic variations were summarized in Table 1. Sequence alignment revealed 65 transitions, 23 transversions, 11 indels, and 91 polymorphic sites. The h of the total population was 0.953, with a range of 0.905–0.980. The π and K ranged from 0.00269 (ZJ) to 0.00849 (SY1) and from 2.233 (ZJ) to 7.053 (SY1), respectively. This showed that the SY1 population had the highest level of genetic diversity, while the ZJ population had the lowest. The overall π and K were 0.00443 and 3.691, respectively, indicating low levels of genetic diversity in the D. maruadsi population in the northern SCS.
Ninety-one polymorphic sites were observed in the 241 sequences, and defined 94 haplotypes (GenBank accession number: MK294641–MK294734), of which 20 (21.28%) were shared among populations, with a relative frequency ranging from 0.83% to 15.77% (Table 2). For example, H21 (38 specimens, 15.77%) was found in all populations and showed the highest relative frequency among all haplotypes. The main haplotype, H7 (20 specimens, 8.30%), was shared by all populations except the ZJ population. Haplotypes H29 (nine specimens, 3.73%), H57 (18 specimens, 7.47%), H63 (14 specimens, 5.83%), and H74 (16 specimens, 6.64%) occurred in six, eight, seven, and seven populations, respectively. These shared haplotypes also showed different relative frequencies in different populations. The remaining 74 haplotypes (78.72%) were all unique to a single population (private haplotypes), and most of them (71, 95.95%) were singletons.
| Haplotypes | ST | ZH | YJ | MM | ZJ | WC | SY1 | SY2 | BMJ1 | BMJ2 | BH | Total |
|---|---|---|---|---|---|---|---|---|---|---|---|---|
| H7 | 3 | 1 | 2 | 3 | 3 | 2 | 1 | 2 | 2 | 1 | 20 | |
| H8 | 3 | 2 | 5 | |||||||||
| H12 | 1 | 1 | 2 | |||||||||
| H16 | 1 | 1 | 2 | 4 | ||||||||
| H21 | 7 | 6 | 1 | 5 | 1 | 4 | 3 | 1 | 2 | 2 | 6 | 38 |
| H29 | 3 | 1 | 1 | 1 | 1 | 2 | 9 | |||||
| H35 | 1 | 1 | 2 | |||||||||
| H40 | 1 | 1 | 1 | 1 | 4 | |||||||
| H45 | 1 | 1 | 2 | |||||||||
| H50 | 1 | 1 | 2 | |||||||||
| H51 | 1 | 1 | 2 | 1 | 1 | 6 | ||||||
| H55 | 2 | 1 | 1 | 4 | ||||||||
| H57 | 2 | 3 | 2 | 1 | 1 | 1 | 5 | 3 | 18 | |||
| H59 | 1 | 1 | 1 | 1 | 1 | 5 | ||||||
| H62 | 1 | 1 | 1 | 3 | ||||||||
| H63 | 3 | 1 | 1 | 2 | 4 | 1 | 2 | 14 | ||||
| H70 | 1 | 1 | 2 | |||||||||
| H74 | 2 | 1 | 3 | 2 | 3 | 4 | 1 | 16 | ||||
| H81 | 1 | 1 | 2 | 1 | 5 | |||||||
| H90 | 1 | 2 | 3 | |||||||||
| PH(IN) | 10(10) | 6(6) | 3(3) | 9(9) | 4(4) | 8(9) | 11(11) | 1(1) | 9(10) | 7(7) | 6(7) | 77 |
| Total | 37 | 20 | 10 | 30 | 10 | 28 | 25 | 10 | 26 | 18 | 27 | 241 |
Notes:
- PH
-
Private haplotypes
- IN
-
individual number
The PH of ST population are as follows: H22, H27, H43, H65, H77, H82, H85, H88, H89, and H92. The PH of ZH population are as follows: H14, H20, H34, H52, H71, and H79. The PH of YJ population are as follows: H48, H54, and H69. The PH of MM population are as follows: H4, H6, H9, H10, H25, H39, H46, H58, and H75. The PH of ZJ population are as follows: H28, H30, H33, and H73. The PH of WC population are as follows: H5, H15, H36, H47, H64, H67, H83, and H86. The PH of SY1 population are as follows: H2, H19, H24, H37, H38, H53, H61, H78, H84, H93, and H94. The PH of SY2 population is H11. The PH of BMJ1 population are as follows: H1, H3, H13, H18, H26, H32, H44, H60, and H87. The PH of BMJ2 population are as follows: H17, H23, H31, H49, H66, H68, and H72. The PH of BH population are as follows: H41, H42, H56, H76, H80, and H91.
Phylogenetic relationship
The Bayesian inference tree (Fig. 2) for the 94 haplotypes of D. maruadsi showed that haplotypes in every population were scattered throughout the tree and no clustering was observed that corresponded to the sampling localities. A haplotype network (Fig. 3) revealed the presence of six central dominant haplotypes (H7, H21, H29, H57, H63, and H74) at high frequencies across 6–11 populations. All other low-frequency haplotypes radiated in a star-like fashion out from the dominant haplotypes by a few mutational steps. The sharing of interior haplotypes and the endemic distribution of terminal haplotypes indicated the genetic homogeneity among the populations and recent population expansions. This was consistent with the Bayesian inference tree of the 94 haplotypes.
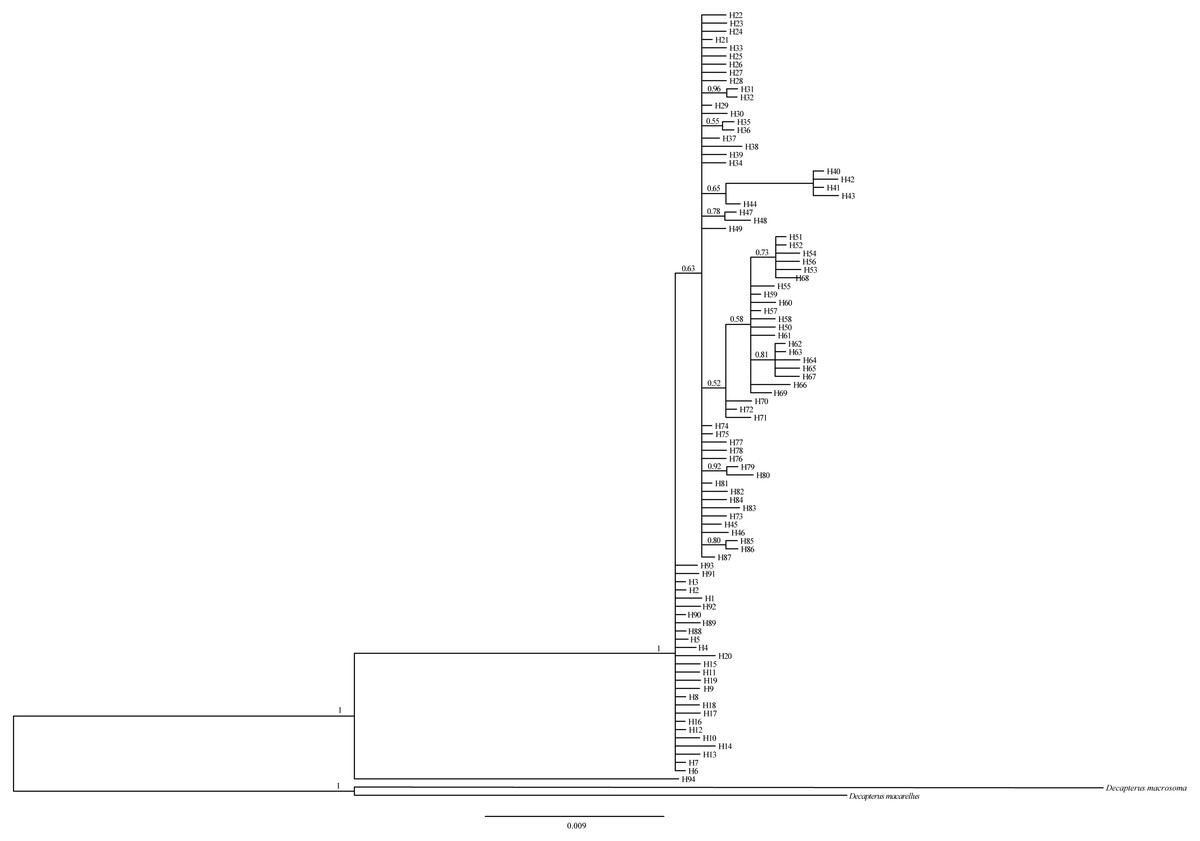
Figure 2: Bayesian inference tree for 94 mtDNA control region haplotypes in D.maruadsi.
The congener, Decapterus macarellus and Decapterus macrosoma mtDNA control regions are used as outgroups. The numbers on the branches show the posterior probability values.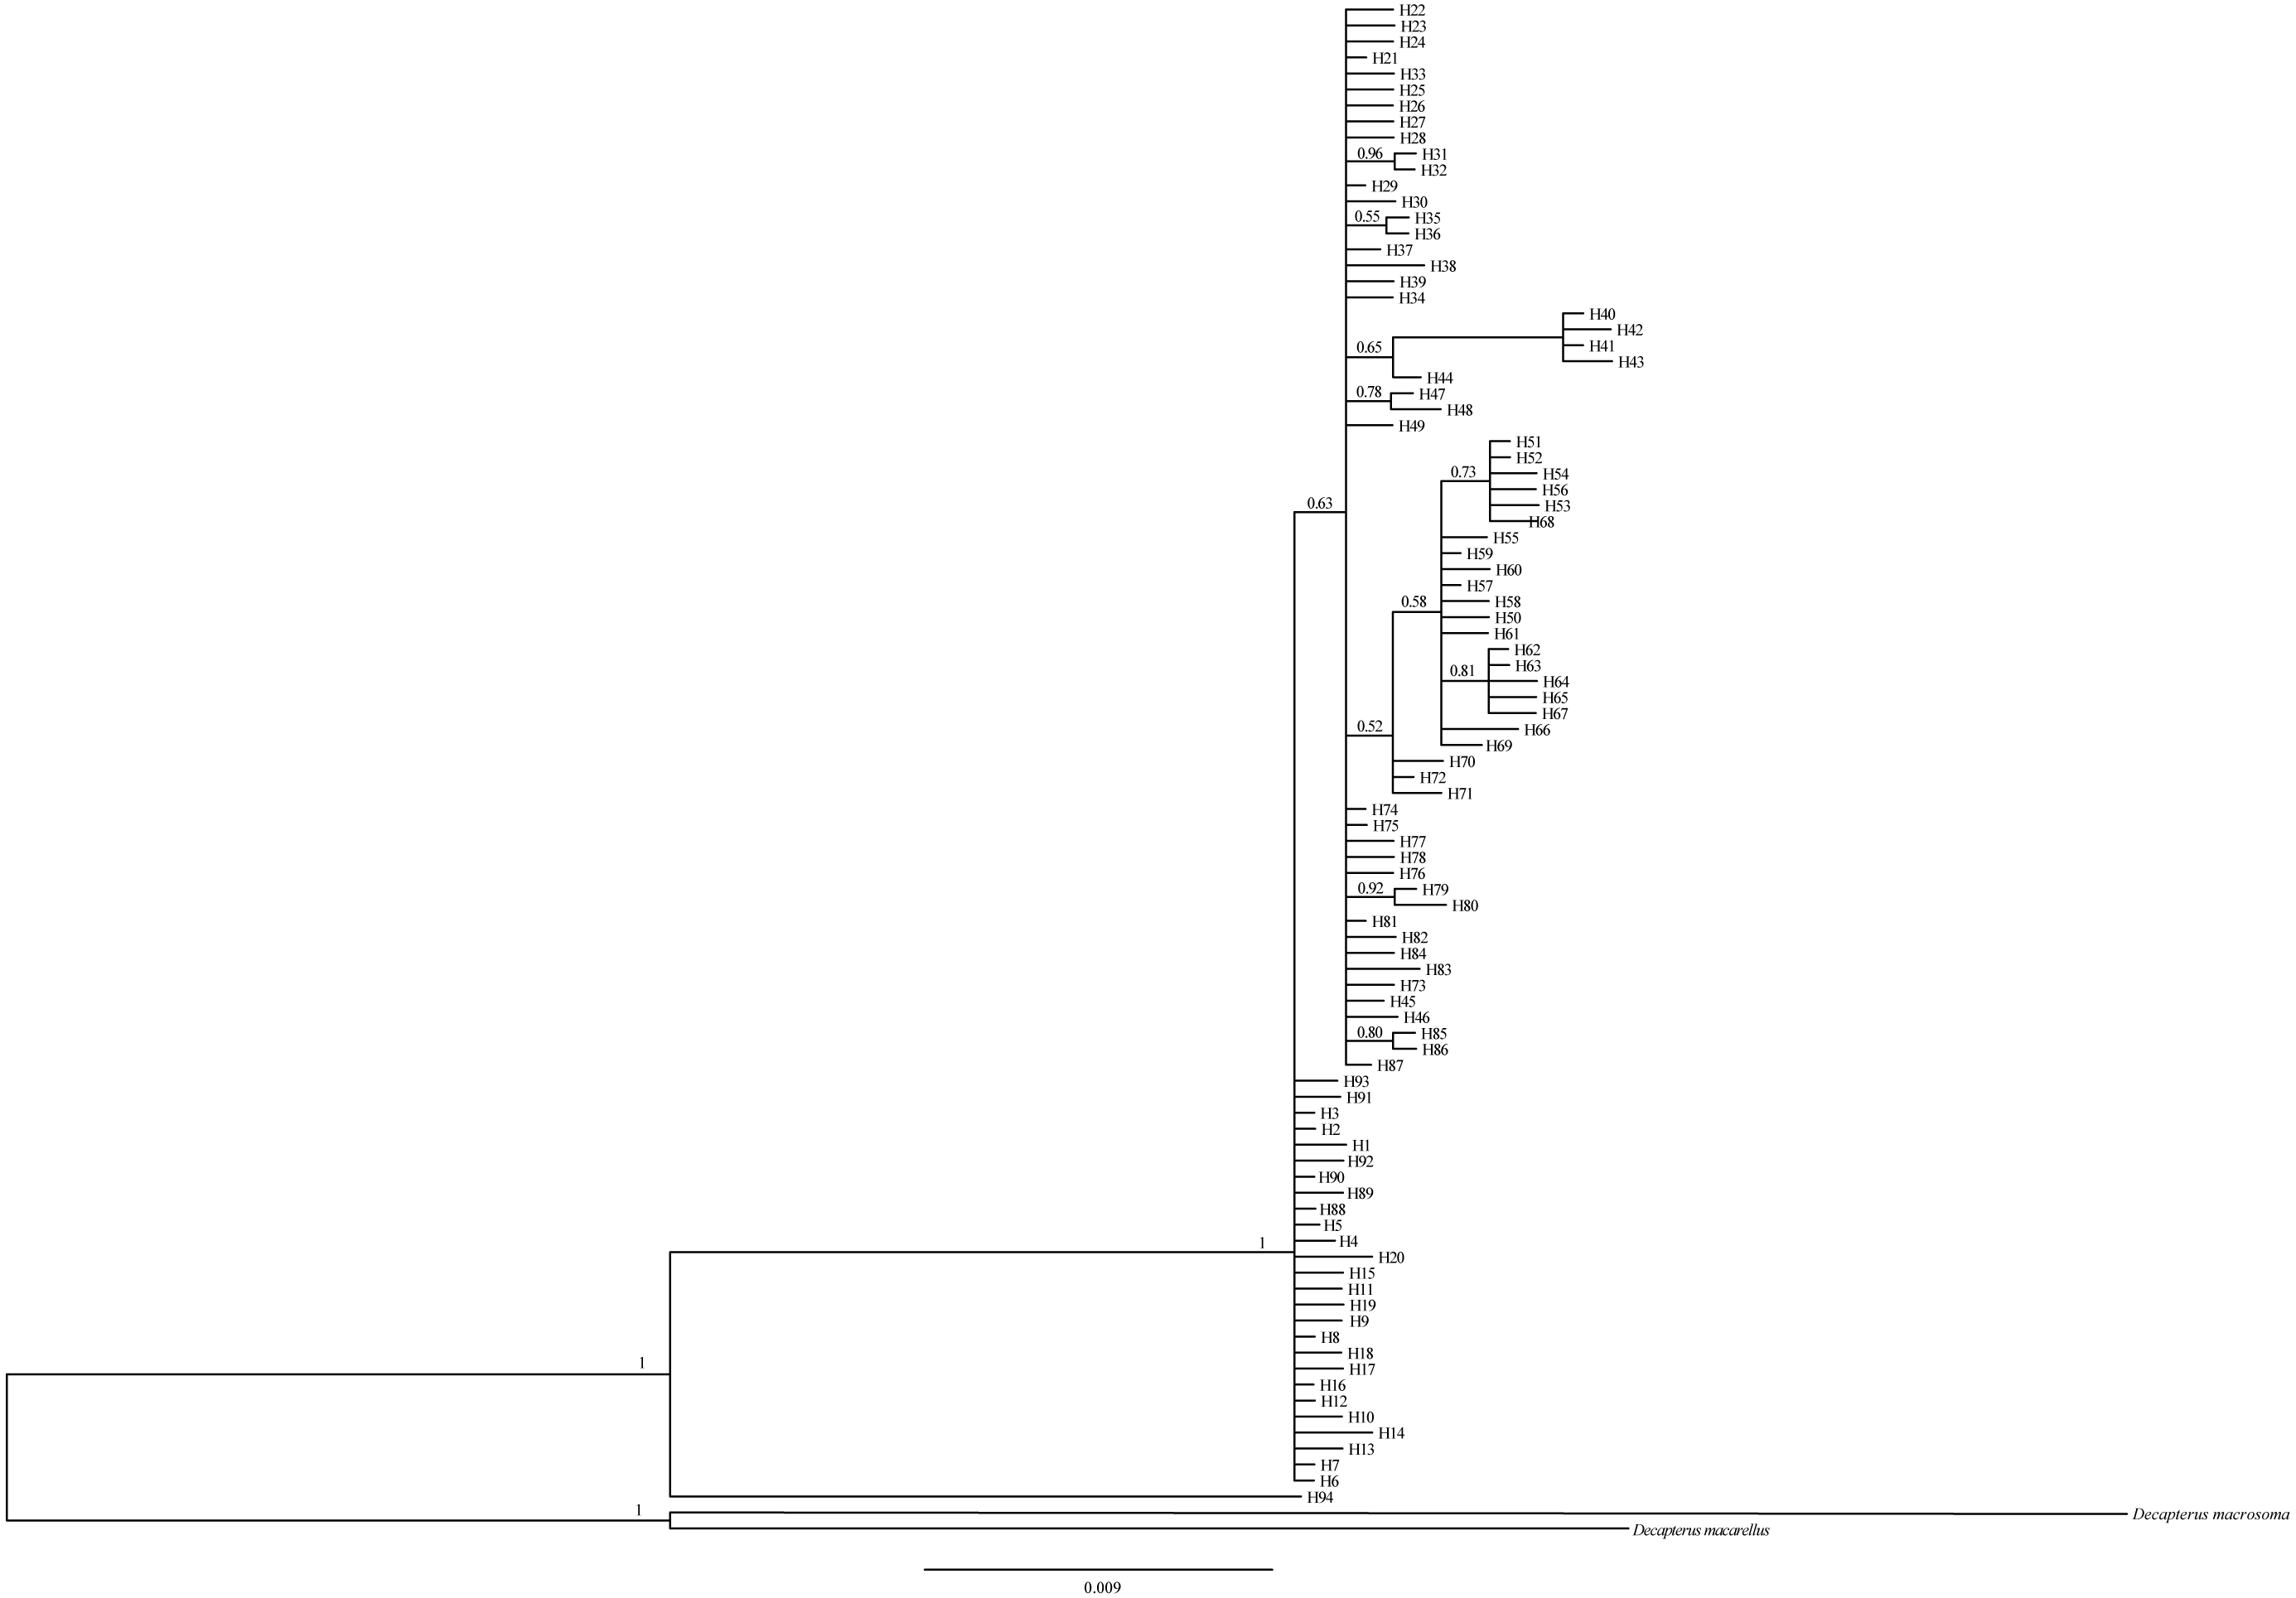
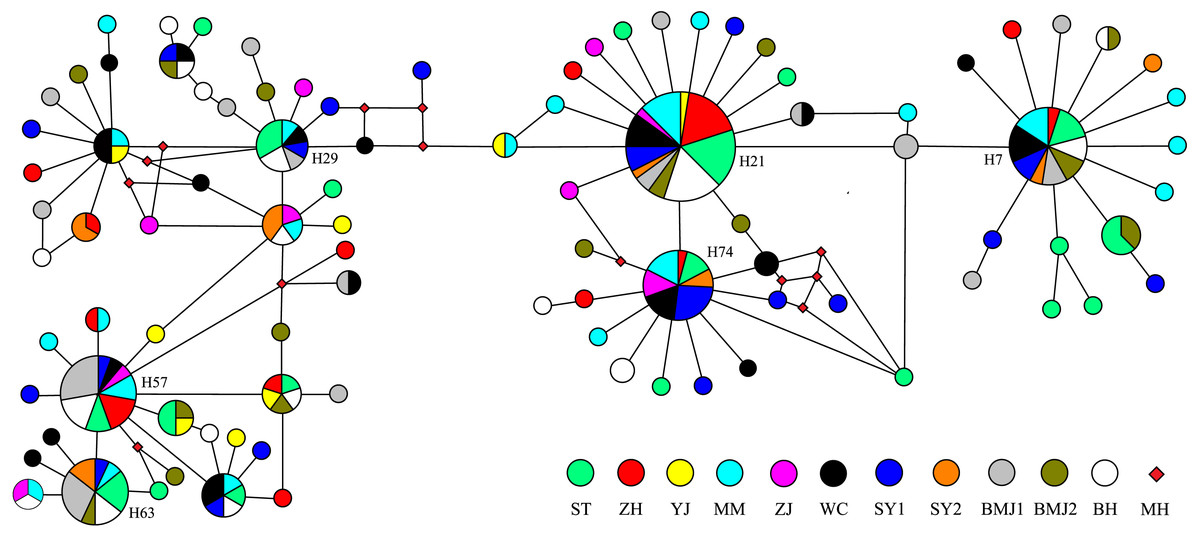
Figure 3: Median-joining network of 94 mtDNA control region haplotypes in D. maruadsi.
Circles size is proportional to haplotype frequency. MH, Missing haplotypes.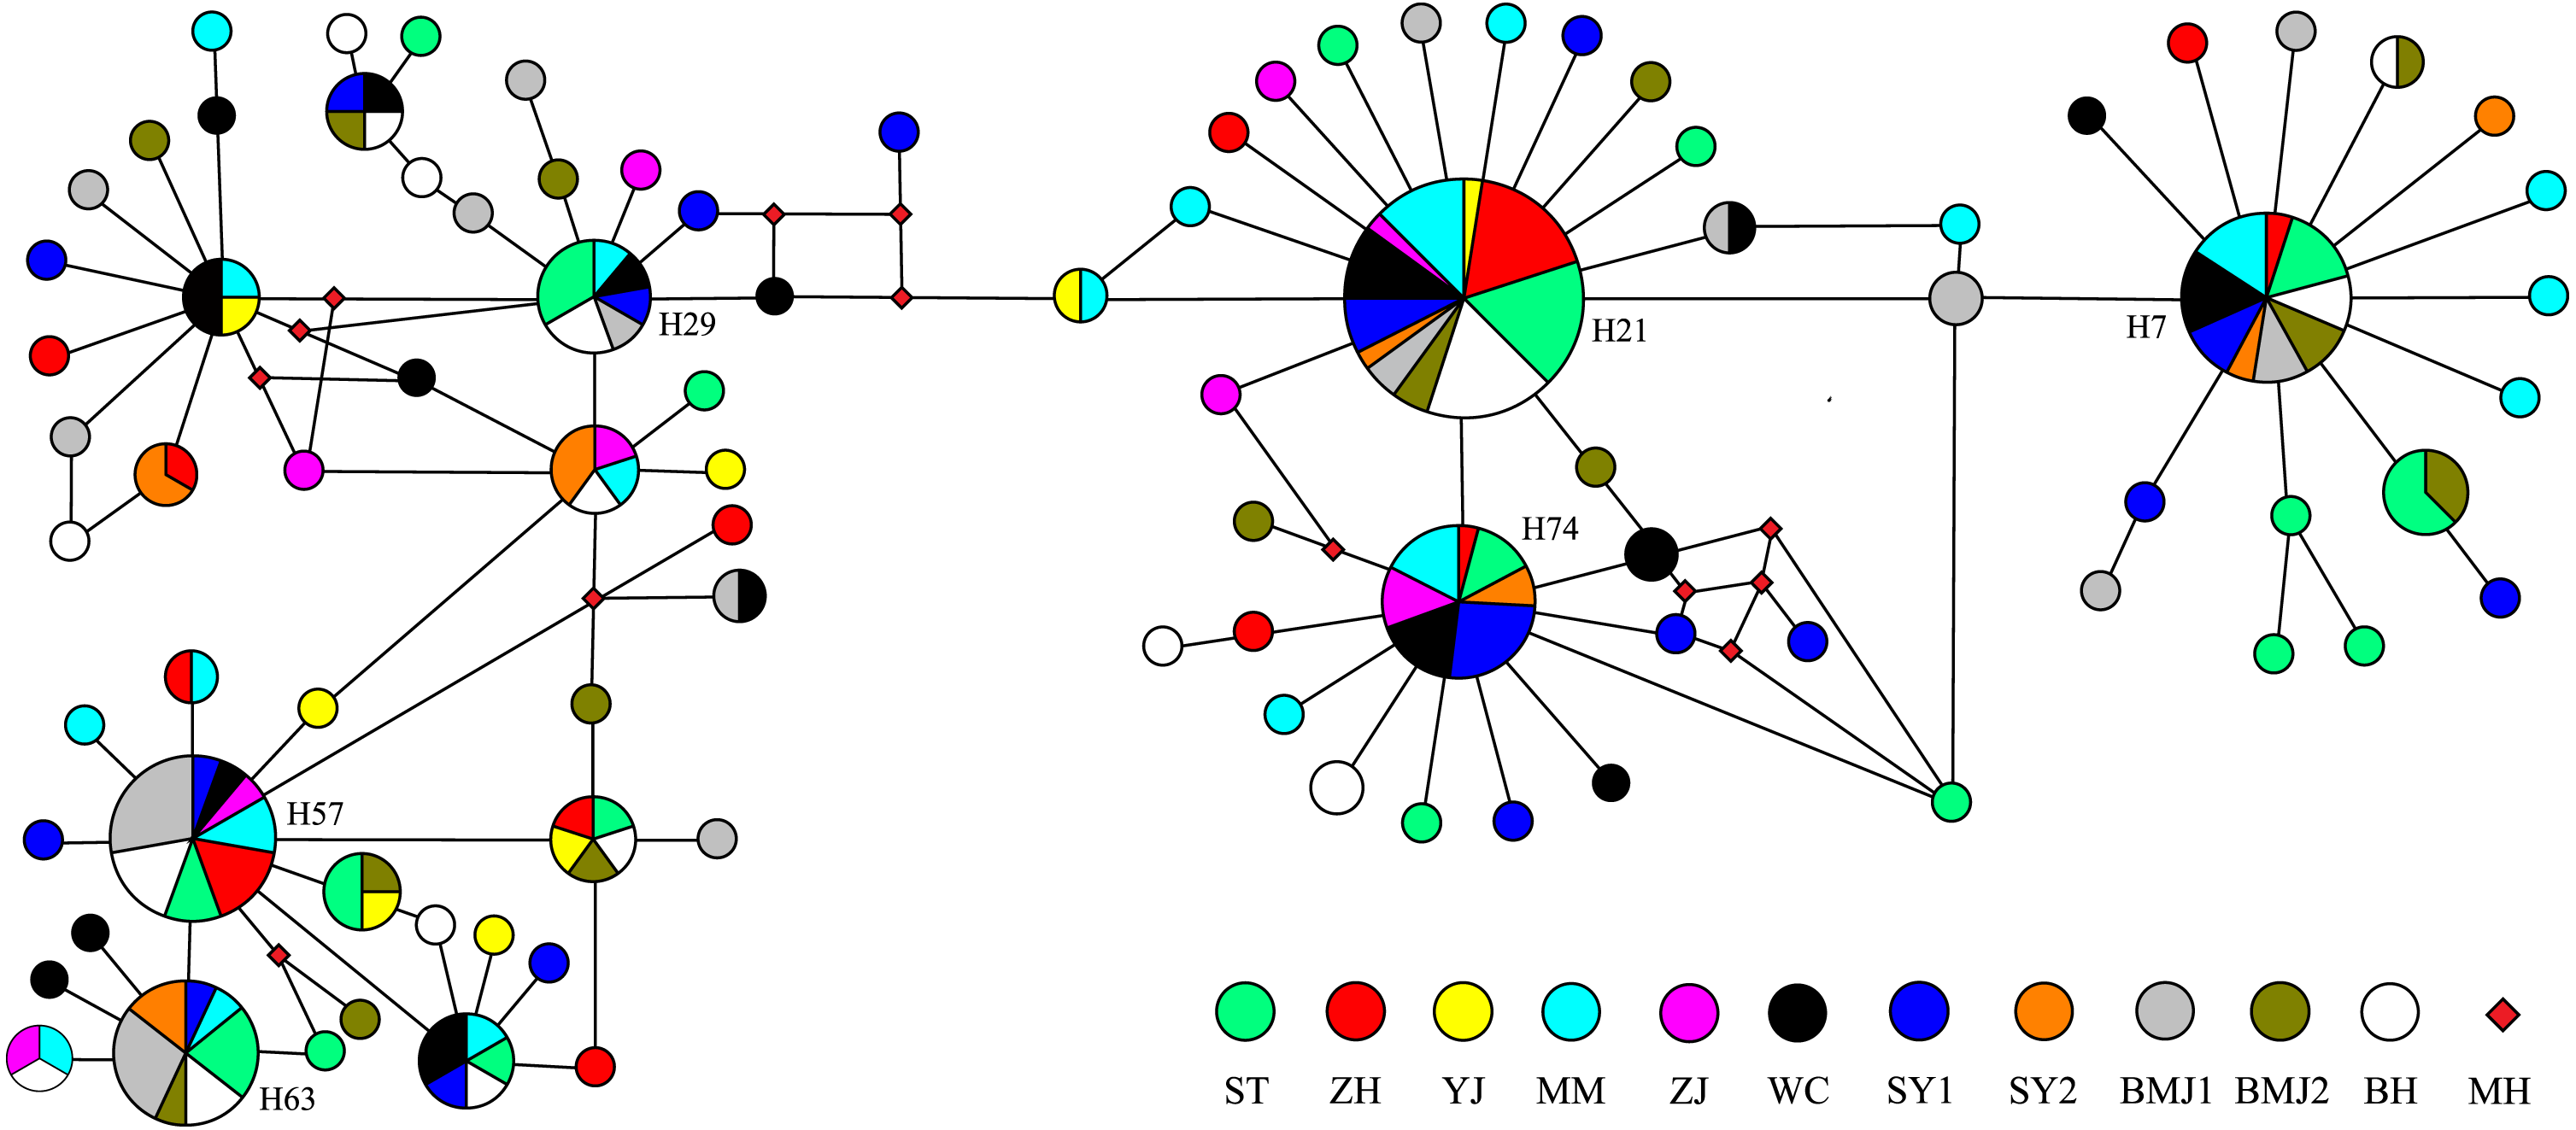
Genetic structure
Pairwise FST values between populations ranged from −0.053 (between YJ and BMJ2) to 0.058 (between ZJ and SY2) and were statistically non-significant (Table 3). Hierarchical AMOVA results (Table 4) revealed most of the genetic variations (>99%) were attributable to the variations among individuals within populations and only a small amount of the genetic variations (<1%) were explained by variations among geographical groups and among populations within groups. The FCT, FST, and FSC values of hierarchical AMOVA analysis were all low and not statistically significant. The results demonstrated that no significant genetic differentiation existed among populations. The finding could be further supported by the results of the exact tests among the population which revealed no significance (exact P value = 0.0986 ± 0.0517).
| Populations | ST | ZH | YJ | MM | ZJ | WC | SY1 | SY2 | BMJ1 | BMJ2 | BH |
|---|---|---|---|---|---|---|---|---|---|---|---|
| ST | 0.703 | 0.909 | 0.941 | 0.377 | 0.910 | 0.510 | 0.626 | 0.617 | 0.976 | 0.454 | |
| ZH | −0.016 | 0.863 | 0.661 | 0.667 | 0.627 | 0.680 | 0.258 | 0.596 | 0.503 | 0.607 | |
| YJ | −0.041 | −0.044 | 0.809 | 0.627 | 0.904 | 0.929 | 0.467 | 0.898 | 0.969 | 0.795 | |
| MM | −0.019 | −0.016 | −0.037 | 0.356 | 0.996 | 0.507 | 0.475 | 0.505 | 0.912 | 0.226 | |
| ZJ | −0.000 | −0.026 | −0.023 | 0.003 | 0.530 | 0.766 | 0.160 | 0.199 | 0.271 | 0.615 | |
| WC | −0.019 | −0.013 | −0.040 | −0.026 | −0.010 | 0.877 | 0.585 | 0.367 | 0.951 | 0.393 | |
| SY1 | −0.004 | −0.010 | −0.041 | −0.004 | −0.030 | −0.014 | 0.498 | 0.263 | 0.840 | 0.596 | |
| SY2 | −0.020 | 0.020 | −0.021 | −0.011 | 0.058 | −0.017 | −0.010 | 0.381 | 0.701 | 0.203 | |
| BMJ1 | −0.011 | −0.015 | −0.044 | −0.008 | 0.028 | −0.023 | 0.006 | −0.002 | 0.768 | 0.305 | |
| BMJ2 | −0.029 | −0.010 | −0.053 | −0.026 | 0.015 | −0.030 | −0.017 | −0.030 | −0.023 | 0.575 | |
| BH | −0.003 | −0.012 | −0.033 | 0.012 | −0.019 | 0.000 | −0.007 | 0.026 | 0.006 | −0.011 |
| d.f. | Sum of squares | Variance components | Percentage of variation | Fixation indices | Significance tests | |
|---|---|---|---|---|---|---|
| Groups: Leizhou Peninsula and Hainan Island (ST, ZH, YJ, MM, ZJ, WC, SY1, SY2) (BMJ1, BMJ2, BH) | ||||||
| Among groups | 1 | 1.917 | 0.007 Va | 0.37 | FCT = 0.004 | p = 0.156 ± 0.004 |
| Among populations within groups | 9 | 11.968 | −0.025 Vb | −1.37 | FSC = − 0.014 | p = 0.946 ± 0.002 |
| Within populations | 230 | 428.983 | 1.865 Vc | 101 | FST = − 0.010 | p = 0.933 ± 0.002 |
| Groups: Pearl River, Qiongzhou Strait, Leizhou Peninsula (ST) (ZH, YJ, MM, ZJ)(WC, SY1, SY2)(BMJ1, BMJ2, BH) | ||||||
| Among groups | 3 | 4.287 | 0.004 Va | 0.24 | FCT = 0.002 | p = 0.304 ± 0.005 |
| Among populations within groups | 7 | 9.598 | −0.026 Vb | −1.4 | FSC = − 0.014 | p = 0.8820 ± 0.003 |
| Within populations | 230 | 428.983 | 1.865 Vc | 101.16 | FST = − 0.012 | p = 0.934 ± 0.002 |
| Groups: no genetic barriers (ST, ZH, YJ, MM, ZJ, WC, SY1, SY2, BMJ1, BMJ2, BH) | ||||||
| Among populations | 10 | 13.682 | −0.022 Va | −1.2 | ||
| Within populations | 230 | 422.279 | 1.836 Vb | 101.20 | FST = − 0.012 | p = 0.933 ± 0.003 |
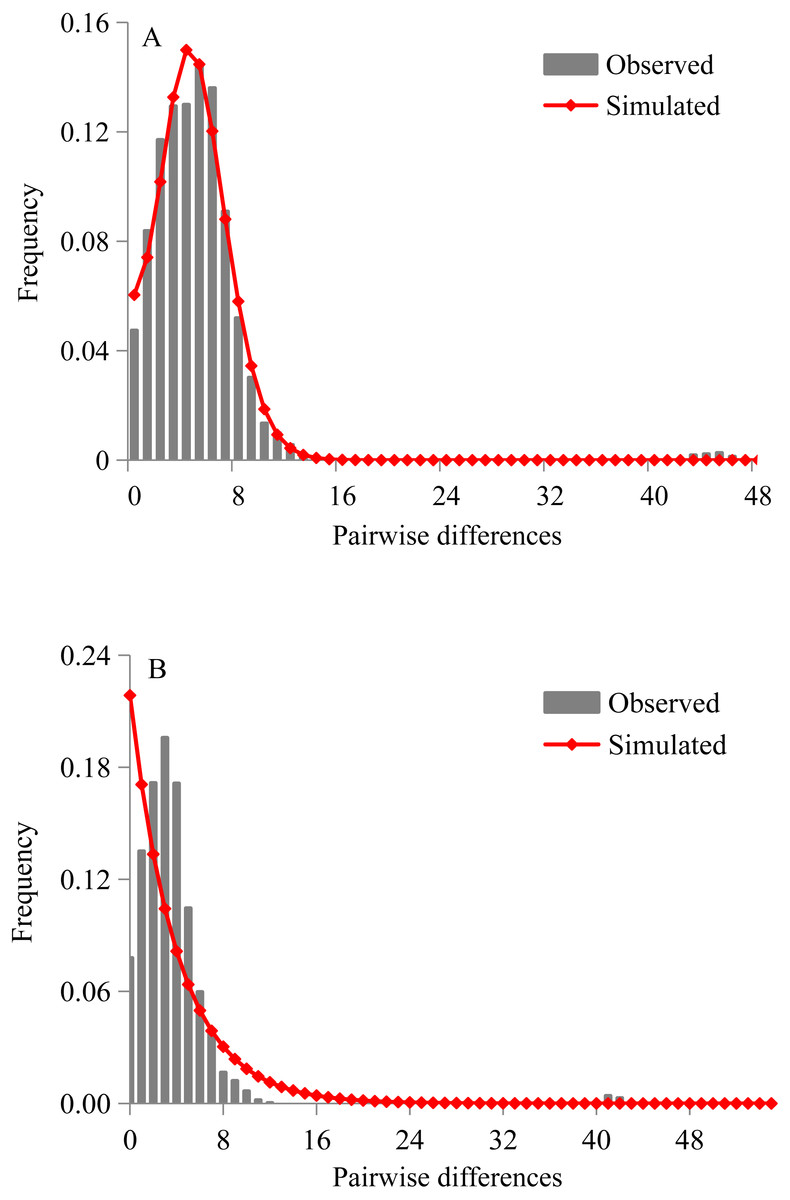
Figure 4: Mismatch distribution analyses of D. maruadsi for mtDNA control region.
(A) Sudden expansion model. (B) Constant population size model.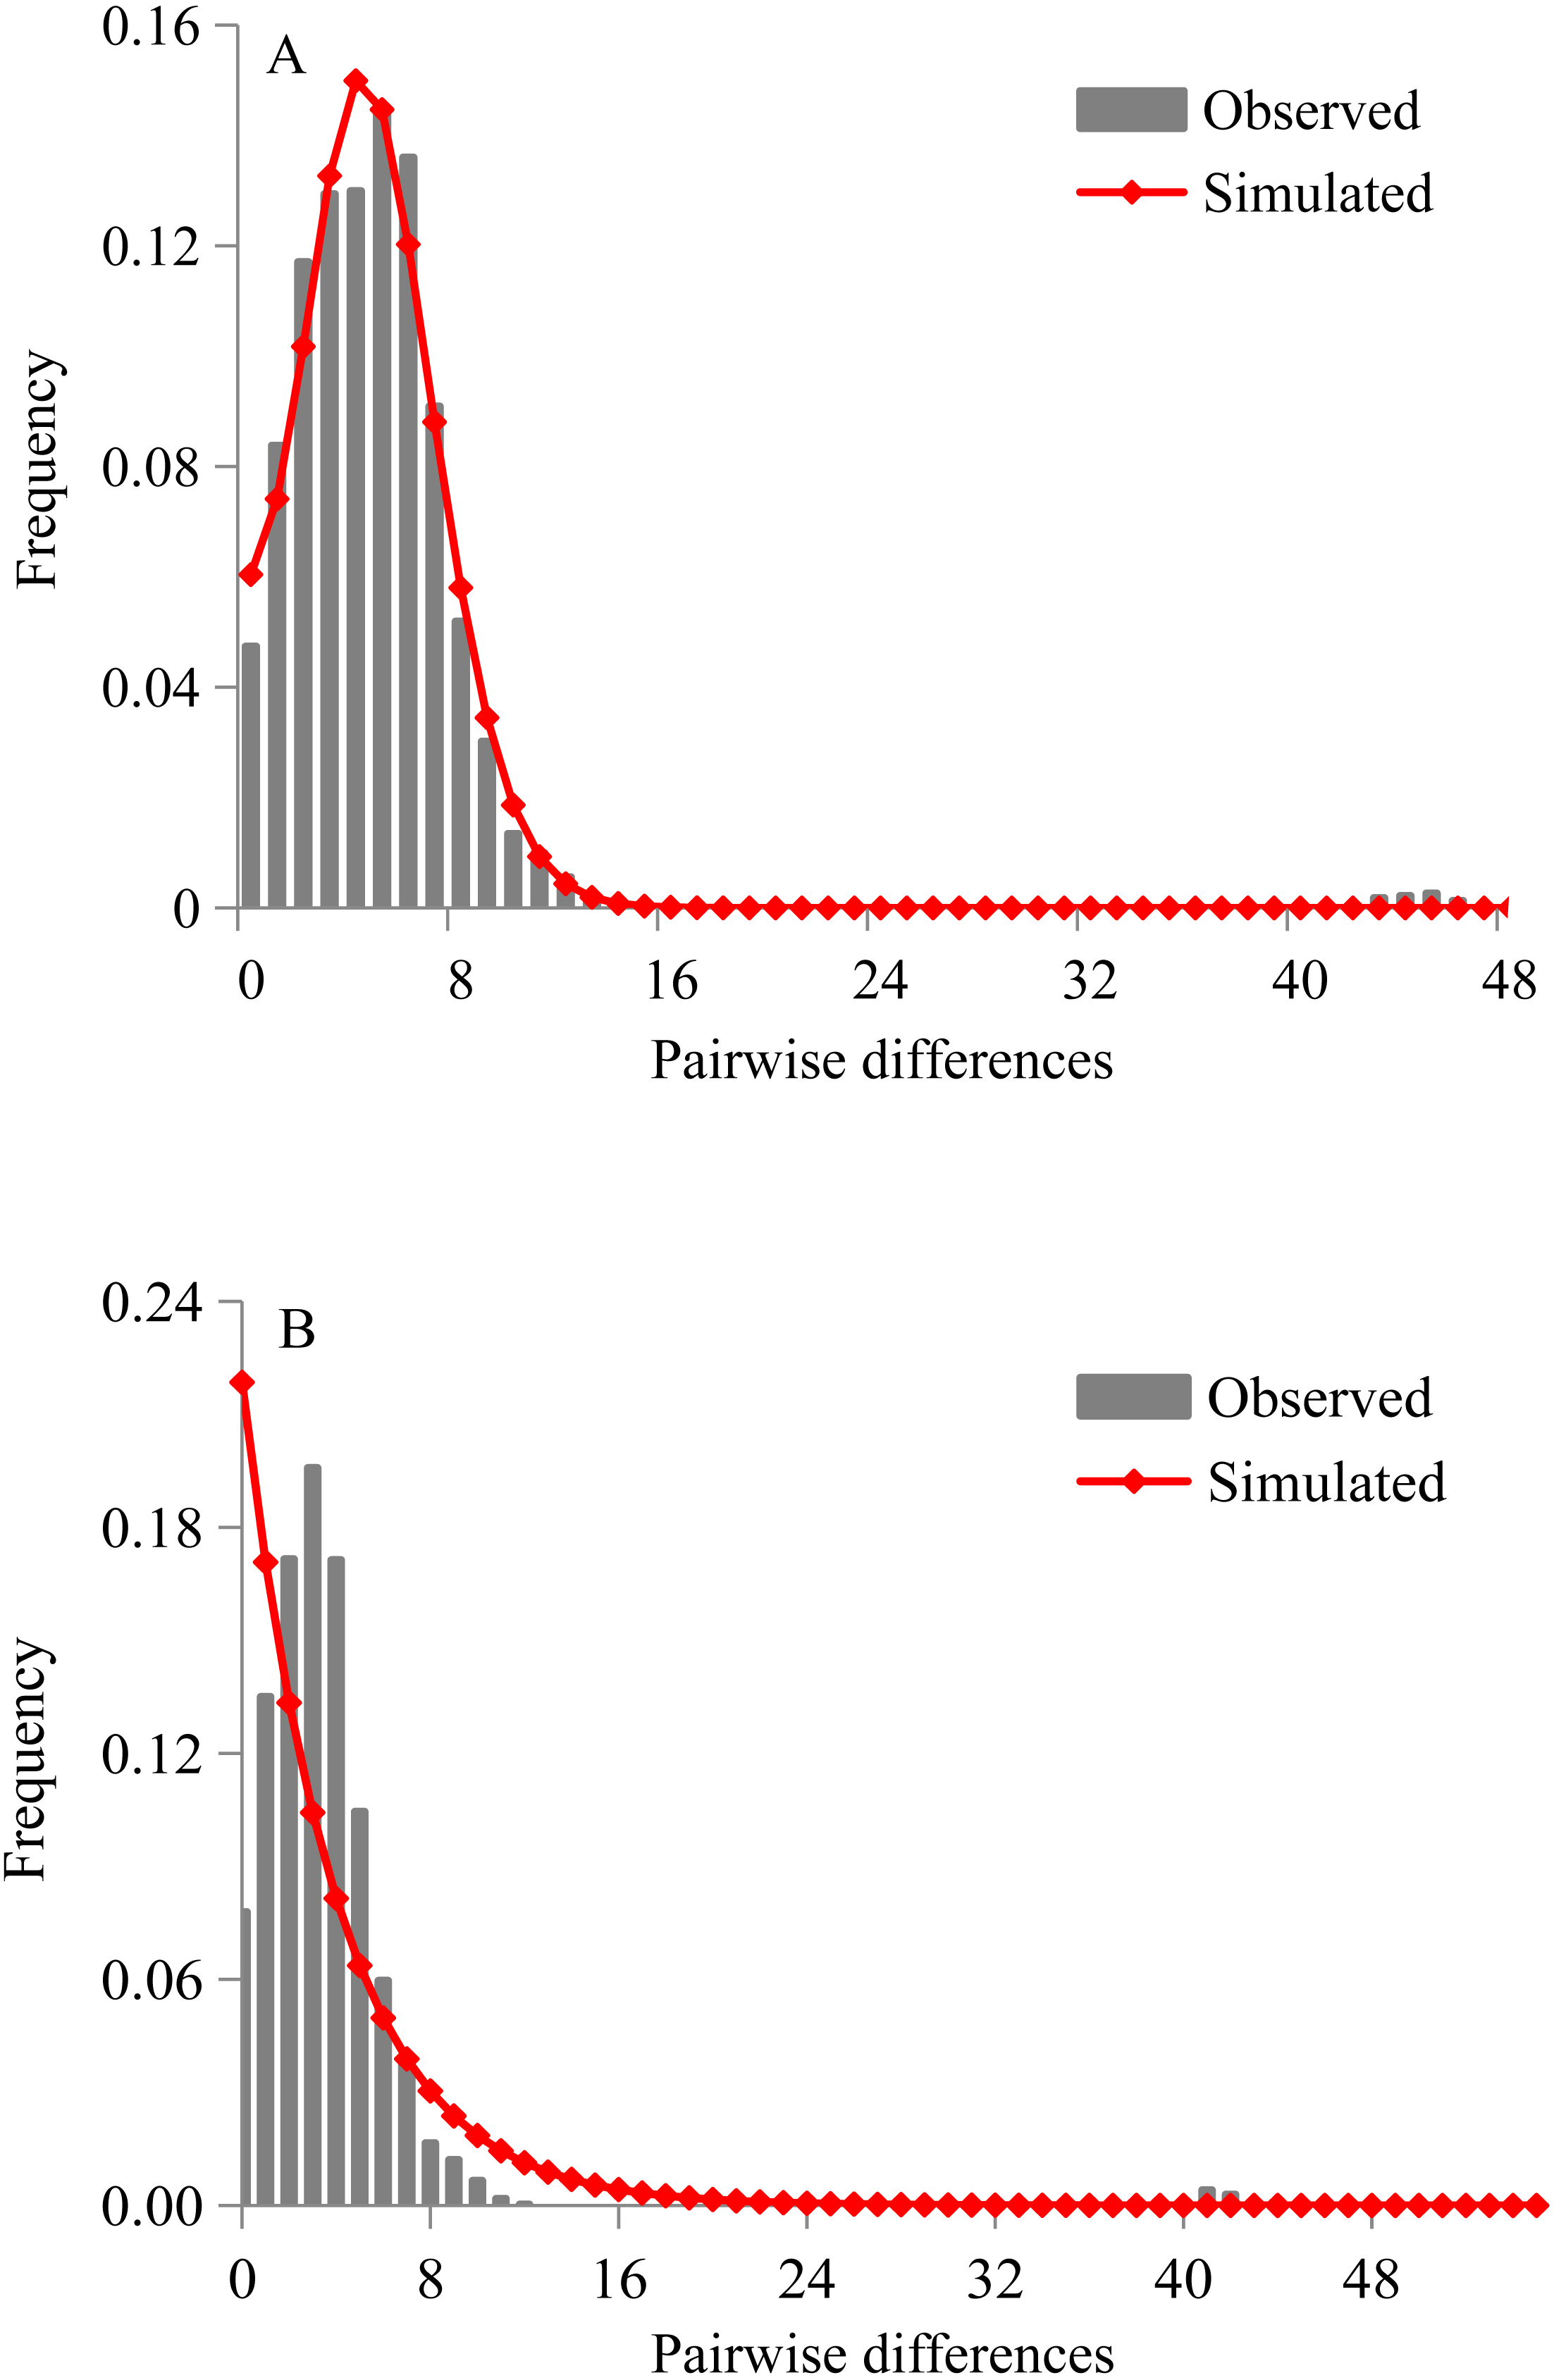
Demographic history
Both Tajima’s D statistics (Tajima’s D = − 2.201, p = 0.0005) and Fu’s Fs test (Fu Fs = −25.180, p = 0.0002) were negative and highly significant in pooled samples. The mismatch distributions of D. maruadsi for all populations pooled together showed a unimodal pattern under the sudden expansion model (Fig. 4A) and constant population size model (Fig. 4B). Under the sudden expansion model, the observed distributions were included in the 90%, 95%, and 99% confidence intervals obtained by simulated distribution. The SSD values (SSD = 0.001, p = 0.840) and Hri (Hri = 0.007, p = 0.936) were small and statistically non-significant, which showed no significant deviation between the observed distributions and expected distributions. Under the constant population size model, a poor goodness-of-fit was found between the observed and expected distributions. Both the neutrality test and mismatch distribution analyses suggested a recent population demographic expansion for D. maruadsi populations in the northern SCS. However, a low migrants per generation (M < 50) was detected under the spatial expansion model. This may lead to a larger variance of mismatch distribution and incorrectly estimating the parameters for spatial expansion (Ray, Currat & Excoffier, 2003; Excoffier, 2004). Therefore, the spatial expansion model was not chosen to analyze the range expansion history of D. maruadsi.
Bayesian skyline plot (Fig. 5) revealed a pattern of glacial decline and postglacial growth in the effective population size based on the mutation rate of 3.75% per myr. The population decline happened about 18,000–37,000 years before present (YBP) that coincided with the LGM. Following the LGM and continuing to the present (0–18,000 YBP), D. maruadsi has undergone a rapid episode of population growth, which resulted in an about 100-fold increase in the maximum effective population size. The results suggested that D. maruadsi in the northern SCS experienced demographic expansion after the LGM. Use of the 3–10 ×faster mutation rates shortened the timing of population expansion and the calibrated time was 1,800–6,000 YBP, which further confirmed that D. maruadsi in the northern SCS experienced a recent population expansion during the Holocene.
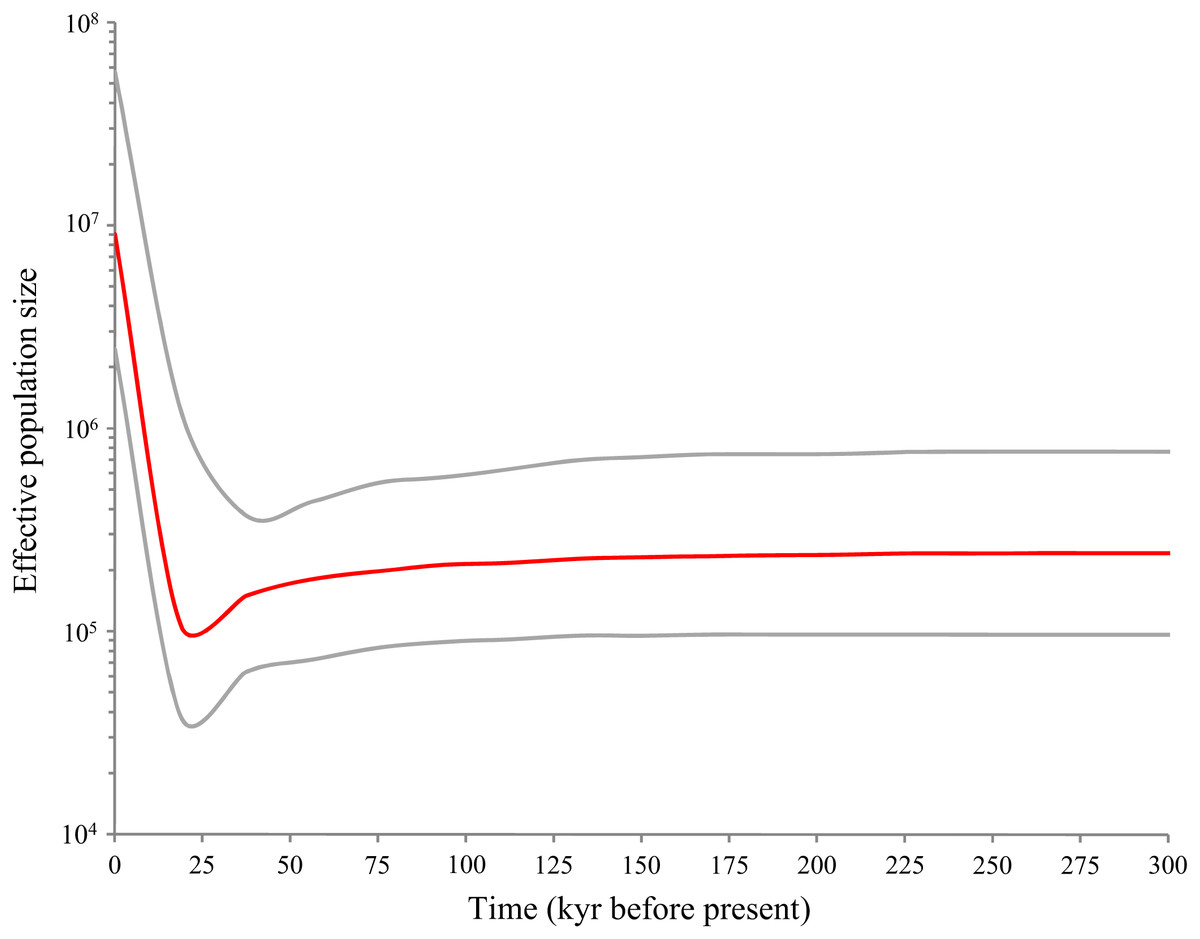
Figure 5: Bayesian skyline plots (BSP) based on mtDNA control region of D. maruadsi from the northern South China Sea.
The figure shows effective population size (Ne) changes of D. maruadsi through time. Intermediate red line represents the median estimate of Ne. The gray lines show upper and lower 95% highest posterior density (HPD) limits of Ne.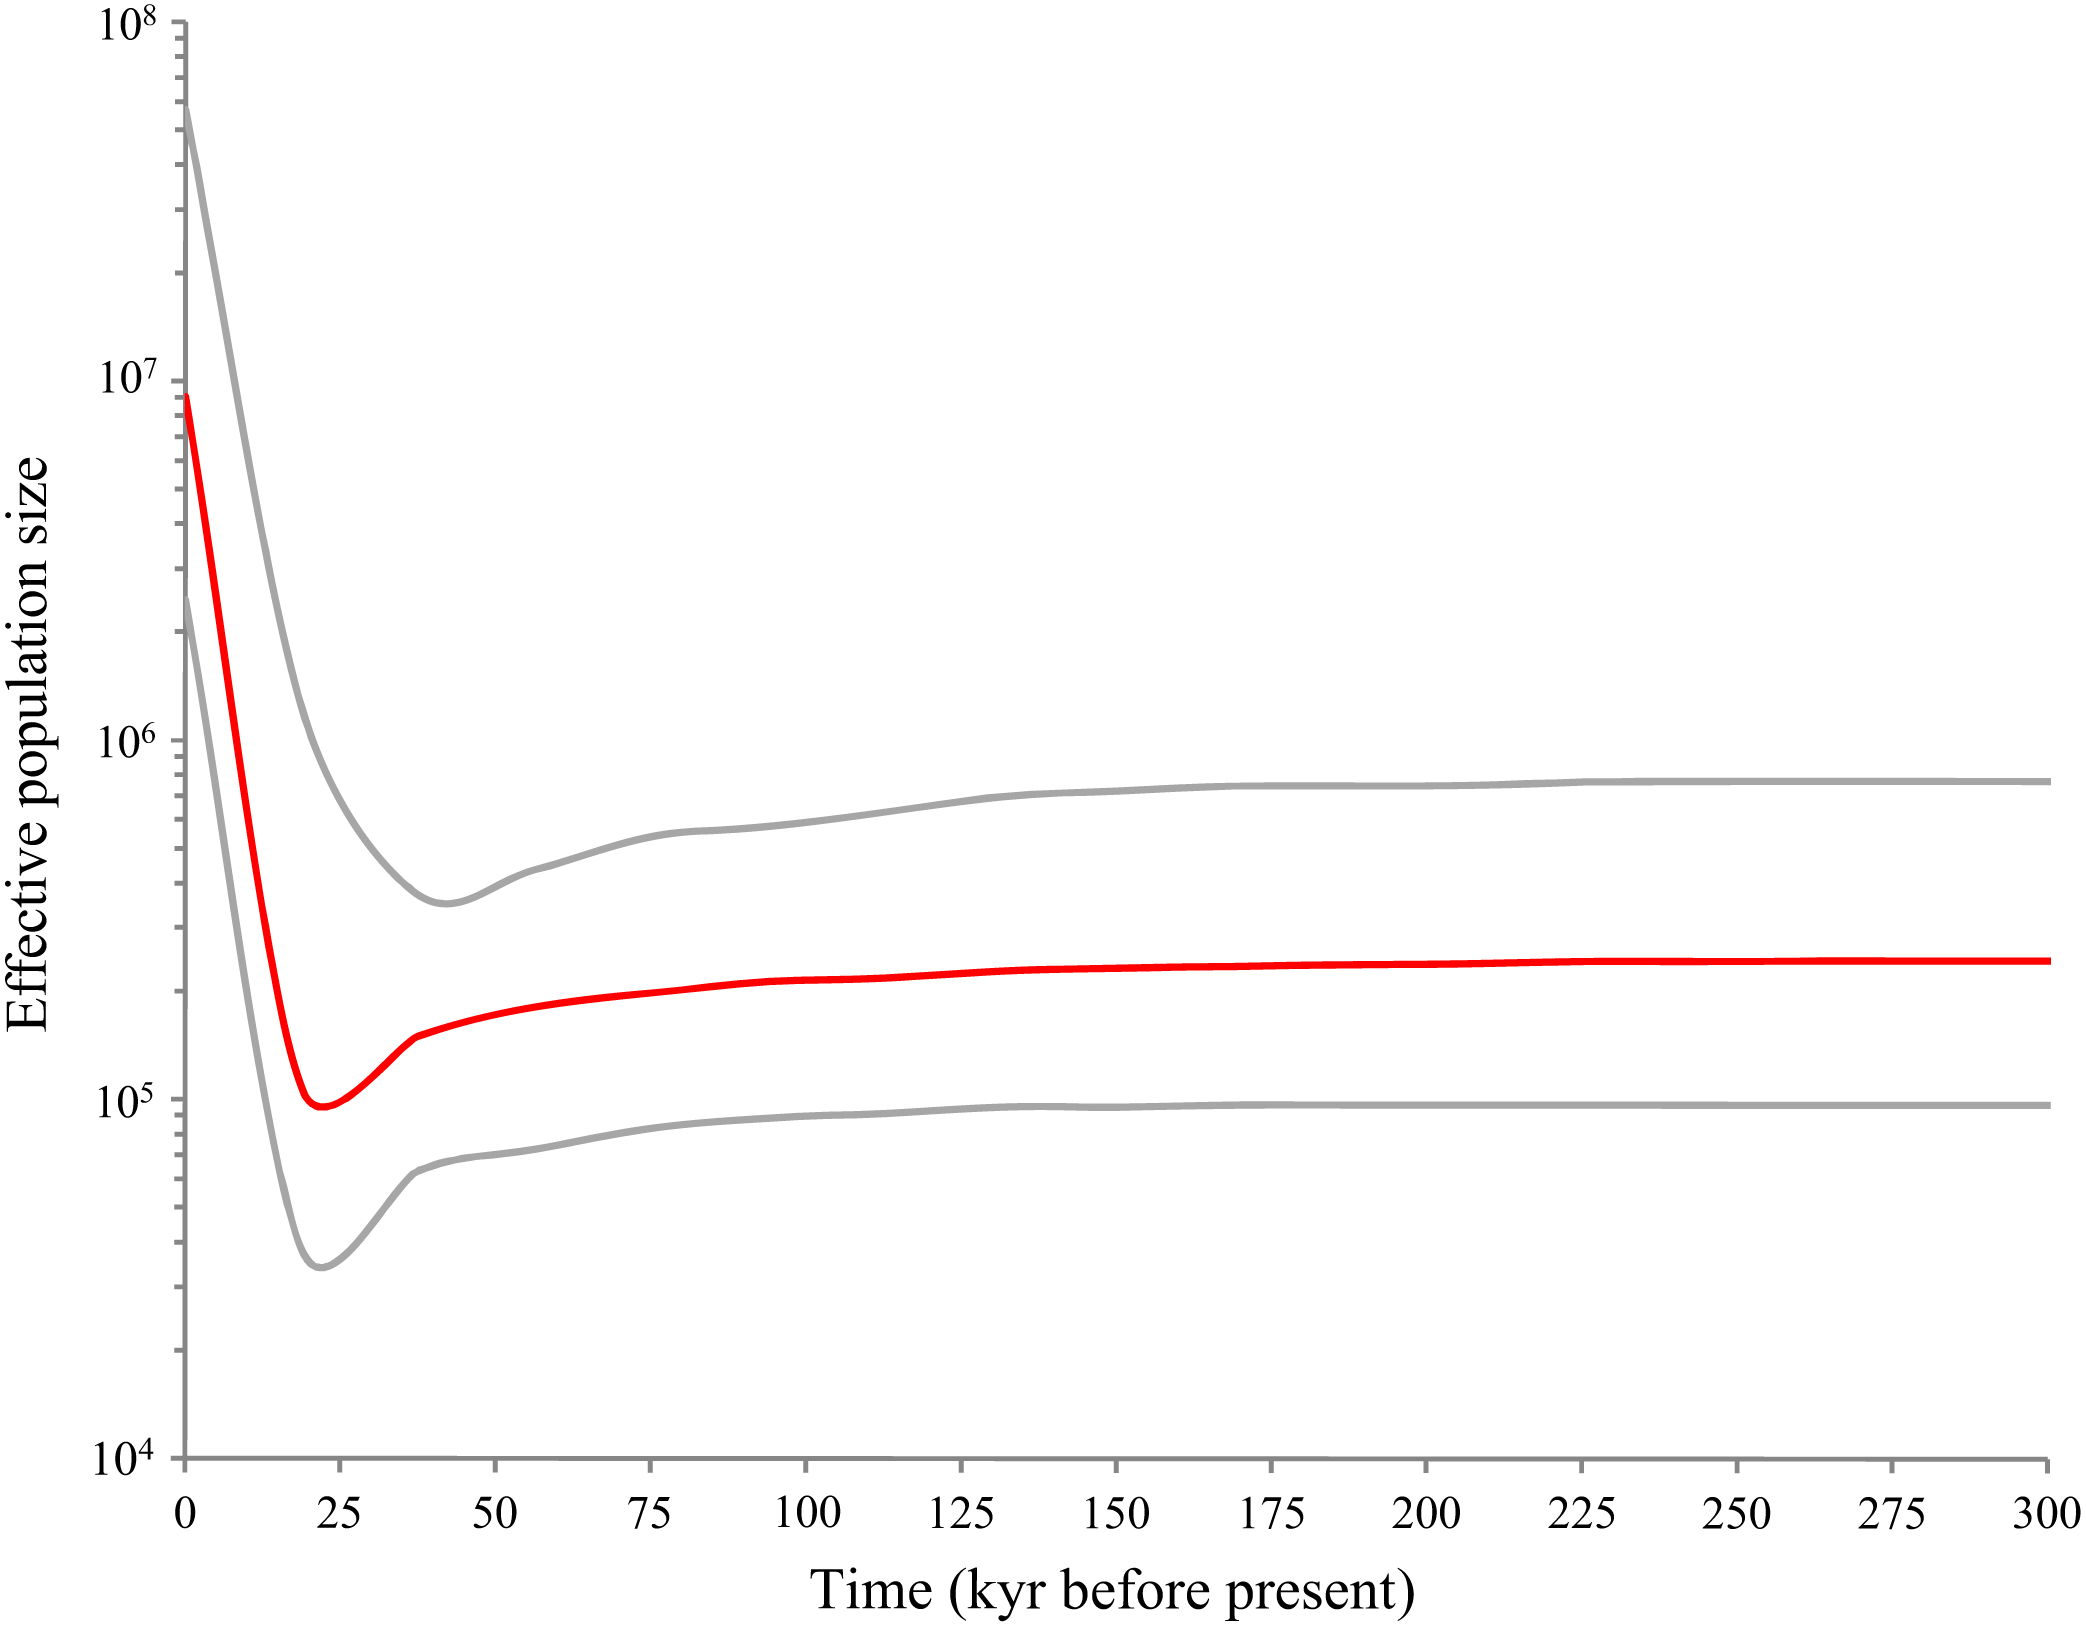
Artificial statistical bias adjacent geographical populations
To detect artificial statistical bias due to a low sample size from YJ, ZJ, and SY2 populations, some adjacent geographical populations were combined into three geographic groups for genetic differentiation analysis, including the western Guangdong group (WGD: ZH, YJ, MM, ZJ), Sanya group (SY: SY1, SY2), and Baimajing group (BMJ: BMJ1, BMJ2). Genetic homogeneity was demonstrated by AMOVA (Table 5), pairwise FST (FST = − 0.0189–0.00674, P = 0.235 − 0.992), and exact tests (exact P value = 0.178 ± 0.0758) among three geographic groups and the other three populations (ST, WC, BH). This indicated that low sample sizes for YJ, ZJ, and SY2 have not influenced the results of this study.
| d.f. | Sum of squares | Variance components | Percentage of variation | Fixation indices | Significance tests | |
|---|---|---|---|---|---|---|
| Groups: Leizhou Peninsula and Hainan Island (ST, WGD, WC, SY) (BMJ, BH) | ||||||
| Among groups | 1 | 1.938 | 0.00562 Va | 0.30 | FCT = 0.003 | p = 0.198 ± 0.004 |
| Among populations within groups | 4 | 5.598 | −0.0117 Vb | −0.63 | FSC = − 0.006 | p = 0.805 ± 0.004 |
| Within populations | 235 | 435.334 | 1.852 Vc | 100.33 | FST = − 0.003 | p = 0.755 ± 0.004 |
| Groups: Pearl River, Qiongzhou Strait, Leizhou Peninsula (ST) (WGD)(WC, SY)(BMJ, BH) | ||||||
| Among groups | 3 | 4.307 | −0.002 Va | −0.09 | FCT = − 0.001 | p = 0.619 ± 0.005 |
| Among populations within groups | 2 | 3.228 | −0.007 Vb | −0.40 | FSC = − 0.004 | p = 0.725 ± 0.004 |
| Within populations | 235 | 435.334 | 1.852 Vc | 100.49 | FST = − 0.005 | p = 0.759 ± 0.005 |
| Groups: no genetic barriers (ST, WGD, WC, SY, BMJ, BH) | ||||||
| Among populations | 5 | 7.535 | −0.00883 Va | −0.48 | ||
| Within populations | 235 | 435.334 | 1.852 Vb | 100.48 | FST = − 0.00479 | p = 0.752 ± 0.004 |
Discussion
Demographic history
This study revealed D. maruadsi in the northern SCS experienced a rapid demographic expansion after a period of low effective population size during the Holocene. The results suggested better conditions (e.g., the enlargement of habitat and the significant increase of paleo-productivity) after the LGM driving the population expansion of D. maruadsi.
During the LGM, the sea-level dropped 100–120 m in the South China Sea (Wang & Sun, 1994). The dropping of the sea-level exposed shallow coastal continental shelves and turned the SCS into a semi-closed land-locked sea (about one-fifth smaller than it is now) (Wang & Sun, 1994; Wang, 1999), greatly reducing the habitat and population abundance of many marine fishes in the continental shelf (He et al., 2015; Zhu, Cheng & Rogers, 2016). D. maruadsi widely distributes in the northern shallow continental shelf of the SCS within 180 m and its spawning grounds are located mainly in shallow nearshore waters less than 120 m (Deng & Zhao, 1991). With the falling sea-level during the LGM, most of its spawning grounds were exposed and gradually moved from shallow-water to the deeper water. Thus, D. maruadsi should have undergone intensive spawning ground loss and change, which may have caused a decrease in the effective population size, abundance, and distribution. The surviving D. maruadsi had to contract into the potential glacial refugia (semi-closed SCS). However, the subsequent rising sea-level of the postglacial-Holocene provided new niche space for D. maruadsi, leading to sustained and rapid growth in the effective population size of this species. Similar patterns of population dynamics have been revealed for some marine fishes in response to the postglacial rising sea-level in the northern SCS (Liu et al., 2006; Xiao et al., 2014; Gao et al., 2018).
The paleo-productivity of the northern SCS was mainly influenced by the fluctuant East Asian monsoon and Kuroshio Current (Wang, 1999; Yu & Qiu, 2016). After the LGM, the East Asian summer monsoon gradually strengthened, which caused high precipitation and increased land-source influx into the northern SCS (Jian, Wang & Kienast, 1999). Accordingly, high levels of terrigenous nutrients from the Asian continent were transported into the northern SCS ecosystems through the Pearl River, Han River, Nanliu River, Red River, and other sources of fluvial runoff (Jian et al., 1999; Gao, 2013; Qu & Huang, 2019). Moreover, the enhanced summer monsoon could drive upwelling containing high nutrient input into the northern SCS (Jian, Wang & Kienast, 1999). Obviously, the enhanced summer monsoon during the deglaciation period increased the nutrient input of the northern SCS, which led to higher paleo-productivity than that of the LGM. During the LGM, the Kuroshio Current was forced eastward due to the formation of a land bridge between Taiwan and the Ryukyu Islands, which prohibited its flow into the SCS (Ujiié et al., 2003). By contrast, the postglacial Kuroshio Current branches into the northern SCS through the Luzon Strait along with the rise of the sea-level (Nan, Xue & Yu, 2015). The Kuroshio intrusion induces upwelling and meso- and micro-scale eddies, strengthening the vertical mixing of the water layer and nutrient supplies to the upper ocean (Yu & Qiu, 2016). Additionally, the Kuroshio intrusion could transport large amounts of nutrients into the northern SCS (Xu et al., 2018), promoting the increase of paleo-productivity in the northern SCS. The combination of the above factors strongly prove that the northern SCS had significantly higher paleo-productivity during deglaciation (> 30 gC/(m2⋅103a)) than the LGM (< 25gC/(m2⋅103a)) (Kuhnt, Hess & Jian, 1999; Zhao & Wang, 1999). The significant increase of paleo-productivity in the northern SCS after the LGM has a close correlation to the recent rapid population growth of D. maruadsi.
All in all, LGM-Holocene climate oscillations gave rise to drastic changes in the East Asian monsoon circulation, sea-level, ocean current patterns, and upwelling density of the western Pacific marginal seas (Wang, 1999; Jian, Wang & Kienast, 1999; Ujiié et al., 2003). These changes resulted in enlargement of nearshore habitat and significant increase of primary productivity, which were believed to be the main cause of the rapid demographic expansion of D. maruadsi. Similar phenomena have been reported in other fish species, such as Pampus echinogaster (Li et al., 2018) and Trichiurus japonicus (He et al., 2014). However, it is not yet possible to discriminate the relative impact of changes in habitat or paleo-productivity based on the existing mtDNA data.
Population structure
In this study, low levels of genetic diversity and high levels of genetic homogeneity were detected in the D. maruadsi population from the northern SCS. Contemporary genetic diversity and structure is influenced by demographic history (Hewitt, 1996; Hewitt, 2000). The rapid population growth after a period of low effective population size could enhance the retention of new mutations, but it might not accumulate enough nucleotide diversity in the short term (Avise, Neigel & Arnold, 1984; Rogers & Harpending, 1992). Therefore, the population decline and the subsequent rapid population expansion may lead to the loss of diversity and explain the low levels of genetic diversity in D. maruadsi in the northern SCS. The recent rapid population expansion also indicates that D. maruadsi in the northern SCS is far from equilibrium due to the lack of sufficient evolutionary time (Slatkin, 1993), which should be an important historical reason for genetic homogeneity among D. maruadsi populations. A similar genetic structure and explanation was found in E. japonicus (Liu et al., 2006) and Pennahia argentata (Han et al., 2008) along the coastal waters of China.
Several other factors aside from the historical process may have also led to the lack of significant genetic differentiation among D. maruadsi populations in the northern SCS. First, the planktonic eggs and larvae of D. maruadsi (Deng & Zhao, 1991) could disperse on ocean currents to facilitate genetic exchange over great distances. There are many annual or semi-annual ocean currents in the northern SCS. The northward currents, such as the southwest monsoon drift, South China Sea warm current, the coastal current of eastern Guangdong, and the coastal current of eastern Hainan (Qiao, 2012), are beneficial for the northward dispersal of the southern groups (e.g., SY1, ZJ, and MM populations). The southward currents, including the northeast monsoon drift, Guangdong coastal current, and the Kuroshio branch in South China Sea (Li, Zhao & Wasiliev, 2000), promote populations from the eastern Guangdong to migrate south. Furthermore, D. maruadsi pelagic larvae on both sides of Leizhou Peninsula and Hainan Island could cross the Qiongzhou Strait for genetic exchange along the residual current in the Qiongzhou Strait (Gao, 2013). The planktonic eggs and larvae of D. maruadsi may travel great distances on ocean currents in the northern SCS, which may be sufficient to produce genetic homogeneity. Secondly, adult D. maruadsi from the northern SCS spawn throughout the year, and the spawning ground spreads from the Taiwan shoal to Beibu Gulf (Deng & Zhao, 1991). The overlapping spawning time and spawning ground could maintain genetic connectivity amid geographic separation.
The lack of significant genetic structure implies that D. maruadsi in the northern SCS should be considered a single panmictic population. However, some significant biological differences are found among the different populations of D. maruadsi in the northern SCS. The average fork length and body weight of D. maruadsi in Beibu Gulf and its mouth are 145 mm (dominant fork length = 110–160 mm) and 42 g (dominant body weight = 20–60 g), respectively; while those in the eastern Hainan Island are 158.7 mm (dominant fork length = 130–220 mm) and 102.5 g (dominant body weight = 70–140 g), respectively (Jia, Li & Qiu, 2005). Additionally, different peak spawning periods are found among the various geographical populations of D. maruadsi in the northern SCS (Deng & Zhao, 1991). For example, the peak spawning season for the Beibu Gulf population is from January to March, from May to June for the population from southeast Hainan Island, and from February to April for the populations from the Pearl River estuary to east Guangdong (Jia, Li & Qiu, 2005). The potential mismatch between the population’s genetic structure (genetic homogeneity) and biological characteristics (significant difference) reminds us to identify and manage D. maruadsi populations carefully. However, owing to maternal inheritance, the mtDNA control region sequence provides no information about male migration and has some limitations in respect of fishery management (Waples, Punt & Cope, 2008). Thus, future integrative studies based on nuclear markers with biparental inheritance (such as microsatellites and SNPs), and biological and ecological characteristics are needed for more accurate identification of the population structure and MUs of D. maruadsi in the northern SCS.
Conclusions
The present study reveals that LGM-Holocene climate oscillations had an important impact on the demographic history, genetic structure, and genetic diversity of D. maruadsi in the northern SCS. LGM-Holocene climate change gave rise to drastic changes in the habitat and paleo-productivity, which resulted in the recent rapid population expansion. The demographic history is considered to be responsible for the low levels of genetic diversity for D. maruadsi in the northern SCS. The low genetic diversity suggests that the environmental adaptive capacity and evolutionary potential of D. maruadsi may decline from a long-term evolutionary perspective. This reminds us to strengthen fishery resource management and protection in order to sustain the productivity of D. maruadsi in the northern SCS. Moreover, no significant genetic differentiation was detected among the D. maruadsi populations, which has a close correlation to recent rapid population expansion, the dispersion of planktonic eggs and larvae on ocean currents, and overlapping spawning time and spawning grounds. However, owing to the potential mismatch between the population’s genetic structure and biological characteristics and some accuracy limitations of mtDNA to the appropriate identification of the population structure and MUs, the lack of significant genetic structure does not mean that D. maruadsi in the northern SCS should be managed as a single unit.