
Association between genetic polymorphisms of the IL28B gene and leukomonocyte in Chinese hepatitis B virus-infected individuals
- Published
- Accepted
- Received
- Academic Editor
- Antonio Amorim
- Subject Areas
- Genetics, Infectious Diseases
- Keywords
- HBV infection, IL28B, Genetic polymorphism, Leukomonocyte level
- Copyright
- © 2017 Song et al.
- Licence
- This is an open access article distributed under the terms of the Creative Commons Attribution License, which permits unrestricted use, distribution, reproduction and adaptation in any medium and for any purpose provided that it is properly attributed. For attribution, the original author(s), title, publication source (PeerJ) and either DOI or URL of the article must be cited.
- Cite this article
- 2017. Association between genetic polymorphisms of the IL28B gene and leukomonocyte in Chinese hepatitis B virus-infected individuals. PeerJ 5:e4149 https://doi.org/10.7717/peerj.4149
Abstract
Background
Hepatitis B infection is one of the most severe hepatic diseases in China. Thus, understanding the genetic pathogenesis of hepatitis B virus (HBV)-infected individuals is important. Although no consistent result is obtained in different populations, HBV treatment effect is reportedly associated with the IL28B gene.
Methods
To investigate the role of the IL28B gene in HBV-infected individuals in Yunnan, China, we screened genotypes of three single nucleotide polymorphisms (SNPs, rs12979860, rs8099917, and rs12980275) in HBV-infected individuals and general controls by using SnapShot and sequencing.
Results
Results showed no significant difference was found in genotypes, alleles, and haplotypes frequency between the HBV-infected individuals and controls. After dividing the HBV-infected individuals into patients in acute infection, chronic HBV patients, and patients undergoing convalescence, the genotype GT (P = 0.033) and allele G (P = 0.038) of rs8099917 showed statistically higher frequency in the acutely infectious individuals than in the HBV patients undergoing convalescence. HBV viral load was higher in the acutely infectious patients than in the chronic infection group. Strikingly, we found that leukomonocyte (LYM) level was associated with SNPs in the IL28B gene. In addition, the LYM levels were lower in the HBV-infected individuals with genotype CC of rs12979860 and AA of rs12980275 than in the patients with other genotypes of these two SNPs.
Conclusion
Our results suggested genetic polymorphisms of the IL28B gene were associated with LYM level of HBV-infected individuals.
Introduction
Although hepatitis B virus (HBV) vaccine is widely used, HBV infection remains a main cause of hepatic cirrhosis and hepatocellular carcinoma (EASL, 2012). Among 2 billion people infected with HBV, 350 million individuals develop chronic HBV infection (Liaw & Chu, 2009). Over 8% of Chinese, Southeast Asian, and African populations are hepatitis B surface antigen (HBsAg)-positive (Trepo, Chan & Lok, 2014), so HBV infection is still a serious problem in these populations. Genetic factors influence HBV-infection and treatment effects of HBV-infected individuals (Hu et al., 2012; Li et al., 2012; Wasityastuti et al., 2016). Understanding the role of host genetic variations in HBV infection, pathogenesis, and therapy is important to provide individualized protection and treatment for HBV-infected cases.
Interleukin 28B (IL28B) belongs to the interferon λ family, which is a new interferon family. Genetic variations of the IL28B gene have been identified to be associated with HCV infection, viral clearance, and response to therapy (Suppiah et al., 2009; Tanaka et al., 2009; Thomas et al., 2009; Zhang et al., 2014). However, genome-wide association studies (GWAS) in Asian population found that IL28B gene is not correlated with HBV infection or viral clearance (Kamatani et al., 2009; Hu et al., 2013). Kamatani et al. (2009) identified that genetic variants in the HLA-DP locus are strongly associated with risk of persistent HBV infection. Subsequently, two new gene loci (HLA-C and UBE2L3) have been highlighted to play important roles in the clearance of HBV infection (Hu et al., 2013). However, the single nucleotide polymorphisms (SNPs) or the haplotypes constructed by SNPs in the IL28B gene can influence the HBV infection, HBV surface antigen seroclearance, or treatment of HBV-infected individuals in special cohorts (Seto et al., 2013; Domagalski et al., 2014). SNPs rs12979860 and rs8099917 were mostly studied and identified to be associated with HBV-infection in Chinese (Chen et al., 2015). Until now, we found no study was performed to reveal the relationship of genetic polyporphisms in the IL28B of HBV-infected persons and biochemical characteristics. The purpose of this study is to investigate whether SNPs in the IL28B gene influence the HBV infection and biochemical characteristics of HBV-infected individuals in Yunnan, China.
Materials and Methods
Subjects
All HBV-infected individuals and age- and gender-matched controls were recruited by doctors in the First People’s Hospital of Yunnan Province. In our previous study, basic information, biochemical characteristics, and HBV serological markers of each subject were reported (Song et al., 2016). In brief, the liver function test (alanine transaminease (ALT), aspartate transaminase (AST), total bilirubin (TBIL), direct bilirubin (DBIL), indirect bilirubin (IBIL), total protein (TP), albumin (ALB), and globin (GLOB)), renal function (blood urea nitrogen (BUN), serum creatinine (CREA), serum uric acid (UA), and blood glucose (GLU)), and part of blood routine (white blood cells (WBC), neutrophilic granulocyte (NEUT), lymphocytes (LYM), monocytes (MONO), eosinophil granulocyte (EO), and basophile granulocyte (BASO)) were measured (all data has been reported in our previous study (Song et al., 2016)). All individuals were Han Chinese. In this study, whole blood samples (3 mL) of 493 HBV-infected individuals (274 males and 219 females) and 460 controls (285 males and 175 females) were collected. All HBV-infected individuals and controls were not infected with hepatitis C virus (HCV), human immunodeficiency virus (HIV), and Treponema pallidum. All controls were devoid of HBV, HCV, or HIV infection, and no seriously hepatitic disease (hepatic fibrosis, Hepatocellular Carcinoma, and so forth) were identified in controls. The mean ages of the individuals in the HBV-infected and control cohorts were 41.5 ± 0.3 and 38.8 ± 0.3 years (mean ± SEM), respectively. HBV-infected individuals were also without other serious liver disease. Written informed consent conforming to the tenets of the Declaration of Helsinki was obtained from each participant prior to the study. This study was approved by the Institutional Review Board of Kunming University of Science and Technology (Approval No. 2014SK027).
Genomic DNA extraction and genotyping
Genomic DNA was extracted from whole blood by using the TIANamp genomic DNA Kit (TIANGEN, China). Three SNPs (i.e., rs12979860, rs8099917, and rs12980275) in the IL28B gene were selected and analyzed as reference-described (Chen et al., 2015). Genotypes of each SNP were screened by using the SnapShot assay (Table S1). SnapShot is based on single-base extension. In brief, amplifying and extending primers for each SNP are firstly designed. Then PCR reaction is performed with two kinds of primers and will be terminated behind one base of 3′ end of extending primers. Finally, genotypes of each SNP are determined according to fluorescence color. Genotyping results of 10% total samples were verified by sequencing. Haplotypes were constructed using Phase software for further analysis (Stephens & Donnelly, 2003).
Subgrouping of HBV-infected individuals
According to the subgrouping principle in our previous study (Song et al., 2016), HBV-infected individuals were divided into three groups. Group #1 included patients who with HbsAg and HBeAg positive were at acute infected phase (N = 29). Group #2 included patients with HBsAg and anti-HBc positive, who were at chronic infected phase (N = 202). Patients in group #3 were comprised of HBV-infected individuals undergoing convalescence (N = 262), who were anti-HBc positive but HBV DNA negative.
Quantification of the HBV viral load
HBV DNA was extracted from the serum of each sample by using the TIANamp Virus DNA/RNA Kit (TIANGEN, China). The HBV viral load in the serum of 58 HBV-infected individuals was detected by using the Hepatitis B Viral DNA Quantitative Fluorescence Diagnostic Kit (realtime-PCR-Fluorescence Probing) (Sansure, Hunan, China) in accordance with the manufacturer’s instructions and ABI 7500 Fast Real-Time PCR system (Applied Biosystems, USA). Results were recorded in International Unit (IU)/mL; one IU/mL was equivalent to 5.6 copies/mL. The lowest detection limitation of this quantitative method was 2,800 copies/mL (500 IU/mL). In further analysis, HBV DNA was log10-transformed, i.e., the lowest detection limitation was 3.45 log10 copies/mL.
Data analysis
The Hardy–Weinberg equilibrium (HWE) was assessed in each variant to evaluate the deviation of collected cohorts. Given that the numbers of a genotype of each SNP were less than five, 1,000 iterations for simulation were performed. The Chi-square test was collected to analyze the frequency of genotypes and alleles between the different cohorts. Student’s t-test (unpaired, two tails) was used to compare HBV viral load between the two HBV-infected groups and biochemical characteristics among the HBV-infected individuals with different genotypes. Biochemical characteristics in the groups are presented as mean ± SEM. Correlation analysis was used to analyze the relationship between viral loads and LYM levels. Statistical significance was considered at P < 0.05.
Results
No deviation was found in the HBV-infected individuals and controls after calculating HWE, and these results suggested that the analyzed population was in genetic equilibrium. Genotype and allele frequency showed no significant difference between the HBV-infected individuals and general controls (Table 1). The genotyping data are listed in Tables S2 and S3 (Table S2 for HBV-infected patients and Table S3 for controls). Seven and five haplotypes constructed by three SNPs were identified in the HBV-infection group and controls, respectively. Although the haplotypes were somewhat different between two groups, the frequency of each haplotype showed no significant difference (Table 2).
| SNP (genotype/allele) | HBV-infected individual (N = 493) | Controls (N = 460) | P-valueb | OR | 95% CI | |
|---|---|---|---|---|---|---|
| rs12979860 | HWEaP = 1.00 | HWE P = 0.79 | ||||
| Genotype | CC | 439 | 400 | 0.320 | 1.219 | 0.824–1.804 |
| CT | 52 | 57 | 0.372 | 0.834 | 0.559–1.243 | |
| TT | 2 | 3 | 0.599 | 0.621 | 0.103-3.730 | |
| Allele | C | 930 | 857 | 0.292 | 1.221 | 0.842–1.771 |
| T | 56 | 63 | 0.819 | 0.565–1.188 | ||
| rs8099917 | HWE P = 1.00 | HWE P = 1.00 | ||||
| Genotype | GG | 1 | 2 | 0.523 | 0.465 | 0.042–5.151 |
| GT | 49 | 52 | 0.494 | 0.866 | 0.573–1.308 | |
| TT | 443 | 406 | 0.429 | 1.178 | 0.784–1.771 | |
| Allele | G | 51 | 56 | 0.386 | 0.842 | 0.570–1.244 |
| T | 935 | 864 | 1.188 | 0.804–1.756 | ||
| rs12980275 | HWE P = 0.78 | HWE P = 0.50 | ||||
| Genotype | AA | 437 | 398 | 0.321 | 1.216 | 0.826–1.788 |
| AG | 55 | 58 | 0.488 | 0.870 | 0.588–1.298 | |
| GG | 1 | 4 | 0.155 | 0.232 | 0.026–2.081 | |
| Allele | A | 929 | 854 | 0.216 | 1.260 | 0.873–1.817 |
| G | 57 | 66 | 0.794 | 0.550–1.145 | ||
| SNP (genotype/allele) | Group #1 (N = 29) | Group #2 (N = 202) | Group #3 (N = 262) | Group #1 v.s. group #2aP-value (OR, 95% CI)b | Group #1 v.s. group #3 P-value (OR, 95% CI) | Group #2 v.s. group #3 P-value (OR, 95% CI) | |
|---|---|---|---|---|---|---|---|
| rs12979860 | |||||||
| Genotype | CC | 24 | 178 | 237 | 0.415 (0.647, 0.226–1.856) | 0.196 (0.506, 0.178–1.444) | 0.416 (0.782, 0.432–1.415) |
| CT | 5 | 22 | 25 | 0.320 (1.705, 0.590–4.922) | 0.196 (1.975, 0.693–5.632) | 0.633 (1.159, 0.633–2.121) | |
| TT | 0 | 2 | 0 | 0.590 (–) | 1.000 (–) | 0.107 (–) | |
| Allele | C | 53 | 378 | 499 | 0.534 (0.729, 0.268–1.981) | 0.208 (0.531, 0.195–1.445) | 0.270 (1.373, 0.780–2.416) |
| T | 5 | 26 | 25 | 0.534 (1.372, 0.505–3.726) | 0.208 (1.883, 0.692–5.124) | 0.270 (0.728, 0.414–1.282) | |
| rs8099917 | |||||||
| Genotype | GG | 0 | 1 | 0 | 0.704 (–) | 1.000 (–) | 0.254 (–) |
| GT | 6 | 21 | 22 | 0.107 (2.248, 0.822–6.147) | 0.033 (2.846, 1.048–7.728) | 0.462 (1.266, 0.675–2.372) | |
| TT | 23 | 180 | 240 | 0.131 (0.469, 0.172–1.276) | 0.033 (0.351, 0.129–0.954) | 0.363 (0.750, 0.403–1.397) | |
| Allele | G | 6 | 23 | 22 | 0.172 (1.911, 0.744–4.913) | 0.038 (2.633, 1.022–6.786) | 0.293 (1.377, 0.756–2.509) |
| T | 52 | 381 | 502 | 0.172 (0.523, 0.204–1.345) | 0.038 (0.380, 0.147–0.979) | 0.293 (0.726, 0.399–1.322) | |
| rs12980275 | |||||||
| Genotype | AA | 24 | 177 | 236 | 0.466 (0.678, 0.237–1.939) | 0.226 (0.529, 0.186–1.504) | 0.402 (0.780, 0.436–1.397) |
| AG | 5 | 24 | 26 | 0.415 (1.545, 0.539–4.431) | 0.226 (1.891, 0.665–5.378) | 0.500 (1.224, 0.680–2.203) | |
| GG | 0 | 1 | 0 | 0.704 (–) | 1.000 (–) | 0.254 (–) | |
| Allele | A | 53 | 378 | 498 | 0.534 (0.729, 0.268–1.981) | 0.239 (0.553, 0.204–1.502) | 0.333 (0.759, 0.434–1.329) |
| G | 5 | 26 | 26 | 0.534 (1.372, 0.505–3.726) | 0.239 (1.807, 0.666–4.903) | 0.333 (1.317, 0.753–2.306) | |
HBV-infected individuals were divided into three subgroups according to HBV serological markers of patients. Excluding the genotype and allele frequency of SNP rs8099917 between groups #1 and #3, we identified no other significant difference (Table 3). The genotype GT of rs8099917 showed a statistically higher frequency in group #1 (20.69%, 6/29) than in group #3 (8.40%, 22/262) (P = 0.033), whereas the genotype TT of rs8099917 showed a significantly low frequency in group #1 (P = 0.033). The frequencies of allele G were 10.34% and 4.20% in patients of group #1 and of group #3, respectively. Hence, allele G likely seemed the risk factor for patient in group #1 (Table 3).
Given that the patients in group #3 underwent convalescence, HBV DNA viral load cannot be detected in this study. The HBV viral loads of 14 acutely and 44 chronic HBV-infected individuals were tested. The results showed that HBV viral load of the acutely HBV-infected individuals was higher than that of the chronic HBV-infected group (P = 0.0003) (Fig. 1). The viral loads of the patients with different genotypes of each SNP were similar in groups #1 and #2.
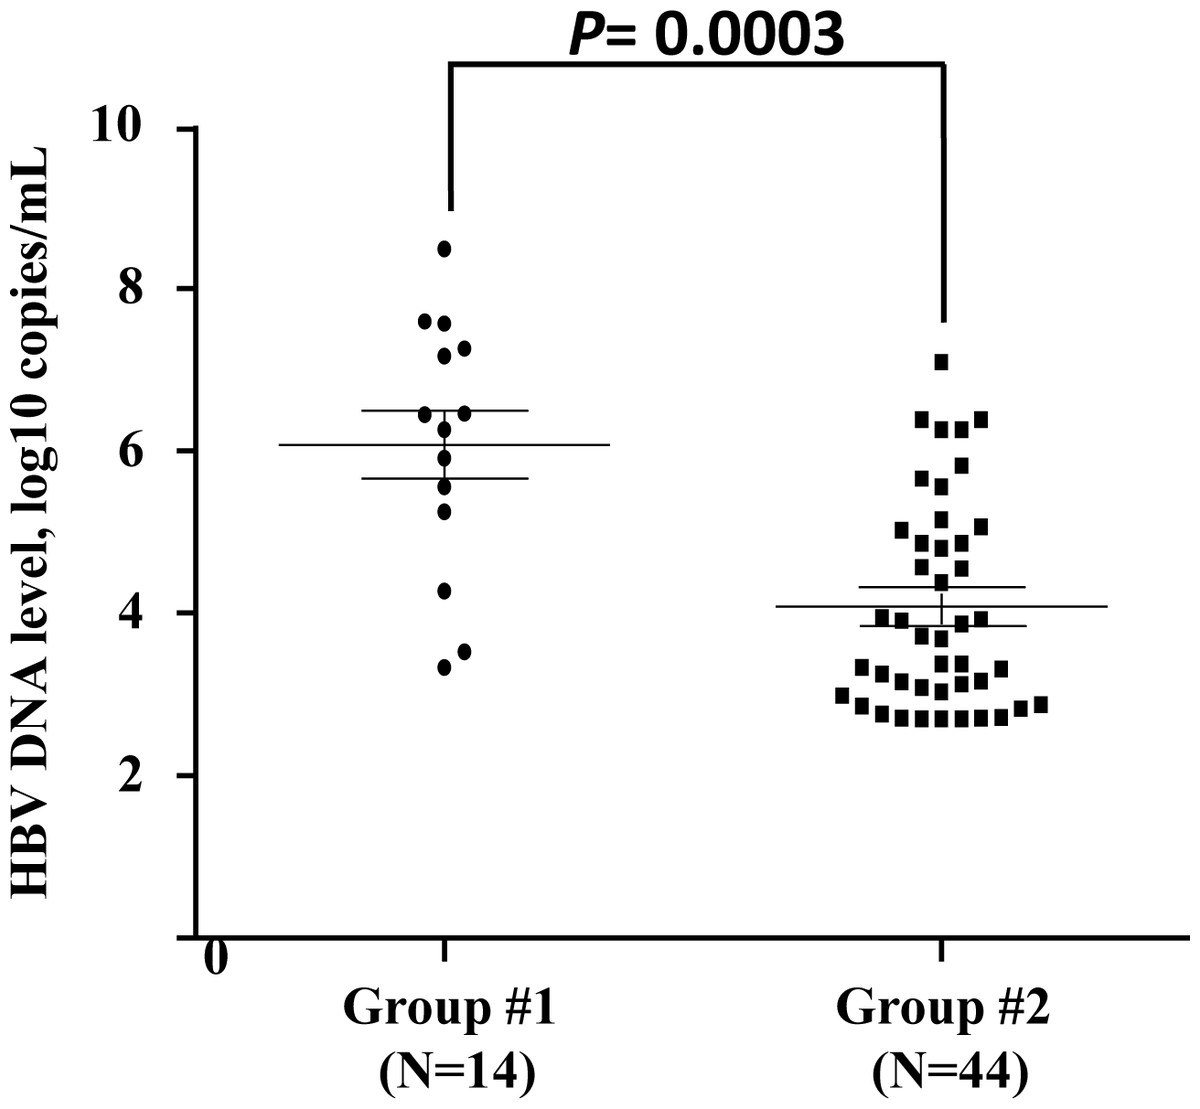
Figure 1: Quantification of viral load in acute or chronic HBV-infected individuals.
Each sample is represented by one circle (for acute HBV-infected individuals) or one square (for chronic HBV-infected individuals). The middle line in each group represents the mean number of the HBV viral load, together with standard error of the group.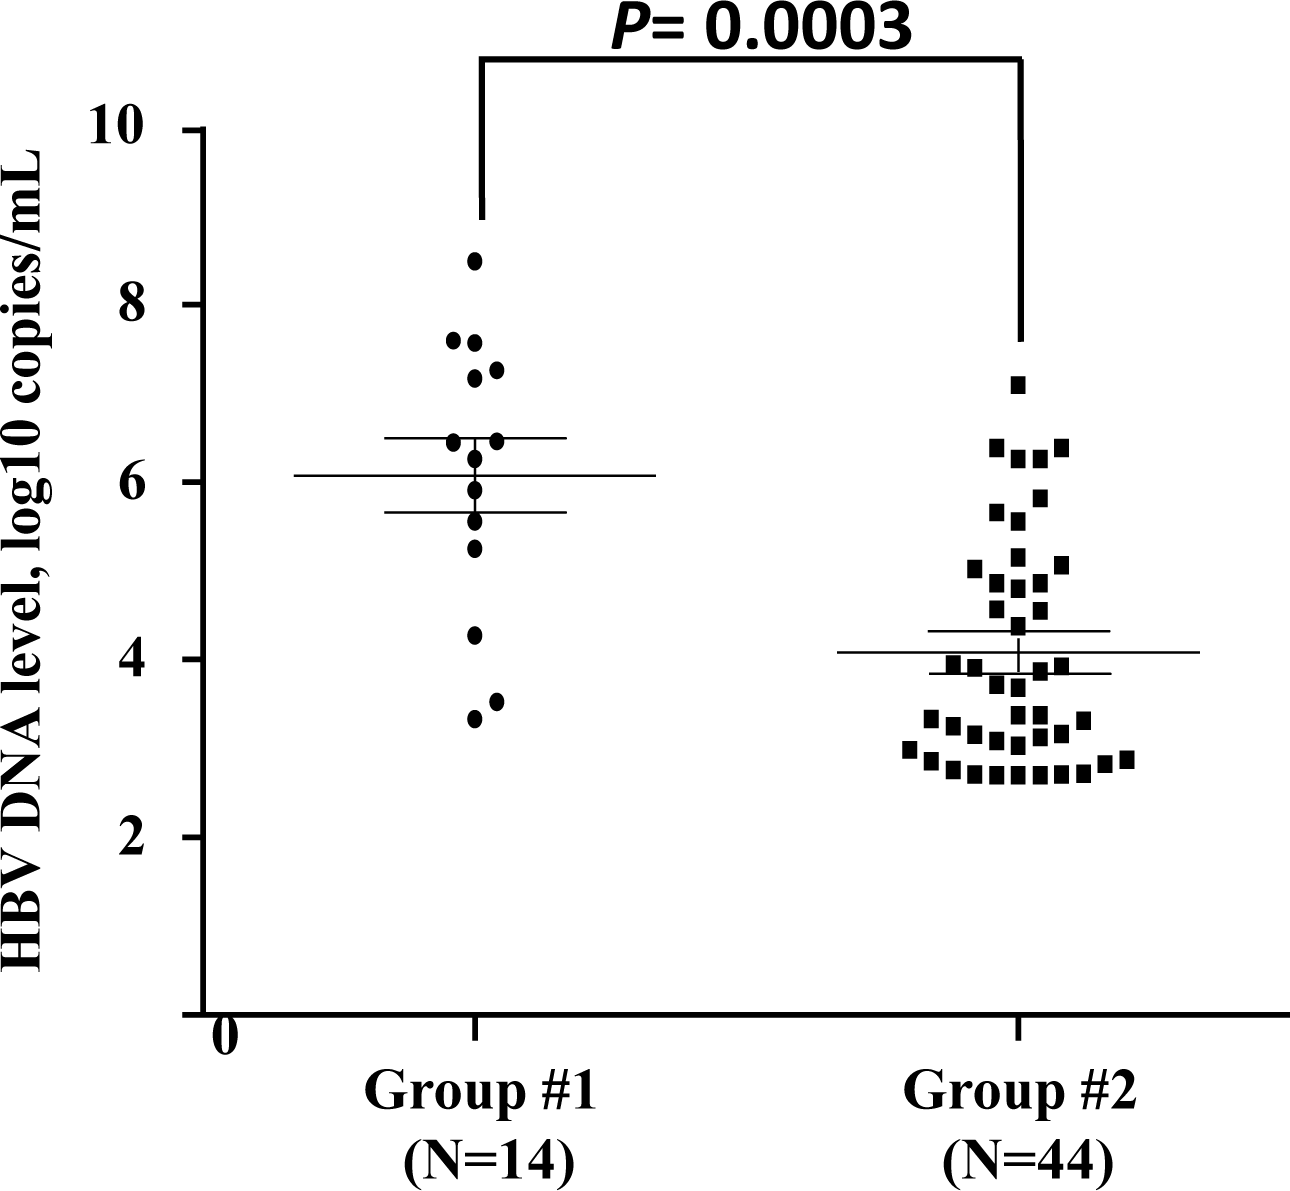
Considering that the frequencies of genotype CC of rs12979860, GG of rs8099917, and GG of 12980275 were minor in our two cohorts (HBV-infected individuals and controls), we pooled genotypes CC and CT of rs12979860, genotypes GG and GT of rs8099917, and genotypes GG and AG of rs12980275 for further biochemical characteristics analysis (Table 4). Results showed that leukomonocyte (LYM) levels existed discrepancies between two groups of SNPs rs12979860 and rs12980275. The LYM levels of the HBV-infected individuals with genotype CC of rs12979860 (P = 0.032) and genotype AA of rs12980275 (P = 0.034) were significantly lower than that of the patients with pooled genotypes. No correlation was found between HBV viral load and LYM level.
| Marker | rs12979860 (Mean ± SEM) | Marker | rs12979860 (Mean ± SEM) | ||||
|---|---|---|---|---|---|---|---|
| CC | CT & TT | P-valuea | CC | CT & TT | P- value | ||
| AST | 38.86 ± 4.29 | 32.41 ± 4.04 | 0.598 | BUN | 5.15 ± 0.19 | 4.42 ± 0.16 | 0.168 |
| ALT | 48.16 ± 7.46 | 36.02 ± 5.22 | 0.566 | CREA | 81.78 ± 5.94 | 63.09 ± 2.08 | 0.269 |
| TBIL | 14.77 ± 0.91 | 12.85 ± 0.73 | 0.460 | UA | 344.9 ± 5.05 | 338.7 ± 13.48 | 0.683 |
| DBIL | 6.48 ± 0.71 | 4.68 ± 0.36 | 0.371 | WBC | 9.26 ± 2.47 | 7.00 ± 0.36 | 0.749 |
| IBIL | 8.28 ± 0.26 | 8.18 ± 0.44 | 0.890 | NEUT | 4.39 ± 0.13 | 4.36 ± 0.35 | 0.939 |
| TP | 72.90 ± 0.37 | 72.89 ± 0.87 | 0.993 | LYM | 1.78 ± 0.03 | 2.00 ± 0.10 | 0.032 |
| ALB | 40.54 ± 0.29 | 40.69 ± 0.70 | 0.865 | MONO | 0.42 ± 0.01 | 0.45 ± 0.03 | 0.333 |
| GLOB | 32.36 ± 0.26 | 32.20 ± 0.66 | 0.843 | EO | 0.15 ± 0.01 | 0.12 ± 0.01 | 0.255 |
| GLU | 4.90 ± 0.07 | 4.61 ± 0.10 | 0.152 | BASO | 0.03 ± 0.001 | 0.03 ± 0.003 | 0.948 |
| Marker | rs8099917 (Mean ± SEM) | Marker | rs8099917 (Mean ± SEM) | ||||
|---|---|---|---|---|---|---|---|
| GG & GT | TT | P-value | GG & GT | TT | P-value | ||
| AST | 31.48 ± 3.92 | 38.91 ± 4.26 | 0.557 | BUN | 4.43 ± 0.16 | 5.15 ± 0.19 | 0.198 |
| ALT | 36.68 ± 5.60 | 47.98 ± 7.39 | 0.606 | CREA | 64.40 ± 2.26 | 81.46 ± 5.88 | 0.329 |
| TBIL | 13.69 ± 0.96 | 14.66 ± 0.90 | 0.719 | UA | 347.8 ± 14.26 | 343.8 ± 5.02 | 0.799 |
| DBIL | 4.93 ± 0.40 | 6.44 ± 0.70 | 0.471 | WBC | 6.89 ± 0.32 | 9.25 ± 2.45 | 0.747 |
| IBIL | 8.86 ± 0.63 | 8.21 ± 0.25 | 0.481 | NEUT | 4.31 ± 0.27 | 4.40 ± 0.13 | 0.827 |
| TP | 73.16 ± 0.90 | 72.87 ± 0.37 | 0.797 | LYM | 1.98 ± 0.10 | 1.79 ± 0.03 | 0.075 |
| ALB | 41.04 ± 0.66 | 40.50 ± 0.29 | 0.544 | MONO | 0.46 ± 0.03 | 0.42 ± 0.01 | 0.186 |
| GLOB | 32.12 ± 0.68 | 32.37 ± 0.26 | 0.760 | EO | 0.12 ± 0.02 | 0.15 ± 0.01 | 0.264 |
| GLU | 4.55 ± 0.09 | 4.90 ± 0.07 | 0.091 | BASO | 0.03 ± 0.003 | 0.03 ± 0.001 | 0.903 |
| Marker | rs12980275 (Mean ± SEM) | Marker | rs12980275 (Mean ± SEM) | ||||
|---|---|---|---|---|---|---|---|
| AA | AG & GG | P-value | AA | AG & GG | P-value | ||
| AST | 38.92 ± 4.31 | 32.20 ± 3.89 | 0.577 | BUN | 5.16 ± 0.19 | 4.43 ± 0.16 | 0.166 |
| ALT | 48.29 ± 7.49 | 35.48 ± 5.05 | 0.539 | CREA | 81.89 ± 5.96 | 62.95 ± 1.92 | 0.255 |
| TBIL | 14.75 ± 0.92 | 13.09 ± 0.72 | 0.517 | UA | 345.5 ± 5.13 | 334.3 ± 11.71 | 0.454 |
| DBIL | 6.49 ± 0.71 | 4.70 ± 0.34 | 0.368 | WBC | 9.27 ± 2.48 | 6.97 ± 0.34 | 0.741 |
| IBIL | 8.25 ± 0.26 | 8.40 ± 0.44 | 0.847 | NEUT | 4.39 ± 0.13 | 4.34 ± 0.34 | 0.895 |
| TP | 72.85 ± 0.38 | 73.27 ± 0.83 | 0.669 | LYM | 1.78 ± 0.03 | 2.00 ± 0.10 | 0.034 |
| ALB | 40.50 ± 0.29 | 40.96 ± 0.69 | 0.585 | MONO | 0.42 ± 0.01 | 0.45 ± 0.03 | 0.384 |
| GLOB | 32.35 ± 0.27 | 32.30 ± 0.62 | 0.956 | EO | 0.15 ± 0.01 | 0.12 ± 0.01 | 0.341 |
| GLU | 4.90 ± 0.07 | 4.64 ± 0.10 | 0.194 | BASO | 0.03 ± 0.001 | 0.03 ± 0.002 | 0.859 |
Notes:
Discussion
IL28B plays an important role in HCV infection and fateful hepatic diseases caused by HCV (Patin et al., 2012; Thompson et al., 2012). Although no association exists between HBV infection and genetic polymorphisms in the IL28B gene by GWAS, the IL28B gene could influence the viral clearance and treatment effect in different HBV-infected populations (Stattermayer & Ferenci, 2015). In the present study, we analyzed the genotype and allele frequency of SNPs in the IL28B gene, district phases of HBV infection, HBV viral load, and biochemical characteristics of HBV-infected individuals.
SNPs rs12979860, rs8099917, and rs12980275 were frequently studied in HBV-infected populations (Li et al., 2011; Martin-Carbonero et al., 2012). Although analysis results were not confident, the important role of IL28B could not be neglected. In the present study, we did not identify the association between the genotypes and alleles of three SNPs and HBV infection. However, the genotypes of rs8099917 were likely different between HBV-infected individuals under the acute infected phase and convalescence. This result suggested that genetic variations of the IL28B gene might influence HBV-infected phase. Considering that the HBV viral load was detected in only 58 HBV-infected individuals, we did not identify the association between HBV viral load and SNP genotypes in the IL28B gene. However, polymorphisms of the IL28B gene were reportedly associated with HBV viral load and liver inflammation (Li et al., 2011). HBV-infected sample size should be amplified for further study.
Genetic polymorphisms in the IL28B gene were reported not to affect HBV viral clearance in HBV-infected or HBV/HIV-coinfected persons (Sungkanuparph et al., 2004). Although the effect of the IL28B gene is unclear in HBV/HCV-coinfected persons, HBV viral load and/or viral clearance might be influenced (De Re et al., 2016) because of the affirmatory role of IL28B in HCV infection (Ge et al., 2009; Thomas et al., 2009). To exclude the effect of coinfection, we selected persons infected by HBV only and confirmed that genetic variations of the IL28B gene might relate to the pathogenesis of HBV infection and biochemical characteristics of HBV-infected individuals.
HBV viral load was detected in 58 HBV-infected individuals, including 14 acutely and 44 chronic infectious patients. The viral load was significantly higher in acute infectious group than in chronic group. However, no association was found between HBV viral load and genetic variations in the IL28B gene. Similarly, no correlation was found between HBV viral load and LYM level. These results suggested that the association between genetic polymorphisms and LYM might not be influenced by HBV viral load. Whether HBV genotype played a special role in the association needs further study.
LYM is one of the most important immune cells, which main function is to recognize and clear the bacteria, virus, and tumor. When individuals are infected by virus, LYM will be activited and induce a series of immune response. Due to the lack of analysis between LYM level and genetic polymorphisms in HBV-infected patients, we firstly performed and identified that the LYM level showed significant difference between HBV patients with differ genotypes of SNPs rs12979860 and rs12980275. Although the results needs further verification, it would help us to explore the role of LYM in HBV infection.
Conclusion
No association was found between genetic variations in the IL28B gene and HBV infection in Yunnan population. However, LYM level could be influenced by genetic variations in the IL28B gene in this study. Further complex analyses should focus in studying the relationship between host genetic factors, biochemical characteristics of HBV patients, HBV infection, HBV-infected process, HBV viral load, and HBV genotypes.
Supplemental Information
Primers used in study
Primers for PCR amplification and genotyping.
Raw data for normal controls
Genotypes of three SNPs in control persons.