
Associations between the rs5498 (A > G) and rs281432 (C > G) polymorphisms of the ICAM1 gene and atherosclerotic cardiovascular disease risk, including hypercholesterolemia
- Published
- Accepted
- Received
- Academic Editor
- Antonio Palazón-Bru
- Subject Areas
- Bioinformatics, Cardiology, Epidemiology, Medical Genetics, Metabolic Sciences
- Keywords
- Atherosclerotic cardiovascular disease, Hypercholesterolemia, Single nucleotide polymorphism, Intercellular adhesion molecule 1, ICAM1 gene, Resting heart rate
- Copyright
- © 2022 Wechjakwen et al.
- Licence
- This is an open access article distributed under the terms of the Creative Commons Attribution License, which permits unrestricted use, distribution, reproduction and adaptation in any medium and for any purpose provided that it is properly attributed. For attribution, the original author(s), title, publication source (PeerJ) and either DOI or URL of the article must be cited.
- Cite this article
- 2022. Associations between the rs5498 (A > G) and rs281432 (C > G) polymorphisms of the ICAM1 gene and atherosclerotic cardiovascular disease risk, including hypercholesterolemia. PeerJ 10:e12972 https://doi.org/10.7717/peerj.12972
Abstract
Background
Atherosclerotic cardiovascular disease (ASCVD) originates from complex risk factors, including age, gender, dyslipidemia, obesity, race, genetic and genetic variation. ICAM1 gene polymorphisms are a significant risk factor for ASCVD. However, the impact of the rs5498 and rs281432 polymorphisms on the prevalence of hypercholesterolemia (HCL) has not been reported. Therefore, we determine the relationships between single nucleotide polymorphisms (SNPs), including rs5498 and rs281432 on Intercellular adhesion molecule 1 gene (ICAM1) and ASCVD susceptibility in patients with HCL.
Methods
The clinical characteristics of 278 participants were assessed, and classified to groups having HCL and without HCL. ICAM1 SNPs genotyping was performed by DNA sequencing, and ICAM1 expression was measured using real-time PCR.
Results
Positive dominant model rs5498 participants had twice the risk of HCL (95% confidence interval (CI): [1.24–3.23], P = 0.005). The frequency of the G allele in rs5498 was 1.69 times higher in participants with HCL than in controls (95% CI [1.15–2.47], P = 0.007). Participants with the rs5498 AG or GG variants and high ICAM1 mRNA expression (≥3.12) had 2.49 times the risk (95% CI [1.42–4.38], P = 0.001), and those with a high LDL-C concentration (≥3.36 mmol/L) had 2.09 times the risk (95% CI [1.19–3.66], P = 0.010) of developing ASCVD compared with those with low ICAM1 mRNA and LDL-C levels. Interestingly, participants carrying the rs5498 AG or GG variants who had tachycardia (resting heart rates (RHRs) >100 beats/min) had a 5.02-times higher risk than those with a lower RHR (95% CI [1.35–18.63], P = 0.016).
Conclusions
It may consider the G allele in ICAM1 rs5498 is associated with a higher risk of ASCVD in Thai people with HCL, and is also positively associated with ICAM1 mRNA expression, LDL-C concentration, and RHR.
Introduction
Atherosclerotic cardiovascular disease (ASCVD), which involves the accumulation of plaque in the subendothelial space of arterial walls, is a fundamental process in the development of various cardiovascular diseases, including coronary heart disease (CHD), cerebrovascular disease (CeVD), and peripheral artery disease (Linton et al., 2019; Mach et al., 2019). The many risk factors for ASCVD can be classified as modifiable risk factors, including dyslipidemia, high blood pressure, obesity, diabetes, alcohol consumption, and smoking, or non-modifiable risk factors, including age, sex, and genetic variation (Arnett et al., 2019; Boehme, Esenwa & Elkind, 2017; Chen, Chang & Liou, 2020; Mach et al., 2019; Van Dijk et al., 2015; Virani et al., 2020). Hypercholesterolemia (HCL) is a major risk factor for ASCVD that is a component of an abnormal lipid metabolism (Martinez-Hervas & Ascaso, 2019; Verbeek et al., 2018) and promotes endothelial dysfunction, which is associated with ischemic heart disease and stroke (Grundy et al., 2004; Manktelow & Potter, 2009; O’Gara et al., 2013).
Intercellular adhesion molecule 1 gene (ICAM1; CD54) is one of the immunoglobulin superfamily of cell adhesion molecules (CAMs) and is encoded by a gene located on chromosome 19p13.2 to 13.3. It plays a pivotal role in the firm attachment and transendothelial migration of leukocytes into the vascular intima. The ICAM1 gene has been shown to be a potential biomarkers of endothelial dysfunction, which is the earliest stage in the pathogenesis of ASCVD (Di Pietro, Formoso & Pandolfi, 2016; Herbert Haught et al., 1996; Sonja, Milica & Slađana, 2017). ICAM1 expression and function depends on its complement of single nucleotide polymorphisms (SNPs) and there are several known SNPs that are related to chronic inflammatory diseases, such as heart disease and stroke (Gazi et al., 2014; Li, Qu & Dong, 2014; Shaker et al., 2010; Wang et al., 2015). In Asian populations, rs5498 (A>G) and rs281432 (C>G) in the ICAM1 gene have been reported to affect the risks of ASCVD and other cardiovascular diseases (CVDs) (Chou et al., 2015; Yang et al., 2014; Yin et al., 2019).
Resting heart rate (RHR) is a non-invasive clinical parameter that is regulated by the autonomic nervous system (ANS). The effect of inflammatory mediators on endothelial cells inhibits the effects of the ANS. The consequence is excessive sympathetic tone, which has marked deleterious effects on the vascular system, including an increase in heart rate, the induction of arrhythmias, such as tachycardia (RHR >100 beats/min) and atrial fibrillation (Nasibullin et al., 2016), and high blood pressure (Böhm et al., 2015; Christofaro et al., 2017; Nanchen et al., 2013a; Nanchen et al., 2013b; Thayer, Yamamoto & Brosschot, 2010). Furthermore, several previous studies have shown that a high heart rate affects several stages of the development of vascular diseases via endothelial function and genetic changes in several kinds of gene (Custodis et al., 2010; Evans et al., 2019; Fox et al., 2007; Heusch, 2008; Palatini, 2007; Reil & Böhm, 2007).
Although ICAM1 gene variants have been reported to be important in patients with vascular diseases, there have been few studies of the relationships between ICAM1 gene SNPs, RHR and HCL (Li, Qu & Dong, 2014; Nasibullin et al., 2016; Nepal, Yadav & Kong, 2019). Therefore, we conducted a cross-sectional study to explore the relationships between the ICAM1 SNPs, rs5498 (A>G) and rs281432 (C>G), HCL, and ASCVD in Thai adults. We hypothesized that individuals with HCL who carry these genetic variants would show higher gene expression, impaired ANS function, and have a greater risk of ASCVD. If so, the identification of these polymorphisms would be useful for the prediction and prevention of ASCVD.
Materials and Methods
Ethics statement
The study protocol was approved by the ethics committee of the Faculty of Tropical Medicine, Mahidol University (TMEC 18-026), and written informed consent was obtained from all the participants.
Study design and participants
We conducted a cross-sectional study in which we randomly recruited 278 adults who had no evidence of systemic inflammation or infectious diseases in Sung Noen District, Nakhon Ratchasima Province, Thailand. The participants comprised 85 men and 193 women, aged between 35 and 60 years. The exclusion criteria were: (1) pregnancy or lactation; (2) presence of a serious health condition, including ischemic heart disease, stroke, peripheral artery disease, or any chronic disease; and (3) the regular use of medication. The participants were classified into two groups according to their lipid profile: 143 controls and 135 with HCL. The presence of HCL was diagnosed according to the National Cholesterol Education Program Adult Treatment Panel III (NCEP ATP III), as follows: serum total cholesterol (TC) ≥ 5.17 mmol/L, triglycerides (TG) ≥ 1.70 mmol/L, low-density lipoprotein-cholesterol (LDL-C) ≥ 3.37 mmol/L, high-density lipoprotein-cholesterol (HDL-C) ≤ 1.04 mmol/L for men and ≤ 1.29 mmol/L in women, and TG/HDL-C ratio ≥ 1.75 mmol/L. Each of these cut-off values is borderline high according to the reference ranges (Expert Panel on Detection, Evaluation, and Treatment of High Blood Cholesterol in Adults, 2001).
Clinical and laboratory evaluation
The participants underwent a physical examination to determine their health status. RHR and blood pressure were measured after 15 min of rest in the sitting position using an automatic oscillometer (Riester, Jungingen, Germany). Anthropometric measurements were made and classified according to the World Health Organization (WHO) Asia-Pacific guidelines (WHO, 2000; WHO, 2004). Body mass index (BMI) was calculated as body mass divided by height squared (kg/m2). Waist and hip circumference were measured using an inelastic tape-measure and waist-to-hip ratio (WHR) was calculated. These procedures were performed by the same trained nurses and researchers, using standardized techniques. Blood samples were collected from peripheral blood vessels after at least 8 h of fasting to determine lipid profile. Serum TC, TG, and HDL-C concentrations were determined using enzymatic colorimetric methods on a Cobas 6000 analyzer (Roche Diagnostics International Ltd., Basel, Switzerland). Serum low-density lipoprotein-cholesterol (LDL-C) concentration was calculated using the Friedewald equation in participants with a TG concentration <4.5 mmol/L as follows: [LDL-C] = [TC] − ([TG]/2.2) − [HDL-C] (Friedewald, Levy & Fredrickson, 1972).
Genomic DNA extraction, genotyping of the ICAM1rs5498 (AG) and rs281432 (CG) polymorphisms, and DNA sequencing
Genomic DNA was extracted from peripheral blood leukocytes using a FlexiGene DNA kit (Qiagen, Hilden, Germany), according to the manufacturer’s instructions. The ICAM1 rs5498 and rs281432 polymorphisms were identified by PCR using KAPA2G Fast HotStart master mix (Kapa Biosystems, Wilmington, MA, USA) containing 1 µL of template DNA and 0.5 µL of each primer (forward and reverse). The final volume was adjusted to 25 µL with nuclease-free water. The PCR amplification conditions comprised an initial denaturation step of 5 min at 95 °C, followed by 35 cycles of denaturation for 30 s at 95 °C, annealing for 45 s at 60 °C, and extension for 30 s at 72 °C, with a final extension of 5 min at 72 °C. The primers used for ICAM1 rs5498 were (forward) 5′-TTG AGG GCA CCT ACC TCT GT-3′ and (reverse) 5′-CAT TAT GAC TGC GGC TGC TA-3′, yielding an amplicon of size 214 bp, and those for rs281432 were (forward) 5′-GAG GAG CTG GGA CTT TCC TT-3′ and (reverse) 5′-CCC TGA CCT GCA GTC CTT TA-3′, yielding an amplicon of 231 bp. The amplified DNA was evaluated by agarose gel electrophoresis. The ICAM1 rs5498 and rs281432 regions were also directly genotyped by DNA sequencing by Bio Basic Asia Pacific Pte. Ltd. (Bukit Batok, Singapore).
RNA extraction and real-time PCR analysis
To measure ICAM1 mRNA expression in peripheral blood mononuclear cells, RNA was isolated using NucleoZol reagent (Macherey-Nagel, Duren, Germany), according to the manufacturer’s instructions. To synthesize cDNA for real-time PCR, 2 µg RNA was reverse transcribed and genomic DNA was removed using a ReverTra Ace® qPCR RT Master Mix and gDNA remover from Toyobo Co. Ltd. (Osaka, Japan). Real-time PCR was performed according to the manufacturer’s instructions using iTaq™ Universal SYBR® Green Supermix (Bio-Rad Laboratories Inc., Hercules, CA, USA). The primer sequences were as follows: (forward) 5′-GCA TCC TGG GCT ACA CTG AG-3′ and (reverse) 5′-TGC TGT AGC CAA ATT CGT TG-3′ for the reference gene GAPDH, and (forward) 5′-ACA GTC ACC TAT GGC AAC GAC-3′ and (reverse) 5′-GTC ACT GTC TGC AGT GTC TCC T-3′ for ICAM1. The relative ICAM1 mRNA expression was normalized to that of GAPDH. All amplification reactions were performed in duplicate and the results were quantified using the 2−ΔΔCt method.
Statistical analysis
Statistical analyses were conducted using SPSS 18.0 (IBM, Inc., Armonk, NY US). The continuous data were first tested for normal distribution using the Kolmogorov–Smirnov test. If the data were normally distributed, differences of mean between two groups were identified using Student’s t test. One-way analysis of variance (ANOVA) was used to compare data more than two groups and followed by a post-hoc analysis. For multiple testing, the results for ICAM1 rs5498 genotype, including reference allele and variant genotype among participants were corrected using a Bonferroni correction, based on the number of calculated (n = 6). This study set significance at a Bonferroni corrected alpha (α) [corrected P < 0.008, α = 0.050/6]. Meanwhile, the Mann–Whitney U test or Kruskal-Wallis test for non-normally distributed data. Twin sets of categorical data were compared using the chi-square test. The genotype frequencies of the ICAM1 variants were analyzed for Hardy-Weinberg equilibrium (HWE) in the HCL and control groups. To determine the relationships between ICAM1 SNPs and HCL, odds ratios (ORs) and 95% confidence intervals (95% CIs) were calculated using logistic regression. Comparisons of the distributions of the alleles and genotypes were performed using the chi-square test. Statistical significance was set at P < 0.05.
Results
Clinical and laboratory characteristics of the participants with HCL and controls
Table 1 shows the clinical and laboratory characteristics of participants with HCL and controls. The prevalence of HCL was 49% (135/278). The sex and age ratios in the groups were identical. The SBP, DBP, and RHR of the participants were significantly higher than those of controls. Likewise, the body composition of the groups differed: BMI, WC, HC, and WHR were significantly higher in the HCL group than the control group. As expected, the serum TC, LDL-C, and TG concentrations and the TG/HDL-C ratio of the HCL group were significantly higher than those of controls (all P < 0.001). Moreover, there were no significant differences in behavioral characteristics, including in the prevalences of cigarette smoking, alcohol consumption, and exercise, between the HCL and control groups. However, there were no differences in HDL-C concentration or ICAM1 mRNA expression between the two groups (P = 0.218 and P = 0.096, respectively).
| Variables | Control | HCL | P value |
|---|---|---|---|
| N | 143 | 135 | – |
| Age, (years) | 46.56 ± 6.47 | 48.06 ± 6.00 | 0.065 |
| Male (%) | 32.9 | 28.1 | 0.393 |
| Smoker (%) | 21.7 | 25.9 | 0.405 |
| Current alcohol consumer (%) | 37.8 | 40.7 | 0.611 |
| Exercise (%) | 9.1 | 8.9 | 0.953 |
| SBP (mmHg) | 122.42 ± 14.70 | 128.48 ± 15.30 | 0.001 |
| DBP (mmHg) | 76.59 ± 10.05 | 80.13 ± 9.87 | 0.003 |
| RHR (beats/min) | 77.44 ± 12.13 | 81.04 ± 11.53 | 0.012 |
| BMI (kg/m2) | 25.70 ± 5.01 | 27.30 ± 4.62 | 0.006 |
| WC (cm) | 85.70 ± 12.31 | 89.27 ± 10.34 | 0.009 |
| HC (cm) | 95.59 ± 10.31 | 97.87 ± 8.89 | 0.049 |
| WHR | 0.89 ± 0.06 | 0.91 ± 0.06 | 0.023 |
| TC (mmol/L) | 4.30 ± 0.65 | 5.47 ± 1.01 | <0.001 |
| LDL-C (mmol/L) | 2.48 ± 0.53 | 3.33 ± 0.90 | <0.001 |
| HDL-C (mmol/L) | 1.30 ± 0.32 | 1.25 ± 0.34 | 0.218 |
| TG (mmol/L) | 1.10 (0.41, 2.94) | 1.90 (0.60, 4.46) | <0.001* |
| TG/HDL-C ratio | 0.89 (0.22, 2.44) | 1.49 (0.34, 8.62) | <0.001* |
| ICAM1 mRNA expression (arbitrary units) | 1.15 (0.14, 9.19) | 1.51 (0.15, 9.97) | 0.096* |
Notes:
- HCL
-
hypercholesterolemia
- SBP
-
systolic blood pressure
- DBP
-
diastolic blood pressure
- RHR
-
resting heart rate
- BMI
-
body mass index
- WC
-
waist circumference
- HC
-
hip circumference
- WHR
-
waist to hip ratio
- TC
-
total cholesterol
- LDL-C
-
low-density lipoprotein-cholesterol
- HDL-C
-
high-density lipoprotein-cholesterol
- TG
-
triglycerides
- TG/HDL-C ratio
-
triglyceride-to-high-density lipoprotein-cholesterol ratio
- ICAM1
-
Intercellular Adhesion Molecule 1
P values calculated using the χ2 test (categorical variables) or Student’s t test (continuous variables with normal distribution, the data represent as mean ± S.D).
A smoker was defined who had smoked at least 100 cigarettes in their lifetime. Moderate and heavy alcohol drinking were classified as a current alcohol consumer. Exercise was defined as activity of a moderate or vigorous intensity for ≥30 min/day on at least 3 days a week.
P value < 0.05 (in bold) was considered statistically significant.
ICAM1rs5498 and rs281432 genotype
The rs5498 and rs281432 polymorphisms of ICAM1 were genotyped. As shown in Fig. 1, the heterozygous and homozygous variants of ICAM1 rs5498 were identified as AG and GG, while AA genotype was the reference allele, and those of rs281432 were CG and GG, and CC, respectively.
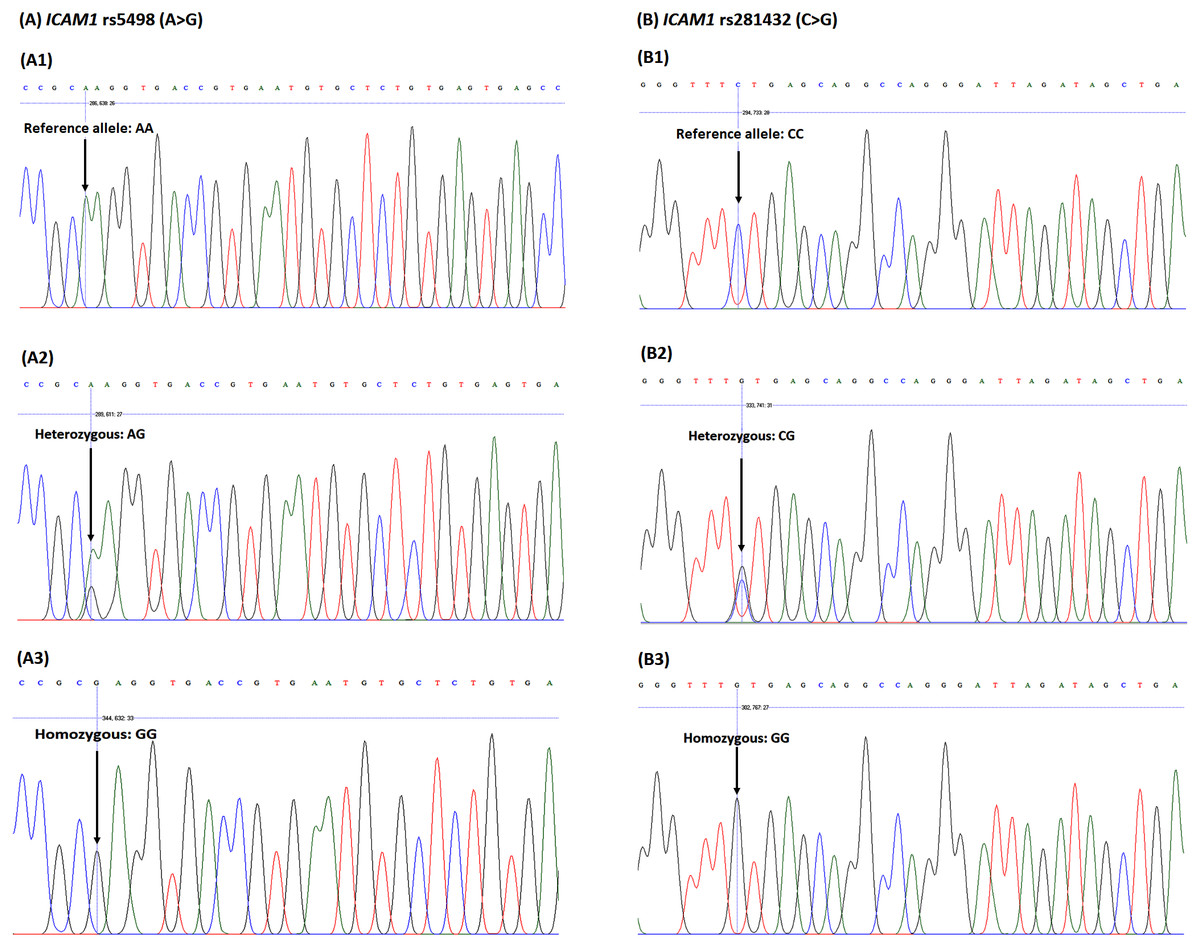
Figure 1: DNA sequencing chromatograph for the ICAM1 (A) rs5498 (A > G) polymorphism and (B) rs281432 (C >G) polymorphism.
The ICAM1 rs5498 (A1) reference allele, homozygous genotype: AA; (A2) heterozygous genotype: AG; (A3) homozygous genotype: GG. The ICAM1 rs281432 (B1) reference allele, homozygous genotype: CC; (B2) heterozygous genotype: CG); (B3) homozygous genotype: GG.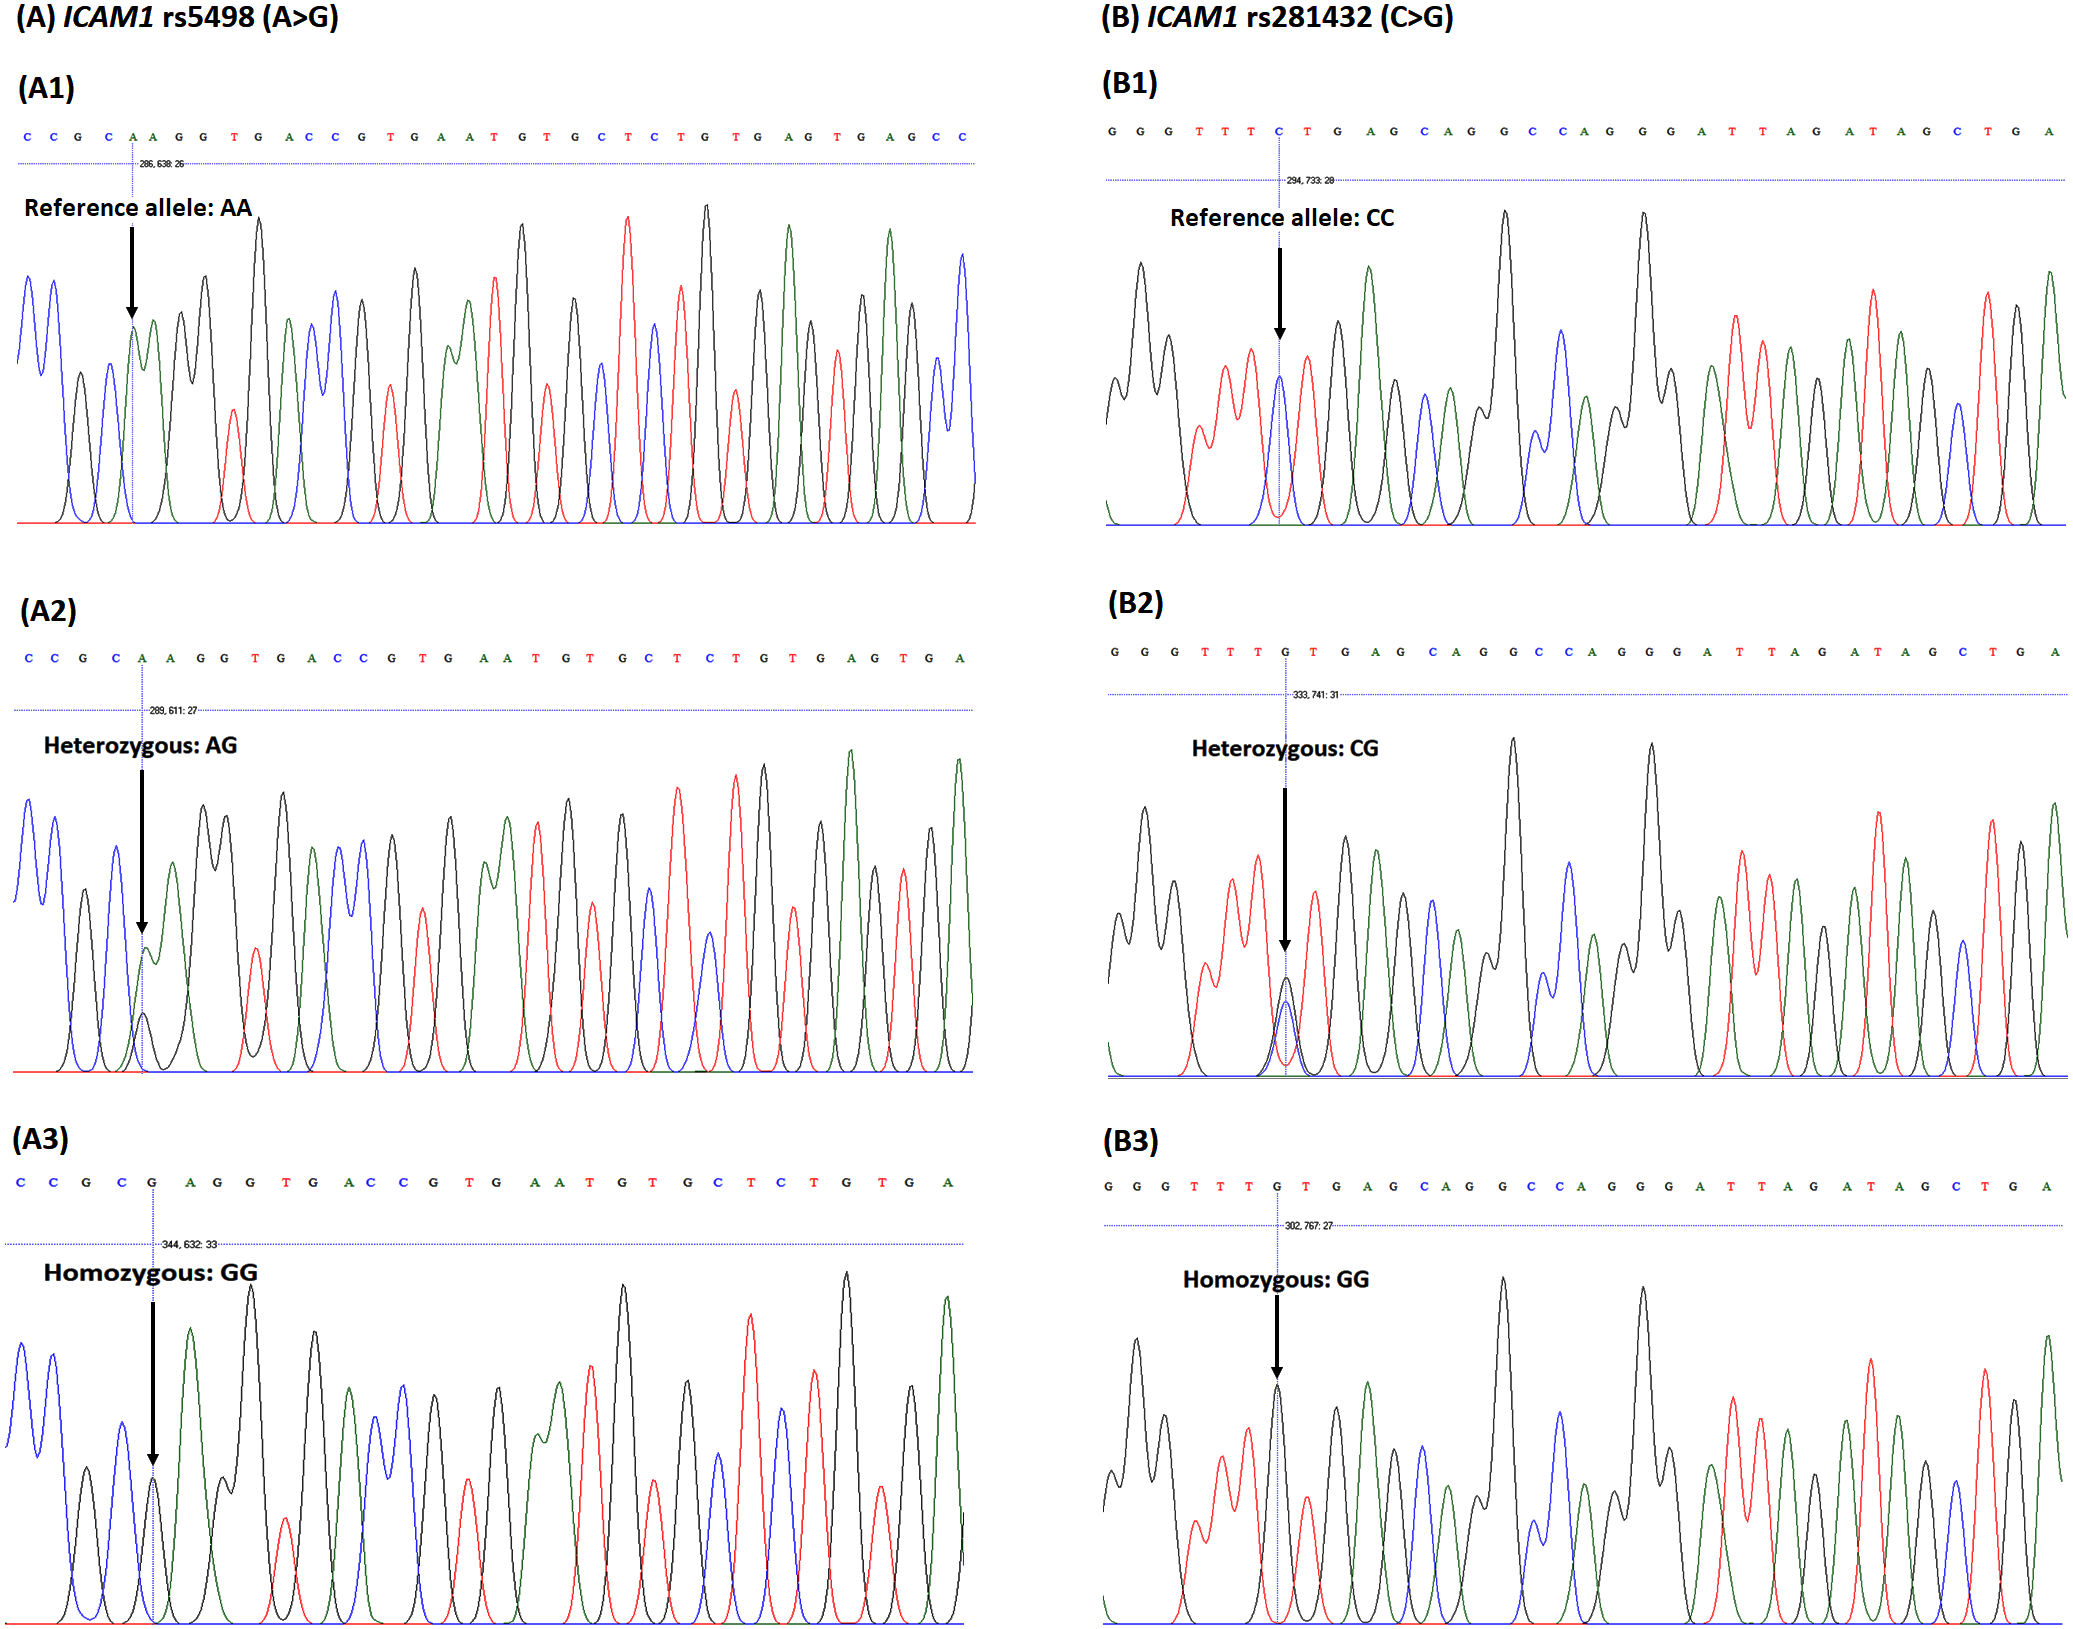
Associations of the ICAM1rs5498 and rs281432 polymorphisms with HCL
The distributions of the genotypes were consistent with the presence of Hardy-Weinberg equilibrium in both groups. As shown in Table 2, the genotype distribution of ICAM1 rs5498 (A > G) in the participants with HCL was GG (10%), AG (43%), and AA (47%), which was significantly different to that of the control participants, who had a distribution of GG (7.0%), AG (29%), and AA (64%). Allele frequency analysis for ICAM1 rs5498 showed that the G allele was more frequent in the participants with HCL than in controls (OR = 1.69, 95% CI [1.15–2.47], P = 0.007). Moreover, the genetic model of ICAM1 rs5498 was evaluated, which demonstrated a statistically significant association between ICAM1 rs5498 and HCL in the dominant model (AA vs. AG+GG) (OR = 2.00, 95% CI [1.24–3.23], P = 0.005). This also showed a positive association between the presence of both HCL and ICAM1 rs5498 and a high risk of ASCVD. However, there was no significant difference in the genotype distribution of ICAM1 rs281432 (C >G) between the HCL and control groups. The risk factors in genetic models of rs281432 (codominant, dominant, and recessive) were compared by logistic regression analysis and no significant associations were found using these genetic models.
| Variables | All participants (n = 278) | Control (n = 143) | HCL (n = 135) | OR (95% CI) | P value |
|---|---|---|---|---|---|
| ICAM1rs5498 allele, n (%) | |||||
| A | 408 (73.0) | 224 (78.0) | 184 (68.0) | (Reference) | |
| G | 148 (27.0) | 62 (22.0) | 86 (32.0) | 1.69 (1.15–2.47) | 0.007 |
| PHWE | 0.220 | 1.000 | 0.140 | ||
| ICAM1rs5498 genotypes | |||||
| Codominant effects, n (%) | |||||
| AA | 154 (55.0) | 91 (64.0) | 63 (47.0) | (Reference) | |
| AG | 100 (36.0) | 42 (29.0) | 58 (43.0) | 1.99 (1.20–3.32) | 0.008 |
| GG | 24 (9.0) | 10 (7.0) | 14 (10.0) | 2.02 (0.84–4.84) | 0.114 |
| Dominant effects, n (%) | |||||
| AA | 154 (55.0) | 91 (64.0) | 63 (47.0) | (Reference) | |
| AG + GG | 124 (45.0) | 52 (36.0) | 72 (53.0) | 2.00 (1.24–3.23) | 0.005 |
| Recessive effects, n (%) | |||||
| AA + AG | 254 (91.0) | 133 (93.0) | 121 (90.0) | (Reference) | |
| GG | 24 (9.0) | 10 (7.0) | 14 (10.0) | 1.54 (0.66–3.59) | 0.319 |
| ICAM1rs281432 allele, n (%) | |||||
| C | 362 (65.0) | 185 (65.0) | 177 (66.0) | (Reference) | |
| G | 194 (35.0) | 101 (35.0) | 93 (34.0) | 0.96 (0.68–1.36) | 0.859 |
| PHWE | 0.360 | 0.580 | 0.570 | ||
| ICAM1rs281432 genotypes | |||||
| Codominant effects, n (%) | |||||
| CC | 114 (41.0) | 58 (41.0) | 56 (41.0) | (Reference) | |
| CG | 134 (48.2) | 69 (48.0) | 65 (48.0) | 0.98 (0.59–1.61) | 0.923 |
| GG | 30 (10.8) | 16 (11.0) | 14 (10.0) | 0.91 (0.40–2.03) | 0.811 |
| Dominant effects, n (%) | |||||
| CC | 114 (41.0) | 58 (41.0) | 56 (41.0) | (Reference) | |
| CG +GG | 164 (59.0) | 85 (59.0) | 79 (58.0) | 0.96 (0.60–1.55) | 0.876 |
| Recessive effects, n (%) | |||||
| CC +CG | 248 (89.2) | 127 (89.0) | 121 (89.0) | (Reference) | |
| GG | 30 (10.8) | 16 (11.0) | 14 (10.0) | 0.92 (0.43–1.96) | 0.826 |
Notes:
P values assessed using odds ratios, according to the genetic model. PHWE for the Hardy-Weinberg equilibrium test. Genetic models: codominant model (reference allele vs. heterozygous variants and reference allele vs. homozygous variants), dominant model (reference allele vs. heterozygous variants + homozygous variants), and recessive model (reference allele + heterozygous variants vs. homozygous variants). P value <0.05 was considered statistically significant.
Comparison of the clinical and laboratory characteristics of participants with rs5498 and rs281432 of ICAM1 polymorphisms using the dominant model
We found strong associations between the SNPs and HCL using the dominant model (Table 2). Therefore, we further analyzed the relationships between ICAM1 SNPs, HCL, and other variables. The mean values of clinical and laboratory characteristics were calculated according to allele distribution (Table 3). Participants carrying the G allele (AG and GG genotype) of rs5498 had a higher RHR than those carrying only the A allele (AA vs. AG + GG: 77.26 ± 11.44 bpm vs. 81.58 ± 12.19 bpm; P = 0.003). Furthermore, participants carrying the G allele of rs5498 had higher serum TC and LDL-C concentrations and ICAM1 mRNA expression than those carrying only the A allele (P = 0.004, 0.002, and <0.001, respectively). Moreover, the prevalence of smoking was higher in rs5498 reference allele (AA) participants than in those with the variants (AG+GG) (P = 0.035). However, there were no differences between these groups with respect to alcohol consumption, exercise, serum TG concentration, or TG/HDL-C ratio. Furthermore, there were no significant relationships between the ICAM1 rs281432 genotype and clinical and laboratory characteristics.
| Variables | ICAM1rs5498 | P value | ICAM1rs281432 | P value | ||
|---|---|---|---|---|---|---|
| AA (n = 154) | AG + GG (n = 124) | CC (n = 114) | CG + GG (n = 164) | |||
| Age (years) | 47.66 ± 6.40 | 46.81 ± 6.13 | 0.264 | 47.65 ± 5.92 | 47.04 ± 6.53 | 0.428 |
| Male (%) | 34.4 | 25.8 | 0.121 | 28.1 | 32.3 | 0.450 |
| Smoker (%) | 28.6 | 17.7 | 0.035 | 24.6 | 23.2 | 0.789 |
| Current alcohol consumer (%) | 40.3 | 37.9 | 0.689 | 41.2 | 37.8 | 0.565 |
| Exercise (%) | 9.7 | 8.1 | 0.627 | 9.6 | 8.5 | 0.750 |
| SBP (mmHg) | 125.66 ± 15.73 | 124.99 ± 14.73 | 0.717 | 127.25 ± 17.34 | 124.05 ± 13.55 | 0.085 |
| DBP (mmHg) | 78.38 ± 9.71 | 78.22 ± 10.61 | 0.892 | 79.17 ± 11.29 | 77.71 ± 9.18 | 0.257 |
| RHR (beats/min) | 77.26 ± 11.44 | 81.58 ± 12.19 | 0.003 | 79.19 ± 12.18 | 79.18 ± 11.83 | 0.995 |
| BMI (kg/m2) | 26.17 ± 4.88 | 26.87 ± 4.87 | 0.235 | 26.21 ± 5.16 | 26.66 ± 4.69 | 0.448 |
| WC (cm) | 86.75 ± 11.78 | 88.28 ± 11.16 | 0.272 | 87.19 ± 11.96 | 87.60 ± 11.23 | 0.773 |
| HC (cm) | 95.94 ± 9.83 | 97.65 ± 9.48 | 0.143 | 96.19 ± 10.21 | 97.05 ± 9.33 | 0.466 |
| WHR | 0.90 ± 0.06 | 0.90 ± 0.06 | 0.972 | 0.91 ± 0.06 | 0.90 ± 0.06 | 0.607 |
| TC (mmol/L) | 4.70 ± 1.00 | 5.06 ± 1.03 | 0.004 | 4.88 ± 1.13 | 4.85 ± 0.95 | 0.812 |
| LDL-C (mmol/L) | 2.75 ± 0.81 | 3.06 ± 0.86 | 0.002 | 2.87 ± 0.89 | 2.90 ± 0.82 | 0.724 |
| HDL-C (mmol/L) | 1.27 ± 0.34 | 1.28 ± 0.33 | 0.824 | 1.28 ± 0.35 | 1.26 ± 0.32 | 0.609 |
| TG (mmol/L) | 1.33 (0.41, 4.46) | 1.33 (0.47, 3.99) | 0.740* | 1.40 (0.41, 4.46) | 1.29 (0.44, 3.53) | 0.608* |
| TG/HDL-C ratio | 1.03 (0.29, 8.62) | 1.07 (0.22, 5.31) | 0.939* | 1.07 (0.30, 8.62) | 1.05 (0.22, 6.90) | 0.917* |
| ICAM1 mRNA expression | 1.05 (0.15, 9.97) | 1.84 (0.14, 9.94) | <0.001* | 1.14 (0.14, 9.97) | 1.46 (0, 9.92) | 0.302* |
Notes:
P values calculated using Student’s t test (continuous variables with normal distribution, the data represent as mean ± S.D.).
Relationships between ICAM1 rs5498 polymorphism, HCL, and other ASCVD risk factors
According to the NCEP ATP III and previous studies, there are multiple ASCVD risk factors related to HCL, including overweight/obesity, dyslipidemia, high ICAM1 mRNA expression, and ICAM1 SNPs. Therefore, we assessed the ASCVD risk factors according to the genetic dominant model in participants with HCL with the G allele (variants, AG+GG) and in those without the G allele (reference allele, AA) (Fig. 2). We found that the mean RHR of participants with HCL and the AG or GG genotype was significantly higher than that of controls with the AA genotype (P = 0.002). In addition, the BMI of participants with HCL and controls with the AG or GG genotype was higher than that of participants with HCL and controls with the AA genotype (P = 0.042 for trend). There were also significant differences in lipid profile: participants with the AG or GG genotypes had significantly higher TC, LDL-C, and TG/HDL ratio than in controls with any of the genotypes (P < 0.001). The TG concentration in participants with AG or GG was higher than in controls with any genotype or in participants with HCL and the AA genotype (P < 0.001). Considering, individual HCL group, the TG concentration in participants with AG or GG was higher than in HCL participants with an AA genotype (P = 0.004). Furthermore, we found higher expression of ICAM1 mRNA in HCL participants with AG or GG genotypes than in control group with an AA genotype (P = 0.013). However, there were no differences in HDL-C concentrations among the groups. These results imply that individuals carrying the G allele of rs5498, whether hypercholesterolemic or normocholesterolemic, have a higher risk of ASCVD. In contrast, participants carrying the rs281432 variants did not show this association.
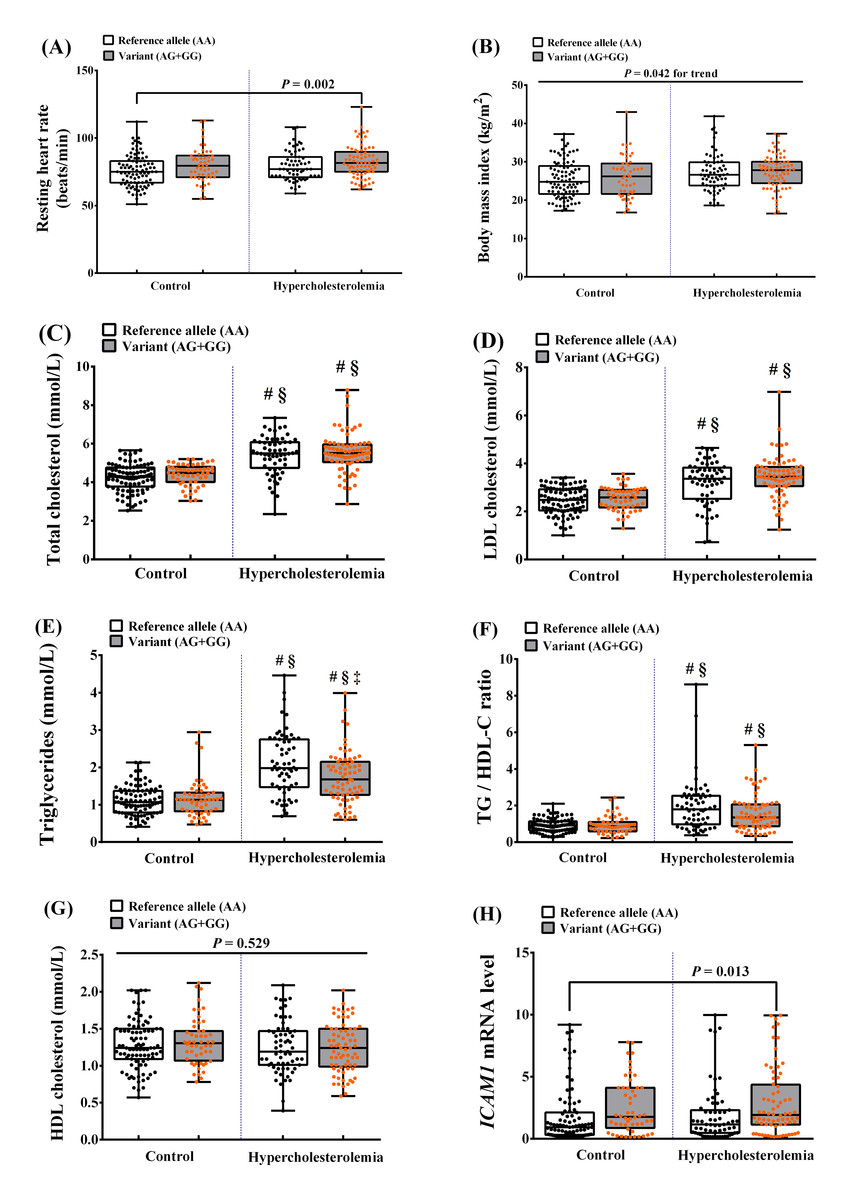
Figure 2: Relationships between the ICAM1rs5498 polymorphism genotype in the dominant model and ASCVD risk factors.
Control (reference allele AA, n = 91; variant AG + GG, n = 52) and HCL (reference allele AA, n = 63; variant AG + GG, n = 72) groups. P values were calculated using a one-way analysis of variance (ANOVA), followed by a post-hoc analysis to detect statistical difference among groups for normal distribution data. Meanwhile, P values for non-normal distribution data were tested using Kruskal-Wallis test, followed by Mann–Whitney U test to detect statistical difference among groups. (A) Resting heart rate (RHR), P = 0.002 vs. control (AA). (B) Body mass index (BMI), P = 0.042 for trend. (C) Total cholesterol (TC), #P < 0.001 vs. control (AA), §P < 0.001 vs. control (AG + GG). (D) LDL cholesterol (LDL-C), #P < 0.001 vs. control (AA), §P < 0.001 vs. control (AG + GG). (E) Triglycerides (TG), #P < 0.001 vs. control (AA), §P < 0.001 vs. control (AG + GG), †P = 0.004 vs. HCL (AA). (F) TG/HDL-C ratio, #P < 0.001 vs. control (AA), §P < 0.001 vs. control (AG + GG). (G) HDL cholesterol (HDL-C), P = 0.529. (H) ICAM1 mRNA expression, P = 0.013 vs. control (AA).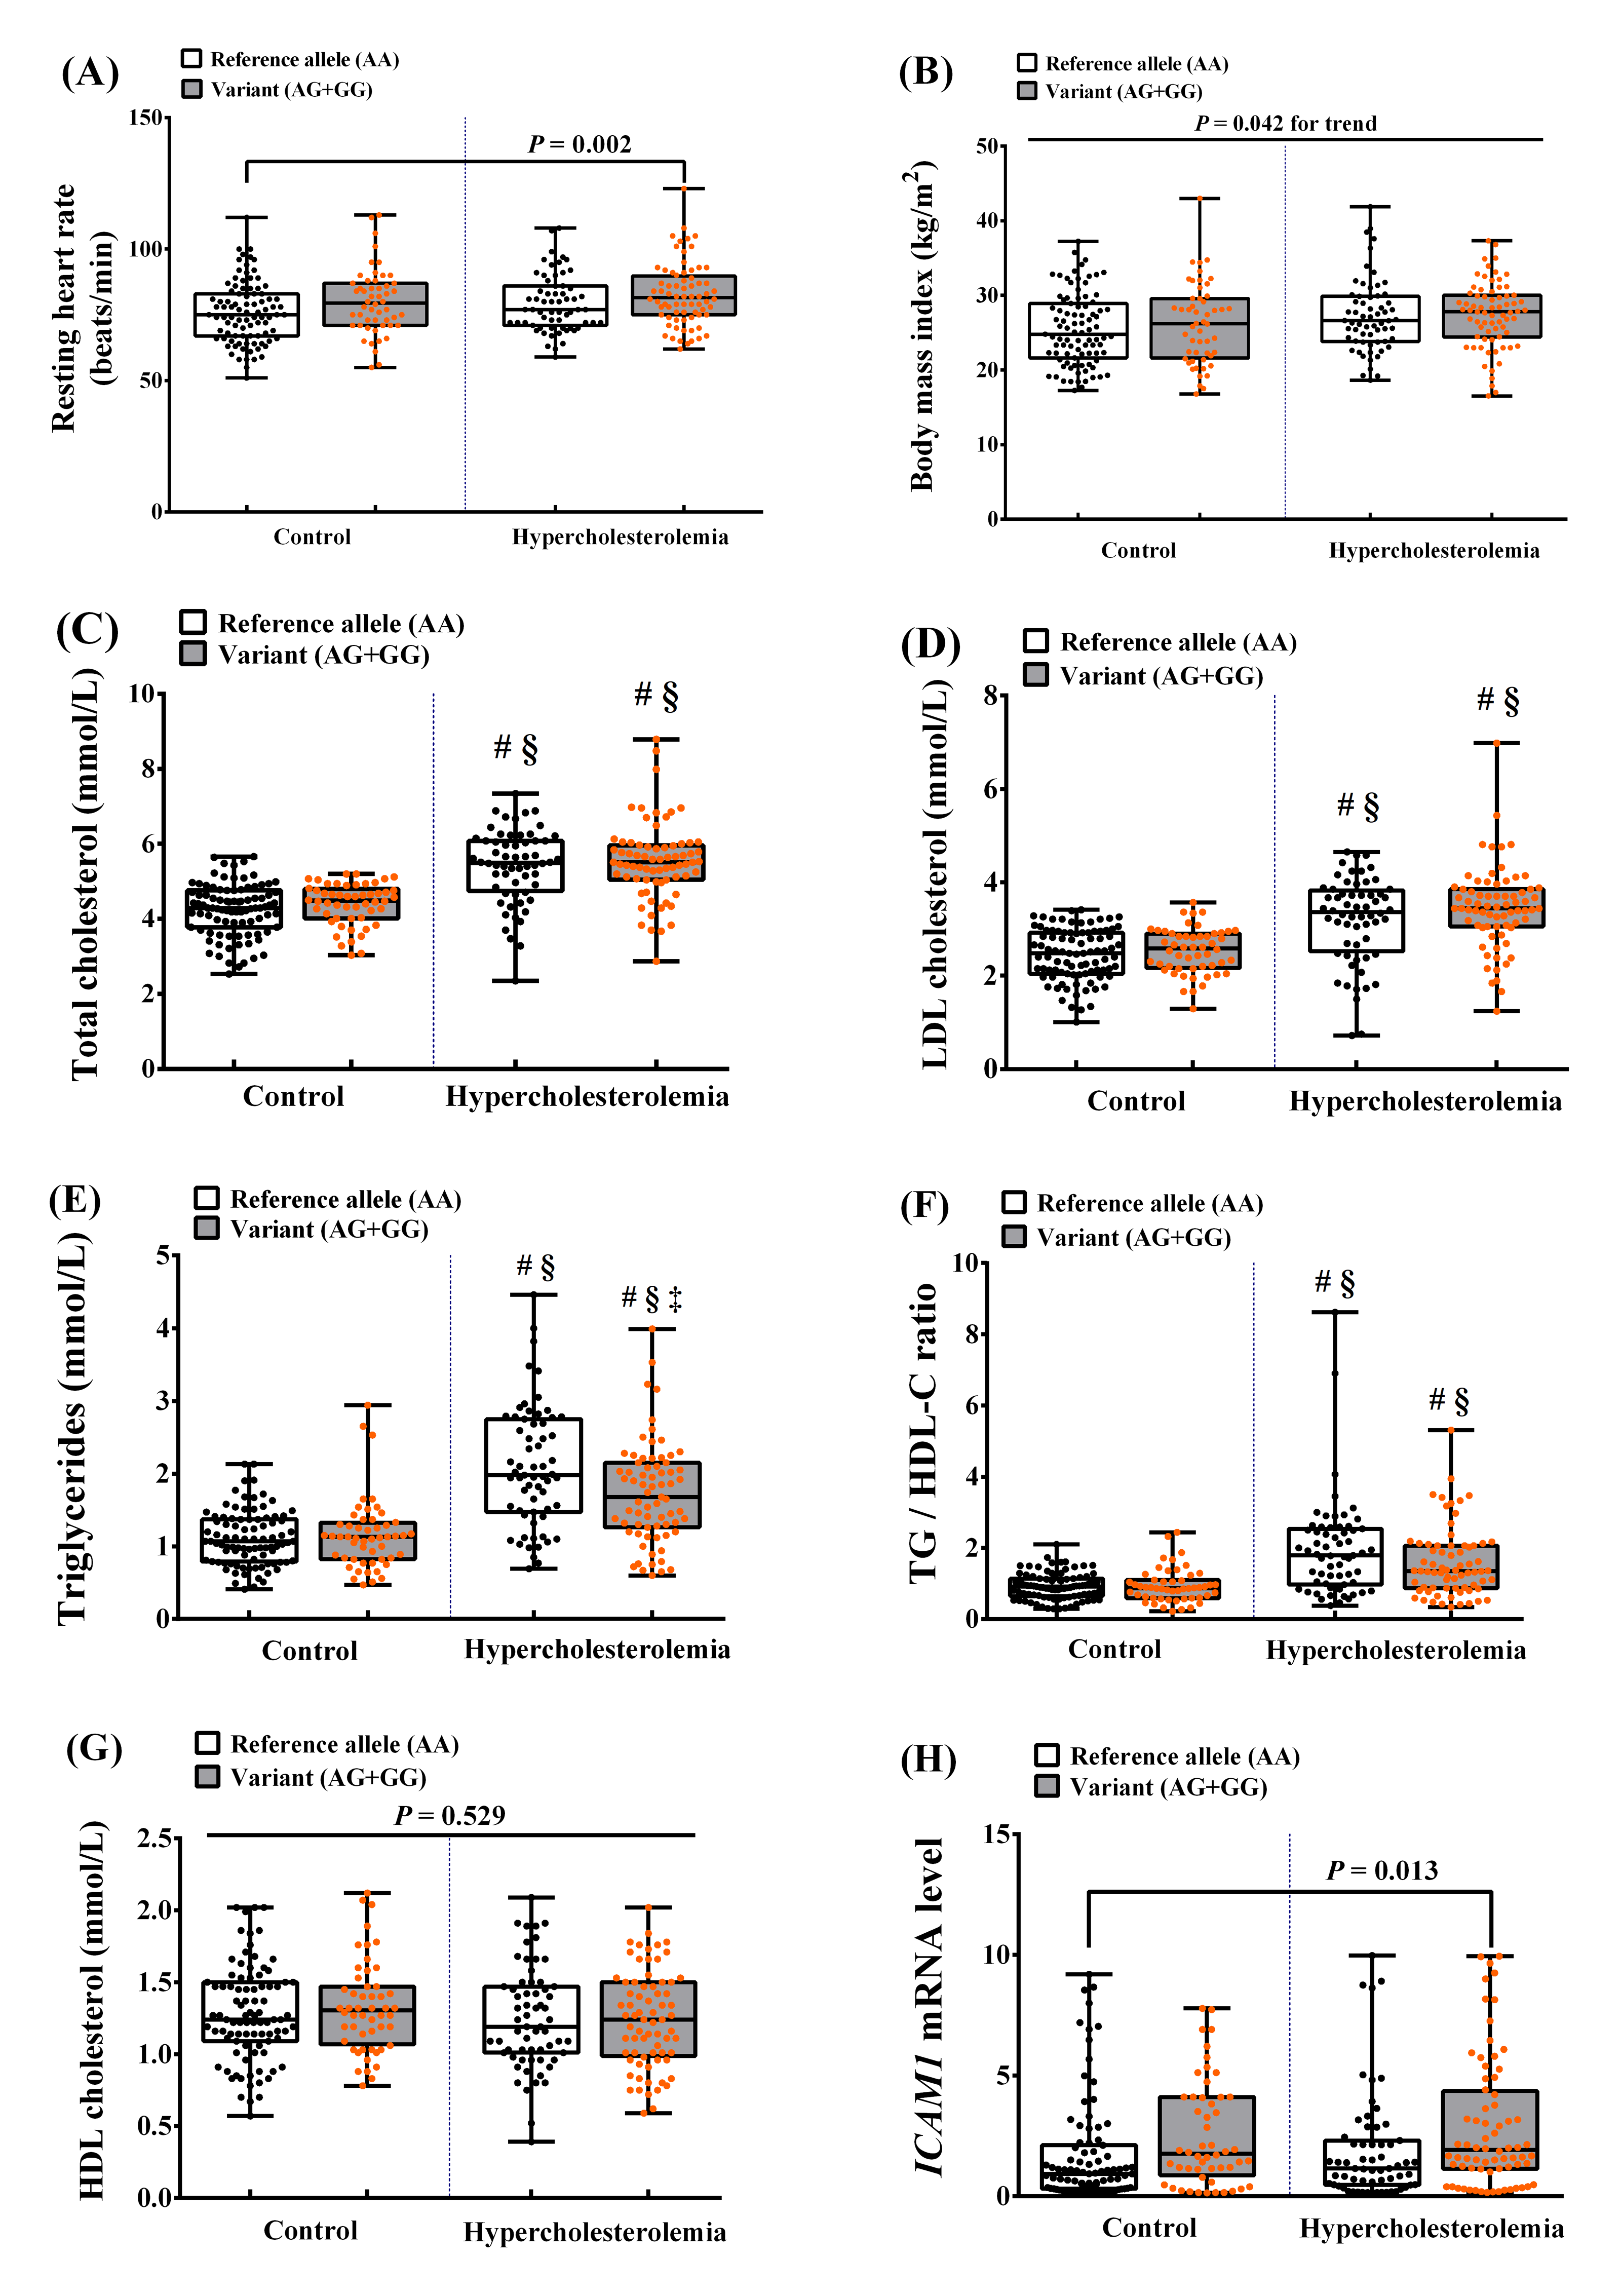
The effect of the interaction of the ICAM1rs5498 polymorphism and ASCVD risk factors
The combined impacts of ICAM1 genotype and specific ASCVD risk factors were determined. In the participants, values above the 75th percentile for RHR (≥86 beats/min) or tachycardia (>100 beats/min), abnormal lipid profile (borderline high values for each parameter), and values above the 75th percentile for ICAM1 mRNA expression (≥3.12 arbitrary units) were defined as confering a high risk of ASCVD. Participants with the rs5498 AG+GG genotype and a high serum LDL-C concentration (≥3.36 mmol/L) were at higher risk of ASCVD (OR = 2.09, 95% CI [1.19–3.66], P = 0.010) than those with a low serum LDL-C concentration (Table 4). There was also a 2.49-fold higher ASCVD risk (95% CI [1.42–4.38], P = 0.001) in participants with an ICAM1 mRNA expression level of ≥ 3.12 than in those with an ICAM1 mRNA expression level of <3.12 (Table 5). Furthermore, we found a robust interaction between the ICAM1 rs5498 polymorphism and high RHR. The presence of the rs5498 variant (AG+GG) and RHR above the 75th percentile or tachycardia increased the trend risk of ASCVD (OR = 1.58, 95% CI [0.91–2.74], P = 0.101, and OR = 5.02, 95% CI [1.35–18.63], P = 0.016, respectively) over that associated with a lower RHR (Table 4). This finding suggests that the higher the RHR, the higher the risk of developing ASCVD. All the ORs quoted were adjusted for age, gender, BMI, smoking status, alcohol consumption status, and exercise habits (Tables 4 and 5). However, we did not identify any significant interactions between the ICAM1 rs281432 polymorphism and ASCVD risk factors (Table S1).
| Variables | ASCVD risk factors | P value | ORa (95% CI) | Pa value | ORb (95% CI) | Pb value | |
|---|---|---|---|---|---|---|---|
| Low-risk | High-risk | ||||||
| 75th percentile RHR (beats/min), n (%) | <86 (n = 203) | ≥ 86 (n = 75) | |||||
| ICAM1rs5498 (A >G) | |||||||
| AA | 120 (59.1) | 34 (45.3) | (Reference) | (Reference) | |||
| AG + GG | 83 (40.9) | 41 (54.7) | 0.040 | 1.74 (1.02–2.97) | 0.041 | 1.58 (0.91–2.74) | 0.101 |
| Tachycardia at RHR (beats/min), n (%) | ≤ 100 (n = 263) | >100 (n = 15) | |||||
| ICAM1rs5498 (A >G) | |||||||
| AA | 151 (57.4) | 3 (20.0) | (Reference) | (Reference) | |||
| AG + GG | 112 (42.6) | 12 (80.0) | 0.005 | 5.40 (1.49–19.56) | 0.010 | 5.02 (1.35–18.63) | 0.016 |
| BP (mmHg), n (%) | ≤ 130 and/or 85 (n = 221) | >130 and/or 85 (n = 57) | |||||
| ICAM1rs5498 (A >G) | |||||||
| AA | 126 (57.0) | 28 (49.1) | (Reference) | (Reference) | |||
| AG + GG | 95 (43.0) | 29 (50.9) | 0.285 | 1.37 (0.77–2.46) | 0.286 | 1.31 (0.71–2.41) | 0.390 |
| TC (mmol/L), n (%) | <5.17 (n = 183) | ≥ 5.17 (n = 95) | |||||
| ICAM1rs5498 (A >G) | |||||||
| AA | 108 (59.0) | 46 (48.4) | (Reference) | (Reference) | |||
| AG + GG | 75 (41.0) | 49 (51.6) | 0.092 | 1.59 (0.96–2.63) | 0.071 | 1.60 (0.96–2.69) | 0.073 |
| LDL-C (mmol/L), n (%) | <3.36 (n = 205) | ≥ 3.36 (n = 73) | |||||
| ICAM1rs5498 (A >G) | |||||||
| AA | 122 (59.5) | 32 (43.8) | (Reference) | (Reference) | |||
| AG + GG | 83 (40.5) | 41 (56.2) | 0.021 | 1.99 (1.15–3.44) | 0.014 | 2.09 (1.19–3.66) | 0.010 |
| HDL-C (mmol/L), n (%) | >1.29 (women) >1.04 (men) (n = 149) | ≤ 1.29 (women) ≤ 1.04 (men) (n = 129) | |||||
| ICAM1rs5498 (A >G) | |||||||
| AA | 83 (55.7) | 71 (55.0) | (Reference) | (Reference) | |||
| AG + GG | 66 (44.3) | 58 (45.0) | 0.911 | 1.03 (0.64–1.65) | 0.911 | 1.04 (0.63–1.70) | 0.886 |
| TG (mmol/L), n (%) | <1.69 (n = 191) | ≥ 1.69 (n = 87) | |||||
| ICAM1rs5498 (A >G) | |||||||
| AA | 106 (55.5) | 48 (55.2) | (Reference) | (Reference) | |||
| AG + GG | 85 (44.5) | 39 (44.8) | 0.960 | 1.01 (0.61–1.69) | 0.960 | 1.02 (0.59–1.75) | 0.943 |
| TG/HDL-C (mmol/L), n (%) | <1.75 (n = 214) | ≥ 1.75 (n = 64) | |||||
| ICAM1rs5498 (A >G) | |||||||
| AA | 119 (55.6) | 35 (54.7) | (Reference) | (Reference) | |||
| AG + GG | 95 (44.4) | 29 (45.3) | 0.897 | 1.04 (0.59–1.82) | 0.897 | 0.98 (0.55–1.75) | 0.936 |
Notes:
- ASCVD
-
Atherosclerotic cardiovascular disease
P value calculated using the χ2 test. ORa Unadjusted. ORb Adjusted for age, gender, BMI, smoking status, alcohol consumption status, and exercise habits. Pa value associated with odds ratio (OR)a. Pb value associated with ORb. P value < 0.05 was considered statistically significant.
| Variables | ASCVD risk factors | P value | ORa (95% CI) | Pa value | ORb (95% CI) | Pb value | |
|---|---|---|---|---|---|---|---|
| Low-risk | High-risk | ||||||
| 75th percentile (arbitrary units) ICAM1 mRNA expression, n (%) | <3.12 (n = 206) | ≥ 3.12 (n = 72) | |||||
| ICAM1rs5498 (A >G) | |||||||
| AA | 127 (61.7) | 27 (37.5) | (Reference) | (Reference) | |||
| AG + GG | 79 (38.3) | 45 (62.5) | <0.001 | 2.68 (1.54–4.66) | <0.001 | 2.49 (1.42–4.38) | 0.001 |
| ICAM1rs281432 (C >G) | |||||||
| CC | 88 (42.7) | 26 (36.1) | (Reference) | (Reference) | |||
| CG +GG | 118 (57.3) | 46 (63.9) | 0.326 | 1.32 (0.76–2.30) | 0.327 | 1.38 (0.78–2.44) | 0.266 |
Notes:
- ASCVD
-
Atherosclerotic cardiovascular disease
P value calculated using the χ2 test. ORa Unadjusted. ORb Adjusted for age, gender, BMI, smoking status, alcohol consumption status, and exercise habits. Pa value associated with odds ratio (OR)a. Pb value associated with ORb. P value <0.05 was considered statistically significant.
Discussion
In the present cross-sectional study we investigated the relationships between the ICAM1 rs5498 polymorphism and modifiable and non-modifiable risk factors for ASCVD. First, we found a significant association between the rs5498 dominant model and HCL in a sample of adult Thai people. Second, rs5498 variants were associated with multiple risk factors for ASCVD: RHR, TC, LDL-C, and ICAM1 mRNA expression. Third, participants with HCL and an rs5498 variant had higher RHR, BMI, TC, LDL-C, TG, TG/HDL-C ratio, and ICAM1 mRNA expression. Finally, participants with an rs5498 variant had a higher RHR, higher serum LDL-C concentration, and higher expression of ICAM1 mRNA than those with the reference allele AA genotype. These results indicate that in Thai adults variation at the ICAM1 rs5498 locus may associated with HCL and high RHR, which are risk factors for ASCVD, and this is consistent with the findings of previous studies conducted in other populations (Iwao, Morisaki & Morisaki, 2004; Sarecka-Hujar, Zak & Krauze, 2009).
The pathogenesis of ASCVD is considered to be multifactorial, involving oxidative stress and an upregulation of CAMs expression, induced by proinflammatory cytokines, including interleukin (IL)-6, tumor necrosis factor (TNF)- α, and IL-1 β, all of which are consequences of overweight/obesity, HCL, and related risk factors, including smoking and alcohol consumption (Boehme, Esenwa & Elkind, 2017; Nepal, Yadav & Kong, 2019). The accumulation of lipids, especially LDL-C, is thought to initiate oxidative stress, and oxidized LDL and macrophage recruitment amplify the inflammation, resulting in endothelial dysfunction in arterial walls (Klop, Elte & Castro Cabezas, 2013; (Linton et al., 2019). High expression of ICAM1 is a result of the chronic inflammation of the arteries and leads to the migration of leukocytes into the intima (Herbert Haught et al., 1996). The common polymorphism at rs5498 in exon 6 of the ICAM1 gene results in the substitution of glutamate for lysine (K469E) in the immunoglobulin-like domain 5 of the ICAM-1 protein, which is the result of an A-to-G substitution (Liu, Wu & Liu, 2013). This polymorphism has also been suggested to affect mRNA splicing patterns, with effects on cell–cell interactions and the inflammatory response (Fig. 3) (Iwao, Morisaki & Morisaki, 2004; Sarecka-Hujar, Zak & Krauze, 2009). These changes have been shown to be involved in the etiology of ASCVD (Gaetani et al., 2002).
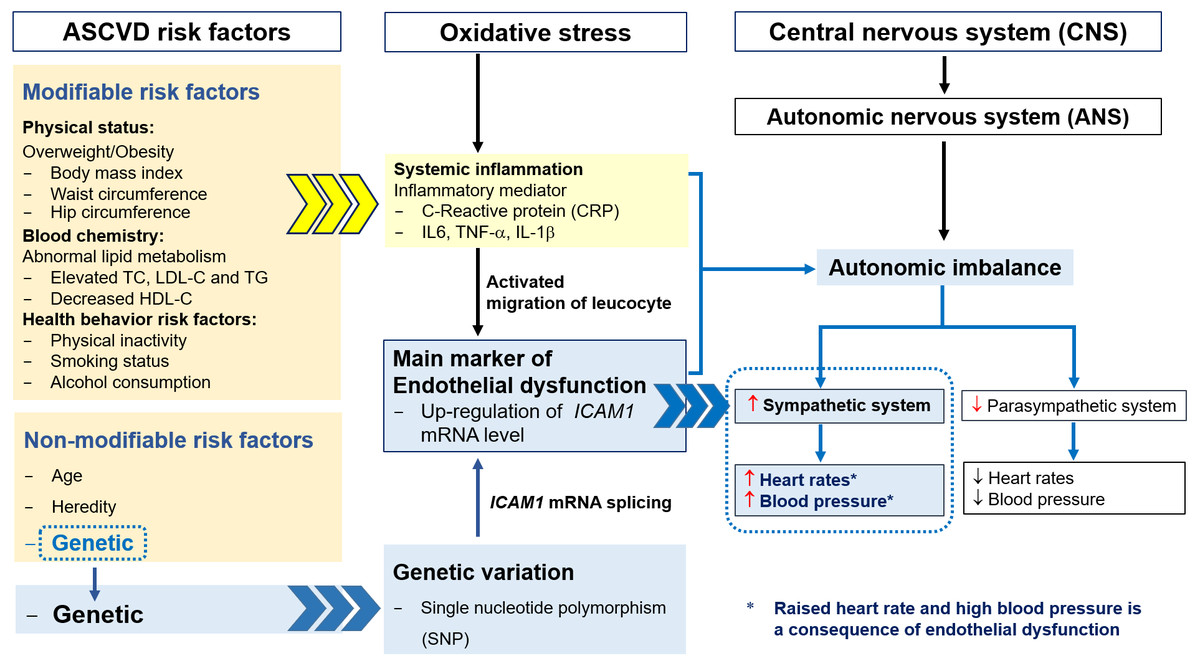
Figure 3: The relationships among ASCVD risk factors, oxidative stress, endothelial dysfunction, autonomic imbalance and genetic variation.
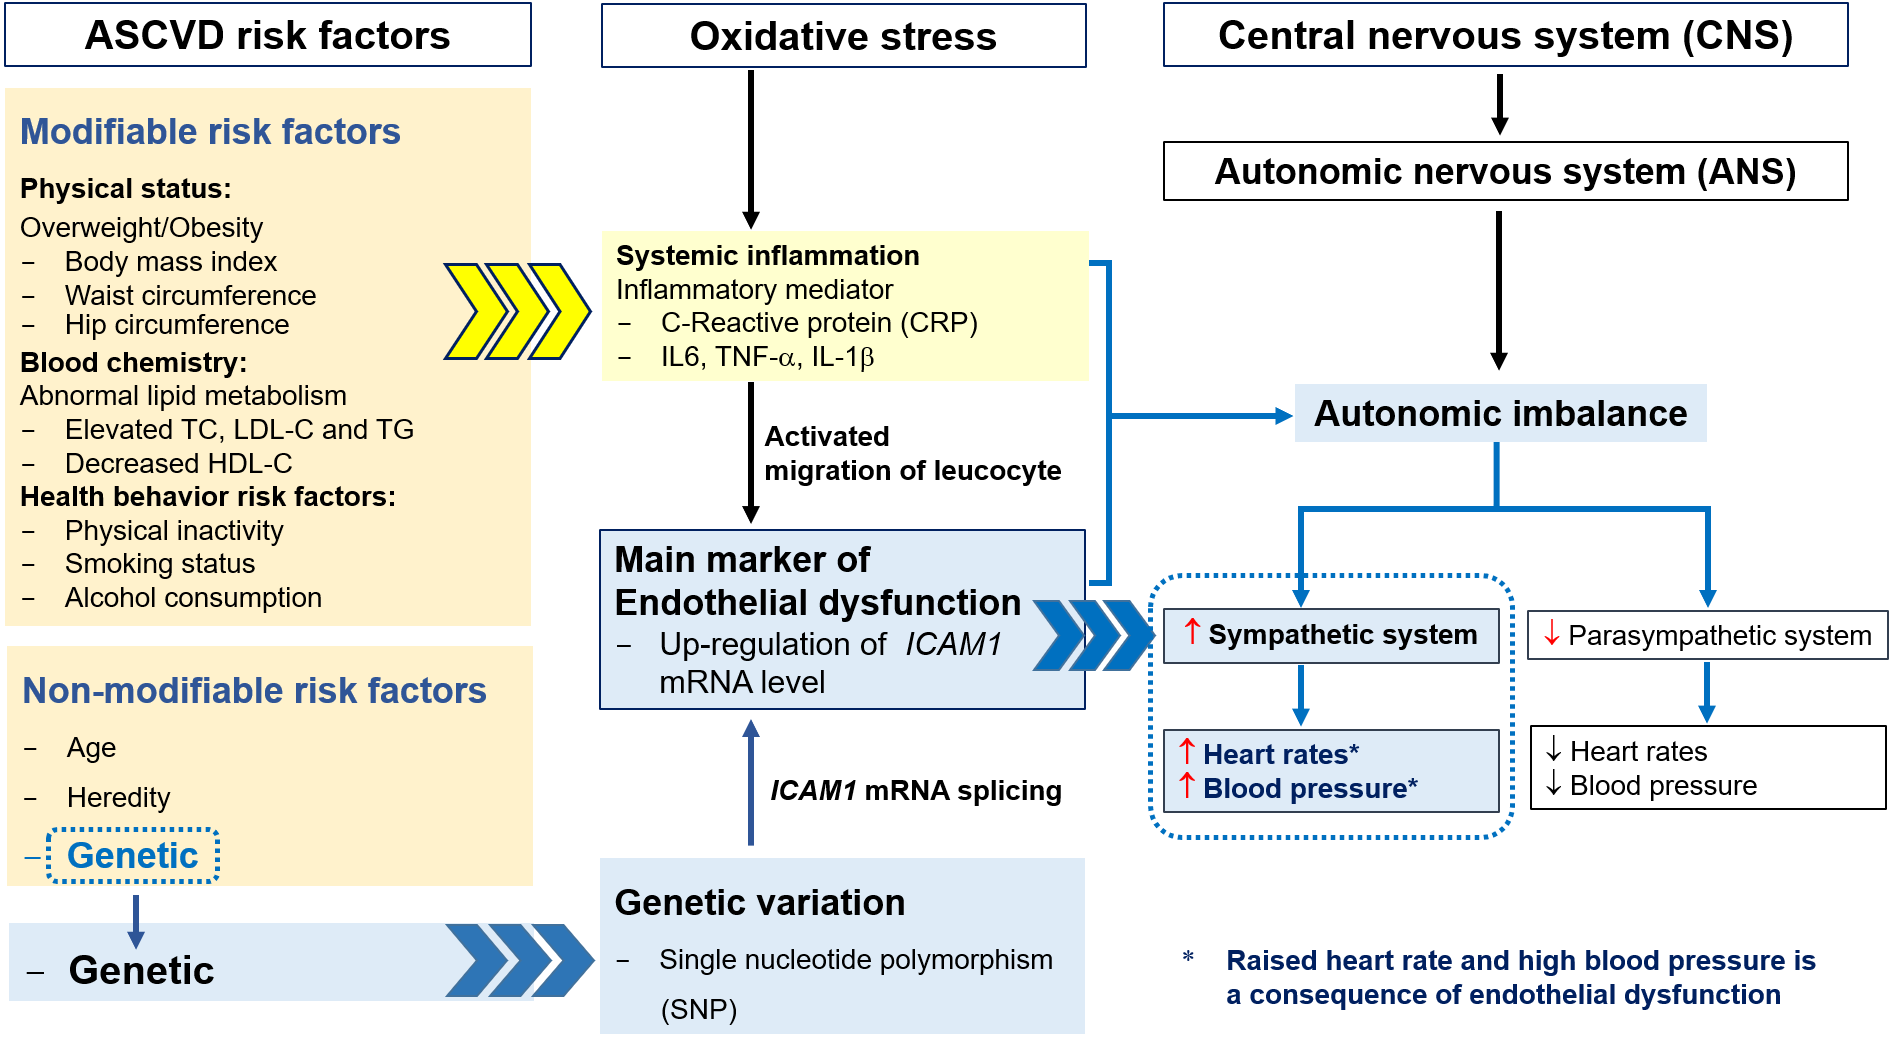
A previous study by Sarecka-Hujar, Zak & Krauze (2009) showed that individuals possessing the AG or GG genotypes at ICAM1 rs5498 tended to have higher TC and LDL-C concentrations than those possessing the AA genotype, and were therefore at higher risk of developing coronary artery disease. This is consistent with the present finding of significant positive relationships between the rs5498 variant and high serum TC and LDL-C concentrations. In addition, we identified associations with other risk factors (BMI, TG, and TG/HDL-C ratio), all of which were high in participants with HCL who were carrying the rs5498 variant. Therefore, we conclude that the rs5498 variant predisposes toward HCL, which may progress to ASCVD.
As mentioned above, high expression of ICAM1 is a vascular biomarker of endothelial dysfunction. The genetic variants of ICAM1 affect its expression and promote the development of ASCVD, as shown by numerous studies. In addition, Iwao et al. found that these variants affect RNA splicing: cells with the GG genotype express less ICAM-1-S mRNA than those with an AA genotype, and the authors suggested that the g.1548G>A (E469K) polymorphism modifies inflammatory responses by altering cell–cell interactions and regulating apoptosis (Iwao, Morisaki & Morisaki, 2004). Similarly, in the present study, we found a significant association between the rs5498 polymorphism and high expression of ICAM1 mRNA. Therefore, a combination of HCL with the rs5498 variants may promote the development of ASCVD by increasing ICAM1 expression.
The autonomic nervous system regulates homeostasis and consists of two major branches: the sympathetic and the parasympathetic nervous systems. Autonomic imbalance can result from oxidative stress, systemic inflammation, endothelial dysfunction, and genetic variation, with HCL having an codominant effect to these defects (Custodis et al., 2010; Nanchen et al., 2013a; Nanchen et al., 2013b). The imbalance in the autonomic nervous system is characterized by hyperactivity of the sympathetic system and hypoactivity of the parasympathetic system, which results in high RHR and blood pressure and vascular dysfunction (Fig. 3). High RHR is considered to be a risk factor for heart disease, and can reflect several types of arrhythmia, such as supraventricular tachycardia, atrial fibrillation, sinus tachycardia, and ventricular tachycardia (Al-Khatib et al., 2018; Böhm et al., 2015; Page et al., 2016).
Thayer, Yamamoto & Brosschot (2010) suggested that such autonomic imbalance might be the final common pathway linking health conditions, including CVD. Therefore, a change in lifestyle that ameliorates biological risk factors and reduces this autonomic imbalance may reduce the risk of vascular disease (Christensen et al., 1999; Karason et al., 1999; Kupari et al., 1993; Schroeder et al., 2003; Thayer, Yamamoto & Brosschot, 2010). Böhm et al. (2015) also suggested that heart rate is associated with cardiovascular outcomes and other conditions, including endothelial dysfunction. In addition, Nanchen et al. reported an association between RHR and incident heart failure in a population-based cohort study of healthy adults without pre-existing overt heart disease. They suggested that the risk of heart failure increases in men with each increment of 10 beats per minute in RHR (Nanchen et al., 2013a; Nanchen et al., 2013b). Likewise, we have shown an association between other ASCVD risk factors and a high RHR: after adjusted confounding factor, the rs5498 variant was associated with a 1.58-fold higher risk of ASCVD than reference allele when RHR was ≥ 86 beats/min. Furthermore, the ICAM1 rs5498 variant was associated with a 5.02-fold higher risk in the presence of tachycardia (≥100 beats/min). This is consistent with systemic inflammation, oxidative stress, and endothelial dysfunction worsening in individuals with HCL and the ICAM1 variant as heart rate rises. However, we did not identify an association between rs281432 (C>G) and HCL. In contrast, and similar to the present findings, Yang et al. (2014) found no significant difference in the prevalences of the rs281432 genotypes in patients with or without coronary atherosclerosis.
The strengths of the present study were that we studied the effect of key genetic variants in a population with the same race, age group, lifestyle, and environment. The sequencing technique we used was able to precisely identify the SNPs. Moreover, we were able to confirm the association between ICAM1 expression and endothelial dysfunction in ASCVD. However, the cross-sectional design was a limitation, such that we could not show a cause-and-effect relationship between the ICAM1 rs5498 polymorphism, HCL, and ASCVD.
Conclusions
We have shown relationships between the ICAM1 rs5498 polymorphism and HCL and the related ASCVD risk factors in Thai adults. The underlying mechanisms for this association will involve interactions between abnormal lipid profile, oxidative stress, inflammatory infiltration, and circulating cell adhesion molecules. Although previous studies have indicated that the identification of the ICAM1 gene variant might be predictive of atherosclerosis in CVD patients, here we show that the variant may predict HCL and therefore may be used in the prevention of ASCVD.
Supplemental Information
The effect of the interaction of the ICAM1 rs281432 polymorphism and ASCVD risk factors
Abbreviation: ASCVD, Atherosclerotic cardiovascular disease. P value calculated using the χ2 test. ORa Unadjusted. ORb Adjusted for age, gender, BMI, smoking status, alcohol consumption status, and exercise habits. Pa value associated with odds ratio (OR)a. Pb value associated with ORb. P value <0.05 was considered statistically significant.