
Genome-wide identification of alcohol dehydrogenase (ADH) gene family under waterlogging stress in wheat (Triticum aestivum)
- Published
- Accepted
- Received
- Academic Editor
- Gerard Lazo
- Subject Areas
- Bioinformatics, Genomics, Molecular Biology, Plant Science
- Keywords
- Alcohol dehydrogenase, Triticum aestivum, Expression patterns, Waterlogging stress
- Copyright
- © 2021 Shen et al.
- Licence
- This is an open access article distributed under the terms of the Creative Commons Attribution License, which permits unrestricted use, distribution, reproduction and adaptation in any medium and for any purpose provided that it is properly attributed. For attribution, the original author(s), title, publication source (PeerJ) and either DOI or URL of the article must be cited.
- Cite this article
- 2021. Genome-wide identification of alcohol dehydrogenase (ADH) gene family under waterlogging stress in wheat (Triticum aestivum) PeerJ 9:e11861 https://doi.org/10.7717/peerj.11861
Abstract
Background
Alcohol dehydrogenase (ADH) plays an important role in plant survival under anaerobic conditions. Although some research about ADH in many plants have been carried out, the bioinformatics analysis of the ADH gene family from Triticum aestivum and their response to abiotic stress is unclear.
Methods
A total of 22 ADH genes were identified from the wheat genome, and these genes could be divided into two subfamilies (subfamily I and subfamily II). All TaADH genes belonged to the Medium-chain ADH subfamily. Sequence alignment analysis showed that all TaADH proteins contained a conservative GroES-like domain and Zinc-binding domain. A total of 64 duplicated gene pairs were found, and the Ka/Ks value of these gene pairs was less than 1, which indicated that these genes were relatively conservative and did not change greatly in the process of duplication.
Results
The organizational analysis showed that nine TaADH genes were highly expressed in all organs, and the rest of TaADH genes had tissue specificity. Cis-acting element analysis showed that almost all of the TaADH genes contained an anaerobic response element. The expression levels of ADH gene in waterlogging tolerant and waterlogging sensitive wheat seeds were analyzed by quantitative real-time PCR (qRT-PCR). This showed that some key ADH genes were significantly responsive to waterlogging stress at the seed germination stage, and the response of waterlogging tolerant and waterlogging sensitive wheat seeds to waterlogging stress was regulated by different ADH genes. The results may be helpful to further study the function of TaADH genes and to determine the candidate gene for wheat stress resistance breeding.
Introduction
Alcohol dehydrogenase (ADH, EC1.1.1.1) is a zinc-binding enzyme that relies on NAD (P) cofactors to participate in the conversion between ethanol and acetaldehyde (Höög et al., 2003; Thompson et al., 2007). The ADH gene family is a large family, which is mainly divided into three subfamilies: short-chain dehydrogenase/reductase (SDR)-ADH (containing about 250 amino acid residues), medium-chain dehydrogenase/reductase (MDR)-ADH (containing about 350 amino acid residues) and long-chain dehydrogenase/reductase (LDR)-ADH (600~750 amino acid residues or about 385~900 amino acid residues) (Alka et al., 2013). (MDR)-ADH occupies a high proportion in the ADH gene family and usually contains zinc ligand in its activation site (Iaria et al., 2012; Min et al., 2012; Cheng et al., 2013). The (SDR)-ADH gene lacks zinc-liganding cysteine residues in their coenzyme binding regions (Kim et al., 2009; Strommer, 2011; Moummou et al., 2012) and the (LDR)-ADH gene has not been found in plants. ADH proteins usually contain the GroES-like domain (35~164 amino acids) and the zinc-binding domain (206~340 amino acids) (Murzin, 1996; Bhupesh & Mande, 1999).
ADH has been widely studied in human, animal, yeast and bacteria (Khan et al., 2010; Kumar et al., 2012; Çelik & Aktas, 2013; Jönvall et al., 2013; Plapp et al., 2013; Quaglia et al., 2013; Alka et al., 2013). Some reports have also been reported in plants (Jin et al., 2016; Zeng et al., 2020) and most plant ADH genes belong to (MDR)-ADH (Stephen & Klee, 2006). We found that ADH family genes from plants were usually involved in aroma synthesis during fruit development and were closely related to the formation of alcohols during fruit ripening (Van Der Straeten et al., 1991; Speirs et al., 1998; Echeverria et al., 2004; Moummou et al., 2012; Xu et al., 2014; Jin et al., 2016; Qin et al., 2017; Zeng et al., 2020). For instance, RNA-Seq and quantitative real-time PCR (qRT-PCR) analysis showed that the expression levels of 3 ADH genes (Pbr013912.1, Pbr026289.1 and Pbr01252.1) in white pear were closely related to the content of aromatic compounds during fruit development (Zeng et al., 2020). ADH was also involved in the response to hormones. The cis-acting elements of the CmADH gene from Pyrus bretschneideri showed that CmADH genes were involved in roles of hormone regulation (Jin et al., 2016). The qRT-PCR analysis also showed that some CmADH genes had different response patterns to ABA, IAA and ethylene (Jin et al., 2016).
Since ADH activity is considered a necessary condition for plant survival under anaerobic conditions, the response of plant ADH gene to anaerobic stress has always been the research focus (Harberd, 1982; Liskens, 1966; Bailey-Serres & Voesenek, 2008). The transcriptional levels of ADH1 and ADH2 from Zea mays increased rapidly under hypoxia conditions at 6 h, but followed by a rapid decline at 12–18 h (Andrews, Cobb & Johnson, 1993). In Arabidopsis thaliana, the AtADH gene was continuously expressed in the root (including lateral roots) when the seedlings grew on the plate, but not in the shoot, which was similar to the expression pattern of ADH1 in Zea mays (Zhang et al., 2010). Three ADH genes (HvADH-1, HvADH-2, and HvADH-3) in barley were significantly induced under anaerobic stress, and their activities were very high (Gonçalves et al., 2018). Studies on rice (Minhas, 1999), cucumber (Qi et al., 2012) and grape (Tesniere et al., 2006) also showed that plants could induce the expression of ADHs under hypoxia stress. Borrego-Benjumea et al. (2020) recently found the most significant changes in Gene Ontology (GO) terms, resulting from these differentially expressed genes (DEGs) observed under waterlogging stress in barley, were associated with the “hydrogen peroxide metabolic process”, “oxidation-reduction process” and “response to oxidative stress”.
Wheat is an important food crop widely planted globally, and its harvest area ranks first among the three major food crops (rice, wheat and maize). China is the world’s largest wheat producer and consumer; it is of great significance to China’s food security and increasing farmers’ income. According to the World Food and Agriculture Organization (FAO), about 10% of the world’s land area is affected by different degrees of waterlogging (Li et al., 2011). Wheat often encounters continuous rainy days during planting. Besides, uneven terrain or poor farmland drainage systems leads to stagnant water in the soil, which often leads to a lack of oxygen in seeds and roots, resulting in reduced wheat yield (Kırmızı & Bell, 2012). In the Mediterranean region, because about 40% of the annual rainfall occurs during the sowing period of winter wheat, the germination and growth stages of winter wheat are often affected by waterlogging (Bassu et al., 2009). Wheat-growing areas in south-central China also face the same problem (Arduini et al., 2016). It has been reported that ADH has high activity under anoxic conditions, and it mainly plays a role in converting acetaldehyde into alcohol in the last step of glycolysis or fermentation under anoxic conditions (Hageman & Flesher, 1960). At present, there are no systematic reports on the identification, structural characteristics, evolutionary relationship and response to waterlogging stress of ADH family genes in wheat. The release of the wheat genome (Appels et al., 2018) provides a basis for the identification and characteristic analysis of wheat ADH family genes. In this study, we identified 22 ADH genes from the wheat genome by bioinformatics methods. At the same time, we analyzed the distribution, physical and chemical characteristics, structural characteristics, gene duplication events and evolutionary relationship with other species of wheat ADH family genes. Additionally, we analyzed the tissue expression pattern of TaADH genes and their response to waterlogging stress. The above information will greatly promote our understanding of the functions of TaADH family genes.
Materials & methods
Identification of ADH gene family in wheat
The wheat genome data was downloaded from the wheat genome database (https://urgi.versailles.inra.fr/download/iwgsc/IWGSC_RefSeq_Assemblies/v1.0/) (Appels et al., 2018). We first used 26 melon ADH family protein sequences as search inquiry sequences and searched melon ADH homologous genes using the local BLAST program (amino acid identity > 70%, E value < 10−10). All melon ADH proteins were derived from the literature of Jin (Jin et al., 2016). Secondly, the ADH domain (PF00107.26, PF08240.12 and PF13602.6) was obtained from the Pfam database (http://pfam.xfam.org/) (Finn et al., 2010). We first used the HMMER3 software package to create the Hidden Markov Model file (Eddy, 2011), and then used HMMsearch with default parameters to search the wheat protein database. All the above candidate proteins were verified by Batch-CDD (https://www.ncbi.nlm.nih.gov/Structure/bwrpsb/bwrpsb.cgi) and SMART (http://smart.embl-heidelberg.de/) (Letunic, Doerks & Bork, 2012), and all proteins without GroES-like domain and zinc-binding domain were deleted.
The number of amino acids,protein molecular weight and isoelectric point of the candidate proteins were calculated by the ExPASy website (https://web.expasy.org/compute_pi/). Plant-mPLoc (http://www.csbio.sjtu.edu.cn/bioinf/plant-multi) (Fang et al., 2020) was used to predict the subcellular location of the TaADH genes.
Evolutionary analysis of TaADH genes
To clarify the evolutionary relationship of ADH protein in wheat and the evolutionary relationship of ADH protein between wheat and several other species, all the ADH protein sequences were aligned by the ClustalW program and then used to constructed the phylogenetic tree by MEGA7.0 (Kumar, Stecher & Tamura, 2016). All the phylogenetic trees were constructed by the neighbour joining (NJ) method, 1000 replicates of bootstrap values, the pairwise deletion option. ADH protein sequences from Arabidopsis thaliana, Cucumis melo, Cucumis sativus, Glycine max, Hordeum vulgare, Lycopersicon esculentum, Oryza sativa and Vitis vinifera were downloaded from the NCBI (National Center for Biotechnology Information) database by using their gene IDs from the Pyrus bretschneideri reference (Jin et al., 2016).
Analysis of structural characteristics of TaADHs
To clarify the structural characteristics of the ADH gene, the intron-exon distribution map of TaADH genes was generated by the Gene Structure Display Server 2.0 (GSDS2.0, http://gsds.gao-lab.org/) (Hu et al., 2015). The generation of the intron-exon distribution map depends on the cDNA sequence and the corresponding genomic DNA sequence of the wheat ADH gene.
To clarify the domain of wheat ADH protein, we used DNAMAN software to carry out the multiple sequence alignment of all TaADH protein sequences. Besides, we used Multiple EM for Motif Elicitation (MEME, http://meme-suite.org/tools/meme) (Bailey et al., 2006) to analyze the motif of TaADH proteins. The program was set according to the following parameters: the optimal width of motif is 650 amino acid residues, and the maximum number of motifs is 15. Finally, the motifs map of TaADH protein were presented by TBtools (https://github.com/CJ-Chen/TBtools) (Chen et al., 2020).
Distribution of TaADHs on chromosomes and gene duplication events
To determine the position of TaADHs on the chromosome, the starting position of TaADHs was extracted from the Chinese Spring wheat genome (https://urgi.versailles.inra.fr/download/iwgsc/IWGSC_RefSeq_Assemblies/v1.0/) and finally presented by TBtools (Chen et al., 2020).
To identify the TaADH gene duplication events, the open reading frame of all TaADHs were BLAST compared with each other by the local BLASTN program (Identity > 80%, e-value < 1e−10). Gene alignment coverage was then acquired using the previously calculated method: gene alignment coverage = (alignment length-mismatch length)/the length of larger genes (Wang et al., 2010). When the gene alignment coverage was more than 0.75, they were considered to be a duplicated gene (Wang et al., 2010). Besides, in the 100 kb region, two duplicated genes separated by other genes were considered as tandem duplicated genes. When the distance between two duplicated genes was more than 100 kb or the duplicated genes were distributed on different chromosomes, they were named as fragment duplicated genes. Non-synonymous substitution rate (Ka), Synonymous substitution rate (Ks) and Ka/Ks were calculated by DnaSP software (http://www.ub.edu/dnasp/) (Rozas et al., 2003). The formula: T = Ks/2λ × 10−6 Mya was used to calculate divergence time (T), λ = 6.5 × 10⁻⁹ represented the rate of divergence of synonymous substitutions per site per year, the unit of evolution time was millions of years (Mya) (Emanuelsson et al., 2000).
Analysis of tissue expression pattern of TaADHs
To analyze the expression pattern of TaADH genes in root, stem, leaf, spike and grain, we downloaded the RNA-seq reads data from Chinese Spring wheat through expVIP (an expression visualization and integration platform) platform (http://www.wheat-expression.com/). Raw data was deposited as DRP000768 and SRP028357 (https://urgi.versailles.inra.fr/files/RNASeqWheat/) on NCBI and were derived from the Chinese Spring (123 non-stressed samples, 15 tissues) (Borrill, Ramirezgonzalez & Uauy, 2016). TPM (transcripts per kilobase of exon model per million mapped reads) values were used as expression units on expVIP software. After obtaining the average TPM expression level of all TaADH genes, the heatmap was drawn with TBtools software (https://github.com/CJ-Chen/TBtools) (Chen et al., 2020).
Cis-acting element analysis of TaADH genes
To analyze the cis-acting element of TaADH genes, the promoter sequences (2,000 bp before the start codon) of all TaADH genes were extracted from the Chinese Spring wheat database. The cis-acting elements of these genes were predicted by online tool PLANTCARE (https://bioinformatics.psb.ugent.be/webtools/plantcare/html/) (Lescot et al., 2002) and visualized by TBtools (https://github.com/CJ-Chen/TBtools) (Chen et al., 2020).
The functional enrichment analysis was performed using g:Profiler (version e102_eg49_p15_7a9b4d6) (https://biit.cs.ut.ee/gprofiler/gost) with g:SCS multiple testing correction method applying significance threshold of 0.05 (Raudvere et al., 2019). The 22 TaADH gene IDs were uploaded into the program, and ‘Triticum aestivum’ was chosen as the reference organism to analyze molecular function, cellular components, and biological processes.
Expression analysis of TaADHs under waterlogging stress
To study the waterlogging tolerance of TaADHs, ‘Zhoumai 22’ (ZM22) and ‘Bainong 607’ (BN607) were used as materials in this study. The materials were cultivated and provided by professor Ou’s team of the School of Life Science and Technology of Henan Institute of Science and Technology.
Experimental group: 50 seeds of each variety were submerged in the 14-cm-diameter glass Petri dish and filled with 200 mL of sterilized deionized water (pH 6.8; electrical conductivity 1.5 μS cm−1), and enveloped in aluminium foil to minimize gas exchange at 20 °C in the dark for 3 days. The seeds were germinated for 24 and 72 h (cultured in a Petri dish containing a layer of filter paper and 10 mL of aseptic deionized water) after waterlogging treatment. Control group: the seeds of each variety germinated normally without waterlogging treatment. All the Petri dishes containing seeds were placed in a growth chamber with 25 °C, 75% relative humidity, 16 h light/8 h dark cycle. The experimental group and the control group were repeated five times. The characteristics of ZM22 and BN607 were identified by phenotypic analysis and bud length measurement between the experimental group and the control group.
To determine the response of TaADH genes to waterlogging, we used the qRT-PCR to determine the expression level of ADHs. The seeds were collected at 24 and 72 h after waterlogging stress (the buds and roots of the seeds were removed), and the RNA was extracted by RNAsimple Total RNAKit (Tiangen, Beijing, China). To avoid the contamination of genomic DNA, RNase-free DNase I (Takara, Tokyo, Japan) was used to remove DNA from the total RNA. The first-strand cDNAs were synthesized using the PrimeScript RT Reagent Kit with gDNA Eraser (Takara, Dalian, China) according to the manufacturer’s protocol. The qRT-PCR assays were performed with the Primer Script RT Reagent Kit (Takara, Dalian, China) and 18S (AJ272181.1) was used as a reference gene. The quantitative primers of all TaADH genes were designed by Primer 6.0 software, and BLAST searched against the wheat database to determine the specificity of primers (Table S1). The PCR conditions were as follows: 95 °C for 10 s and 40 cycles of 95 °C for 5 s and 60 °C for 30 s. The qRT-PCR was performed using an ABI Step One Plus. All the experiments were performed with three biological replicates. The relative expression was calculated using the 2−ΔΔCt method (Livak & Schmittgen, 2001).
Results
Genome-wide identification and physicochemical characteristics of ADH genes in Triticum aestivum
A total of 22 ADH genes were identified in the wheat genome based on the BLAST program. According to the location distribution of these genes on chromosomes (from Ta1A, Ta1B, Ta1D to Ta7A, Ta7B, Ta7D, from top to bottom), they were named TaADH1~TaADH22 (Table 1, Table S2). The length of predicted coding sequences of 22 TaADH genes ranged from 1,044 to 1,244 bp, the number of corresponding amino acids ranged from 347 to 415 aa. The theoretical isoelectric point (PI) ranged from 5.68 to 8.2, and the molecular weight ranged from 34.4 to 44.2 kDa. Through the subcellular localization prediction of TaADH genes, it was found that they were all localized to the cytoplasm.
| Gene ID | Gene name | Ta_Chra | Startb | Endc | CDs length (bp) |
Number of amino acid | Isoelectric point (pI)d | Molecular weight (Mw) KDae |
Subcellular localizationf |
|---|---|---|---|---|---|---|---|---|---|
| TraesCS1A02G370100.1 | TaADH1 | 1A | 547391832 | 547395833 | 1143 | 380 | 6.08 | 41.6 | Cytoplasm. |
| TraesCS1A02G370200.1 | TaADH2 | 1A | 547410788 | 547417410 | 1137 | 378 | 5.87 | 40.8 | Cytoplasm. |
| TraesCS1B02G389200.1 | TaADH3 | 1B | 622706402 | 622708971 | 1469 | 379 | 6.28 | 41.1 | Cytoplasm. |
| TraesCS1D02G376300.1 | TaADH4 | 1D | 452625185 | 452627671 | 1484 | 379 | 6.03 | 41.1 | Cytoplasm. |
| TraesCS4A02G202100.2 | TaADH5 | 4A | 491715851 | 491719316 | 1140 | 379 | 6.15 | 41.0 | Cytoplasm. |
| TraesCS4A02G202200.1 | TaADH6 | 4A | 491914927 | 491917719 | 1430 | 379 | 5.81 | 40.9 | Cytoplasm. |
| TraesCS4A02G202300.1 | TaADH7 | 4A | 492029965 | 492032871 | 1718 | 379 | 5.97 | 41.0 | Cytoplasm. |
| TraesCS4B02G106300.1 | TaADH8 | 4B | 115556136 | 115560148 | 1962 | 379 | 6.03 | 41.0 | Cytoplasm. |
| TraesCS4B02G106400.1 | TaADH9 | 4B | 115845355 | 115848000 | 1348 | 376 | 5.91 | 40.5 | Cytoplasm. |
| TraesCS4B02G106500.1 | TaADH10 | 4B | 115879177 | 115881956 | 1611 | 379 | 5.9 | 34.4 | Cytoplasm. |
| TraesCS4D02G103000.1 | TaADH11 | 4D | 81918232 | 81921969 | 1839 | 379 | 6.15 | 41.0 | Cytoplasm. |
| TraesCS4D02G103100.1 | TaADH12 | 4D | 81971499 | 81974375 | 1467 | 379 | 5.92 | 40.9 | Cytoplasm. |
| TraesCS4D02G103300.1 | TaADH13 | 4D | 81984987 | 81987448 | 1044 | 347 | 6.56 | 37.6 | Cytoplasm. |
| TraesCS5A02G193900.1 | TaADH14 | 5A | 397249660 | 397251898 | 1359 | 365 | 5.68 | 39.7 | Cytoplasm. |
| TraesCS5B02G189200.1 | TaADH15 | 5B | 341062699 | 341068539 | 1140 | 379 | 5.83 | 40.9 | Cytoplasm. |
| TraesCS5D02G196300.2 | TaADH16 | 5D | 299832208 | 299835185 | 1751 | 379 | 5.68 | 41.0 | Cytoplasm. |
| TraesCS6A02G386600.1 | TaADH17 | 6A | 603279456 | 603282956 | 1367 | 381 | 6.55 | 40.6 | Cytoplasm. |
| TraesCS6B02G425700.1 | TaADH18 | 6B | 694401891 | 694405637 | 1529 | 381 | 6.37 | 40.7 | Cytoplasm. |
| TraesCS6D02G371200.1 | TaADH19 | 6D | 456554723 | 456558968 | 1629 | 381 | 6.37 | 40.7 | Cytoplasm. |
| TraesCS7A02G322200.1 | TaADH20 | 7A | 466247186 | 466249779 | 1248 | 415 | 8.2 | 44.0 | Cytoplasm. |
| TraesCS7B02G223100.1 | TaADH21 | 7B | 419035483 | 419038096 | 1248 | 415 | 8.18 | 44.2 | Cytoplasm. |
| TraesCS7D02G319100.1 | TaADH22 | 7D | 407849007 | 407852341 | 2011 | 415 | 8.2 | 44.1 | Cytoplasm. |
Notes:
Classification and conserved domain analysis of 22 TaADHs
To analyze the evolutionary relationship of 22 TaADH proteins, the phylogenetic tree was constructed by MEGA7.0. According to the amino acid sequence identity, 22 TaADH proteins were divided into two subfamilies (subfamily I, subfamily II) (Fig. 1A). Subfamily I contained the largest number of (10) TaADH proteins, and the remaining three TaADH proteins (TaADH20~22) belonged to subfamily II.
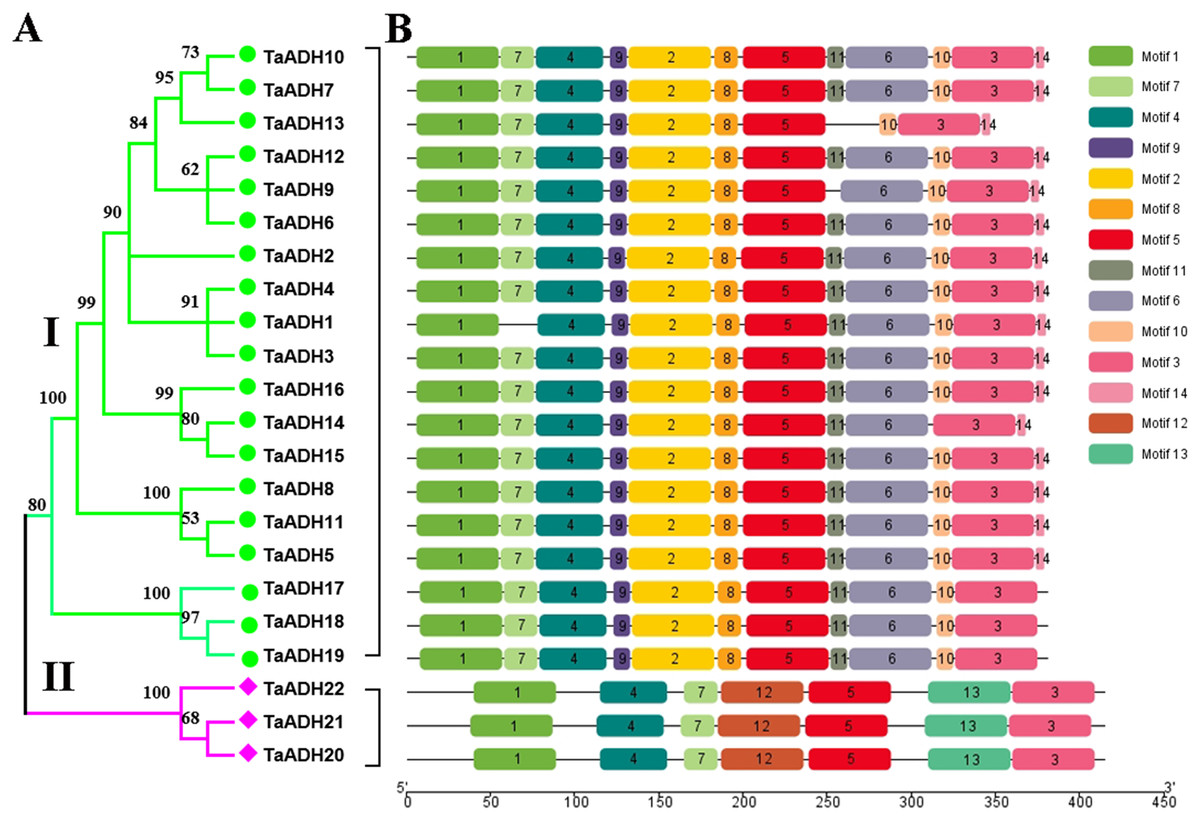
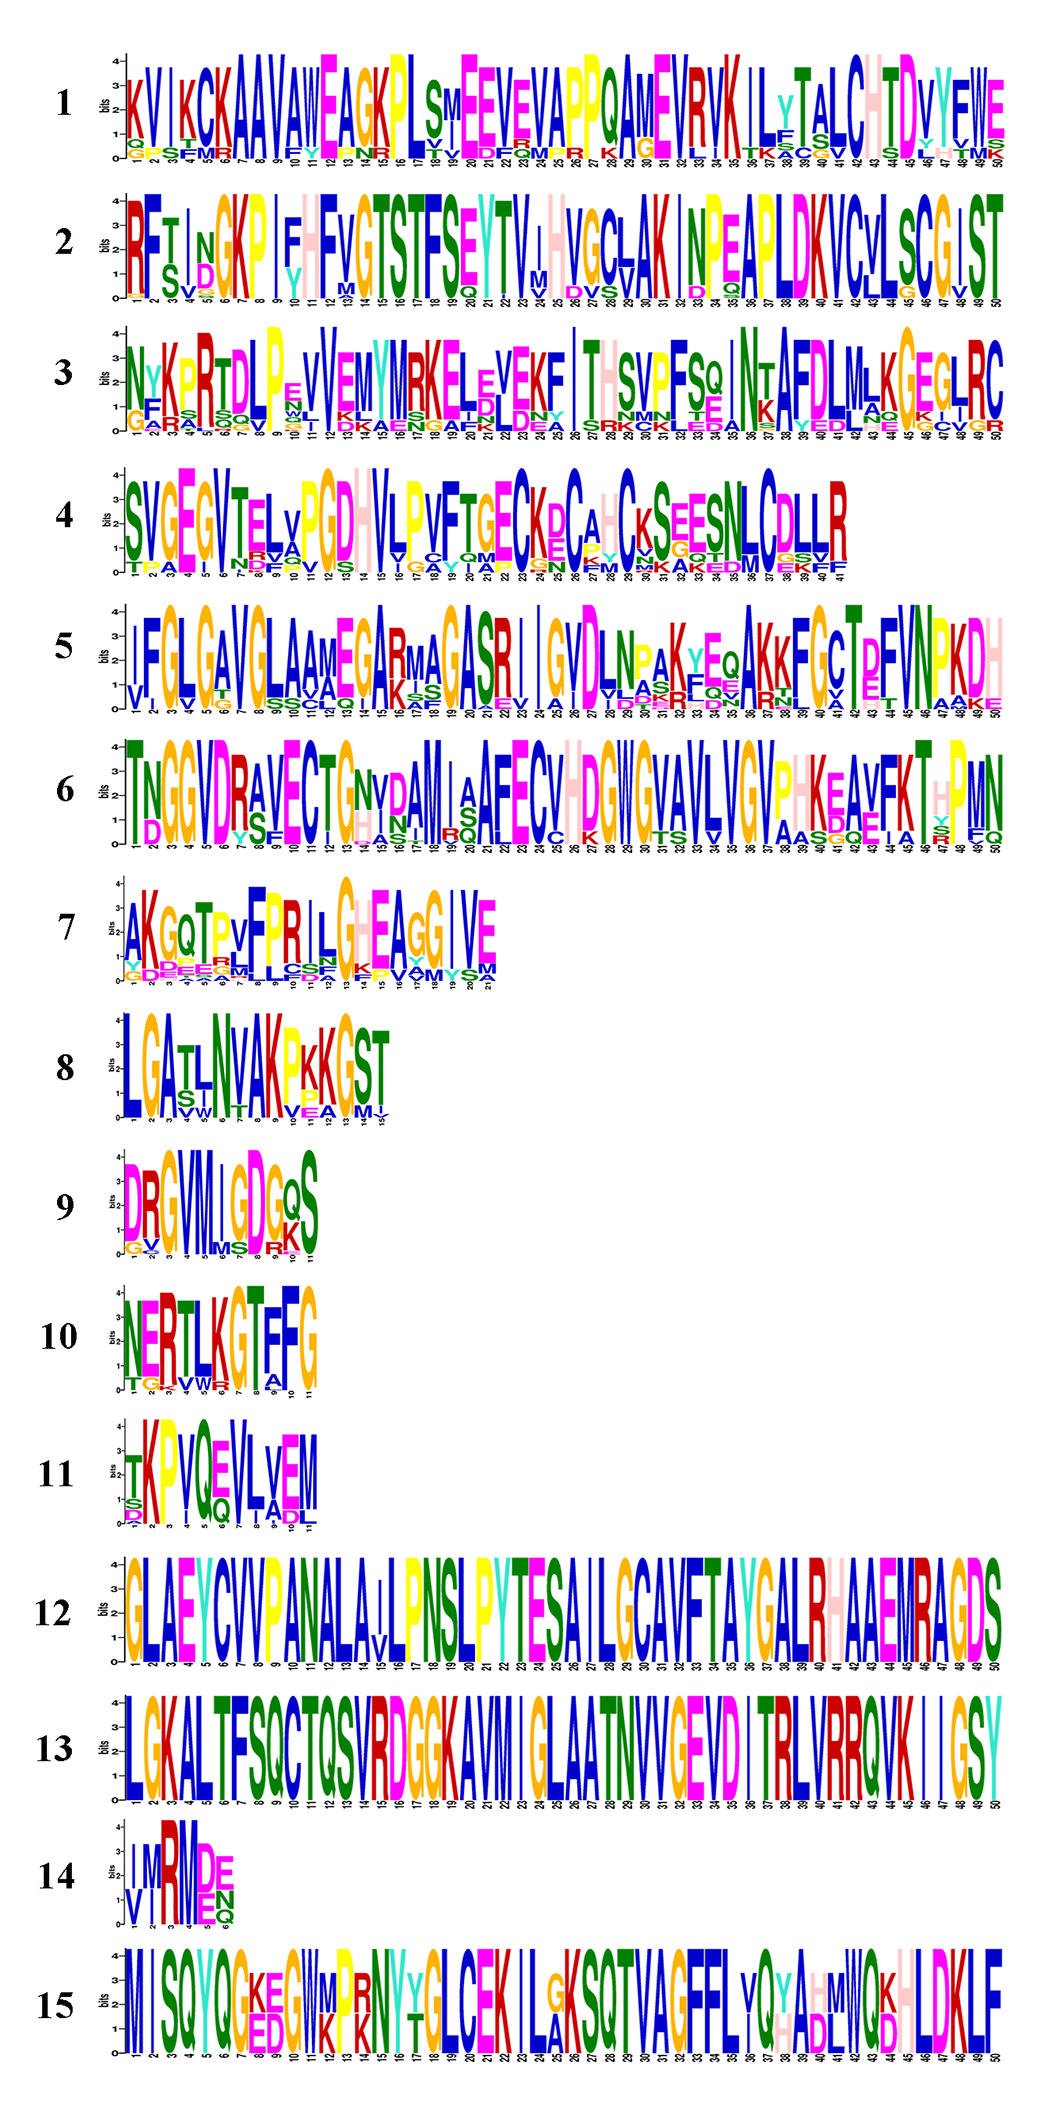
Figure 1: Phylogenetic relationship and motif analysis of ADH proteins in wheat.
(A) An unroot phylogenetic tree of 22 TaADH proteins. (B) The motif composition of TaADH proteins. There were a total of 14 motifs, each of which was represented by a specific number.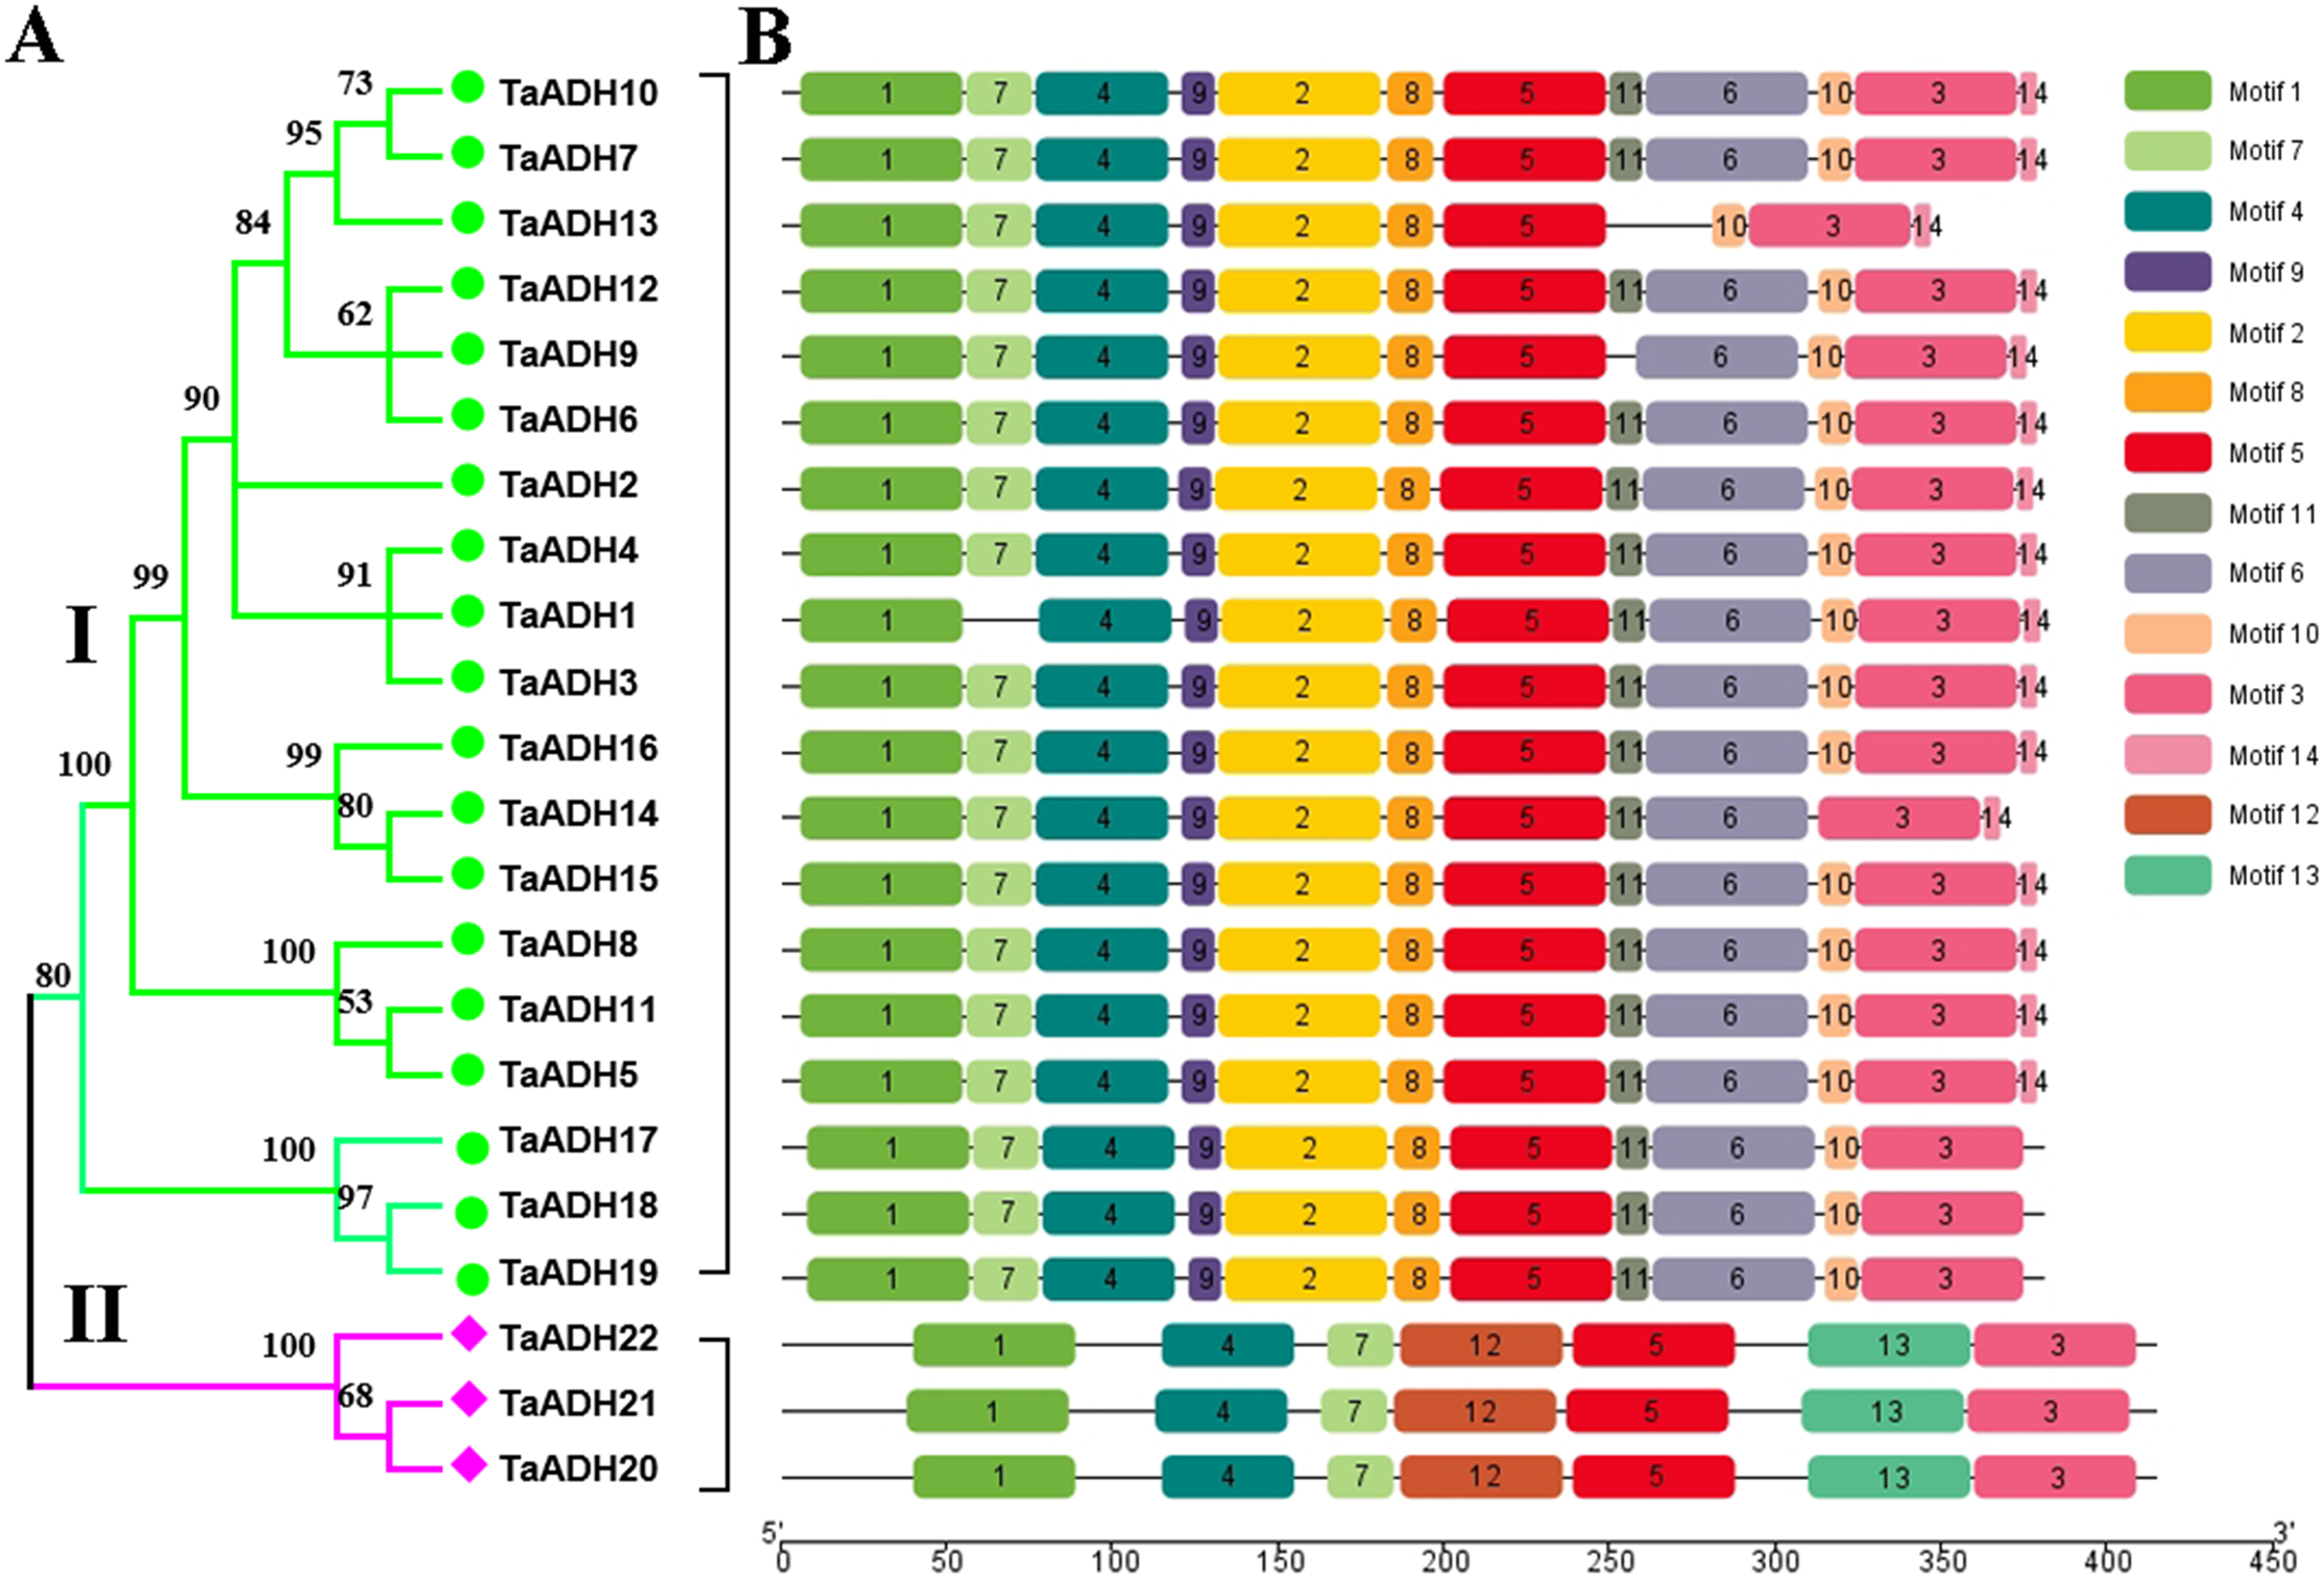
To analyze the conserved motif of TaADH protein, we used MEME online software to analyze the 22 TaADH protein sequences. A total of 14 motifs were detected in the wheat ADH family (Fig. 1B, Fig. S1). Motif 1, 3, 4 and 5 existed in all TaADH proteins, indicating that these TaADH proteins were highly conserved (Fig. 1B). Motif 2, 8, 9 and 11 existed only in subfamily I, while motif 12, 13 only existed in subfamily II (Fig. 1B), indicating structural differences and specificity among different subfamilies. Motif 7 was only missed in TaADH1, motif 11 was only missed in TaADH13, TaADH9 and subfamily II, and motif 10 was only missed in TaADH14 and subfamily II.
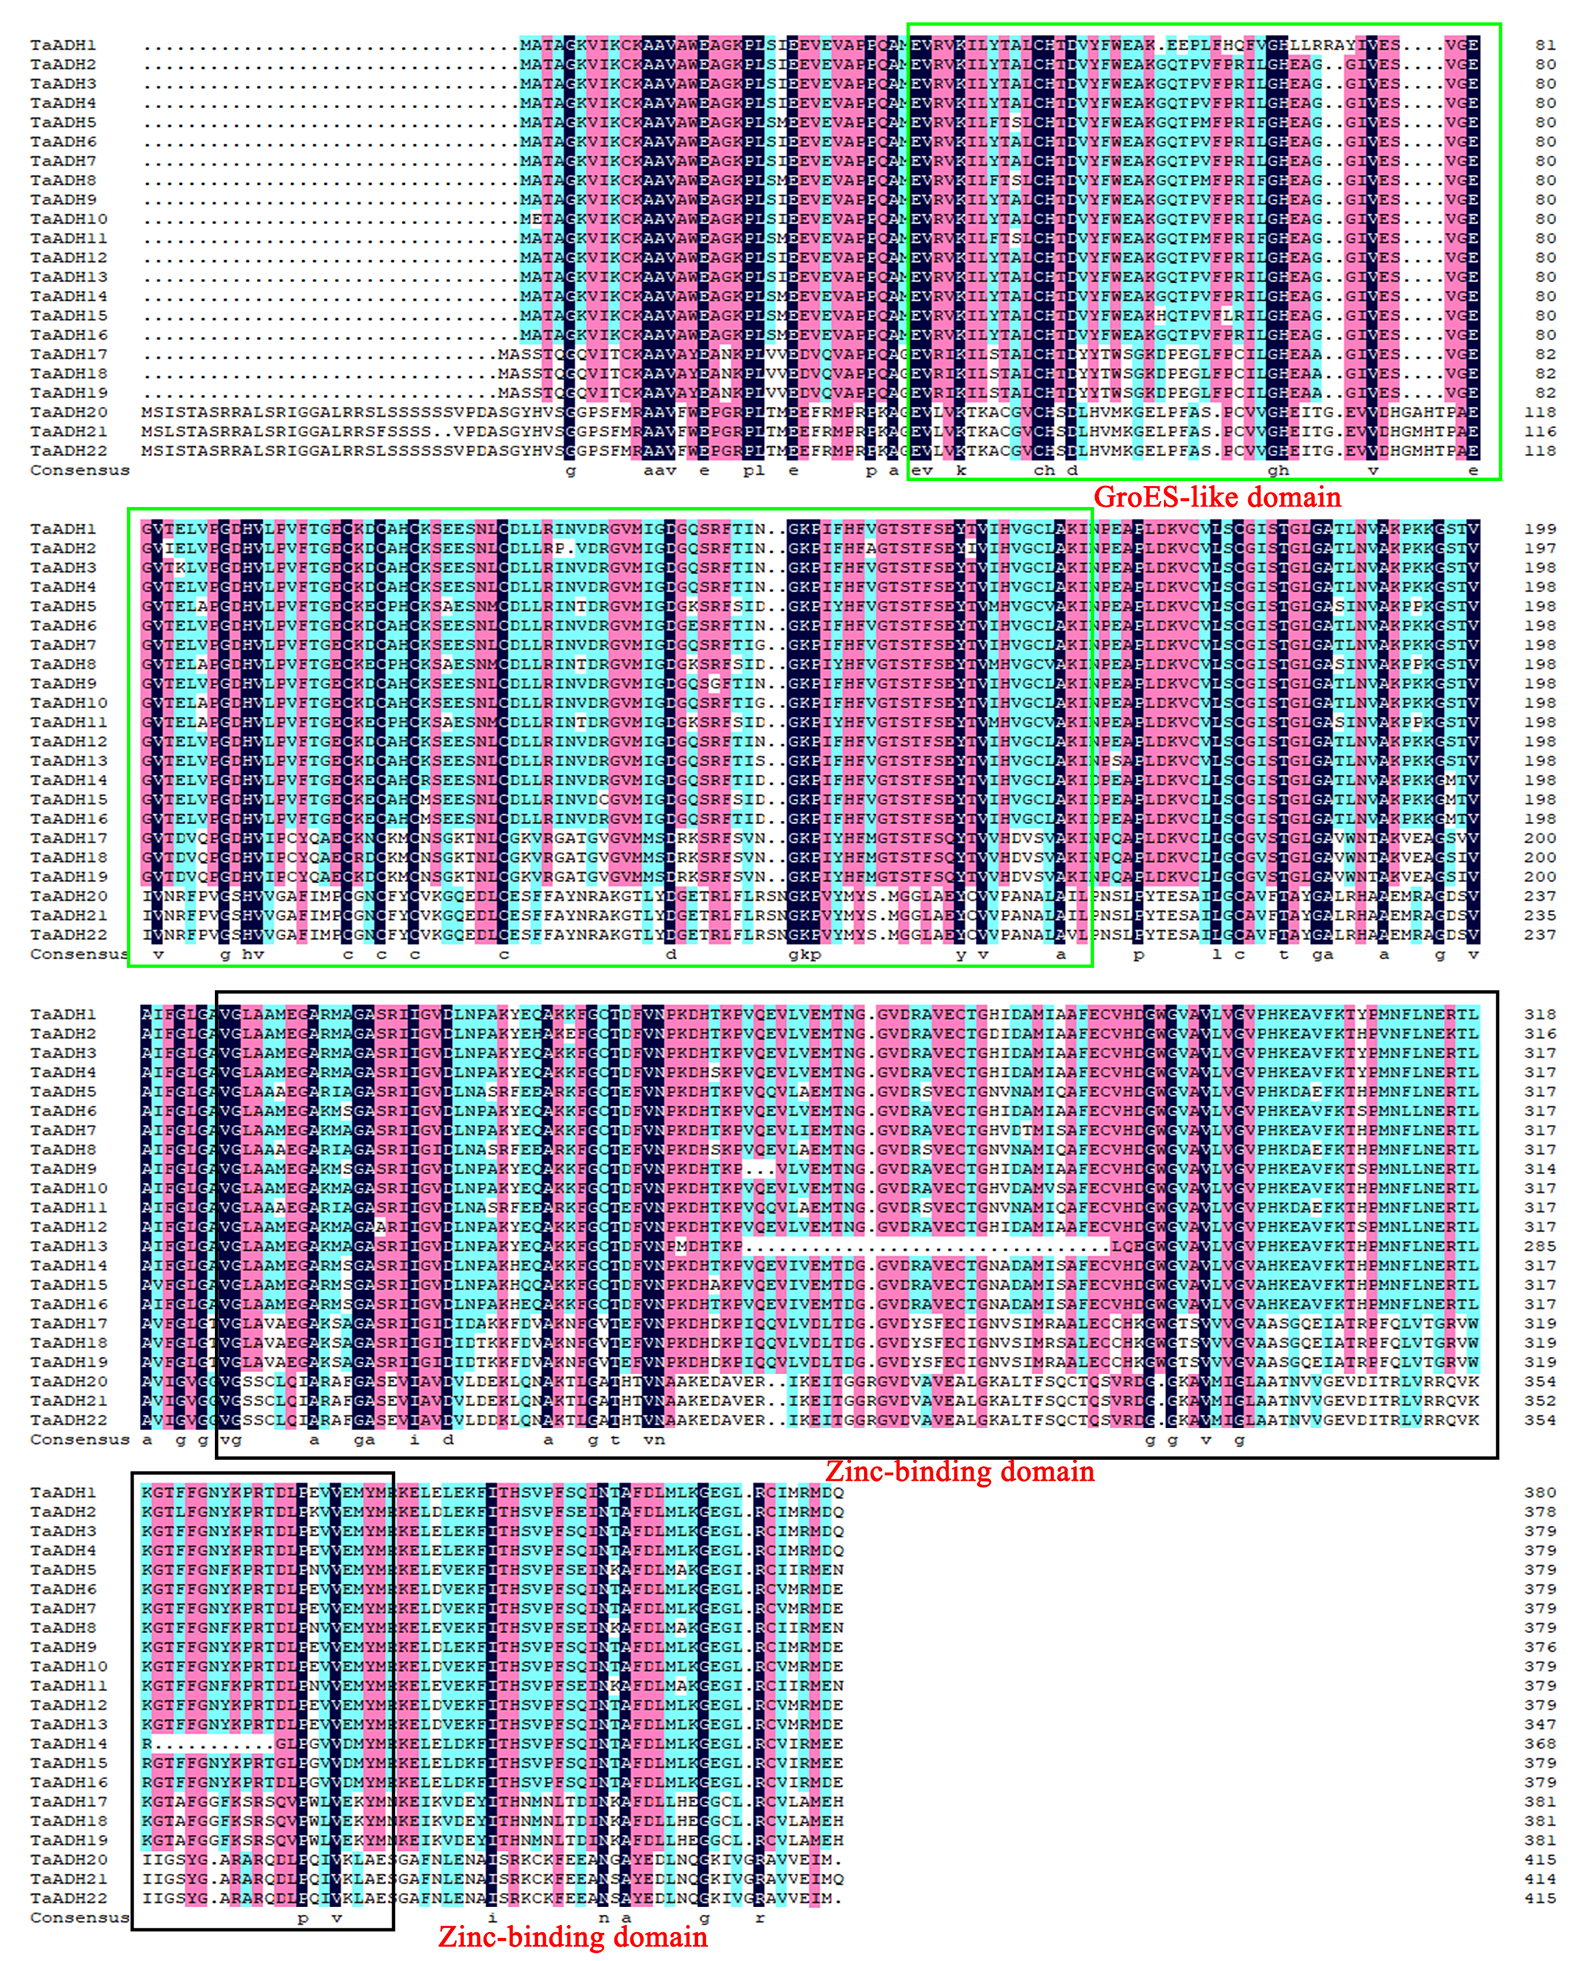
Comparing the sequences of 22 TaADH proteins, all of these protein sequences contained conserved GroES-like domain and Zinc-binding domain (Fig. S2). GroES-like domain contained 35~164 amino acids, and the Zinc-binding domain contained 206~340 amino acids, which correspond to the structural characteristics of the ADH gene family.
Exon-intron analysis of 22 TaADHs
Through the analysis of intron-exon structure, we found that 22 TaADH genes contained 8~10 exons (Fig. 2). In subfamily I, three genes (TaADH5, TaADH8 and TaADH11) contained six exons, two genes (TaADH13 and TaADH16) contained eight exons, and the remaining TaADH genes contained nine exons (Fig. 2). In subfamily II, all TaADH genes contained eight exons (Fig. 2). As a whole, we found that the same branch contained similar structural patterns.
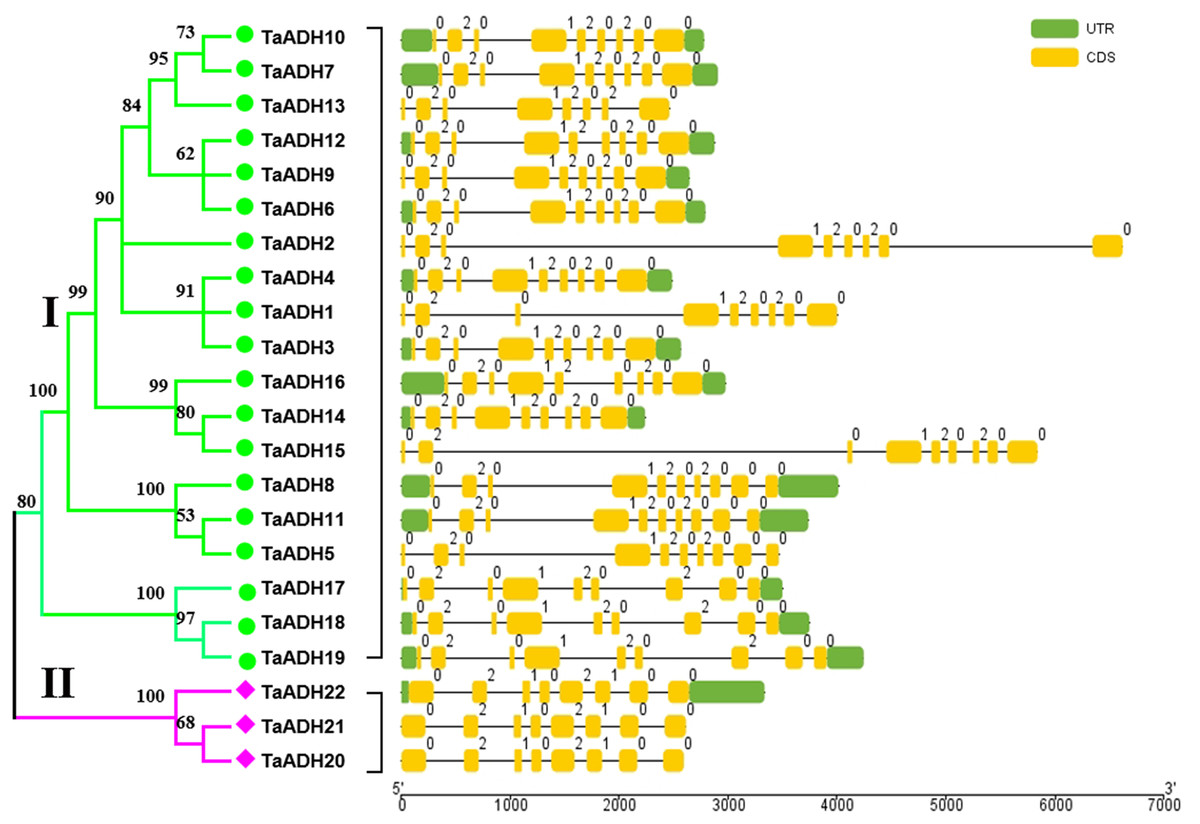
Figure 2: Intron-exon structure analysis of the ADH gene in wheat.
The exons, introns and untranslated regions (UTRs) were indicated by yellow boxes, black lines and green boxes, respectively. The size of exons and introns can be estimated from the bottom scale.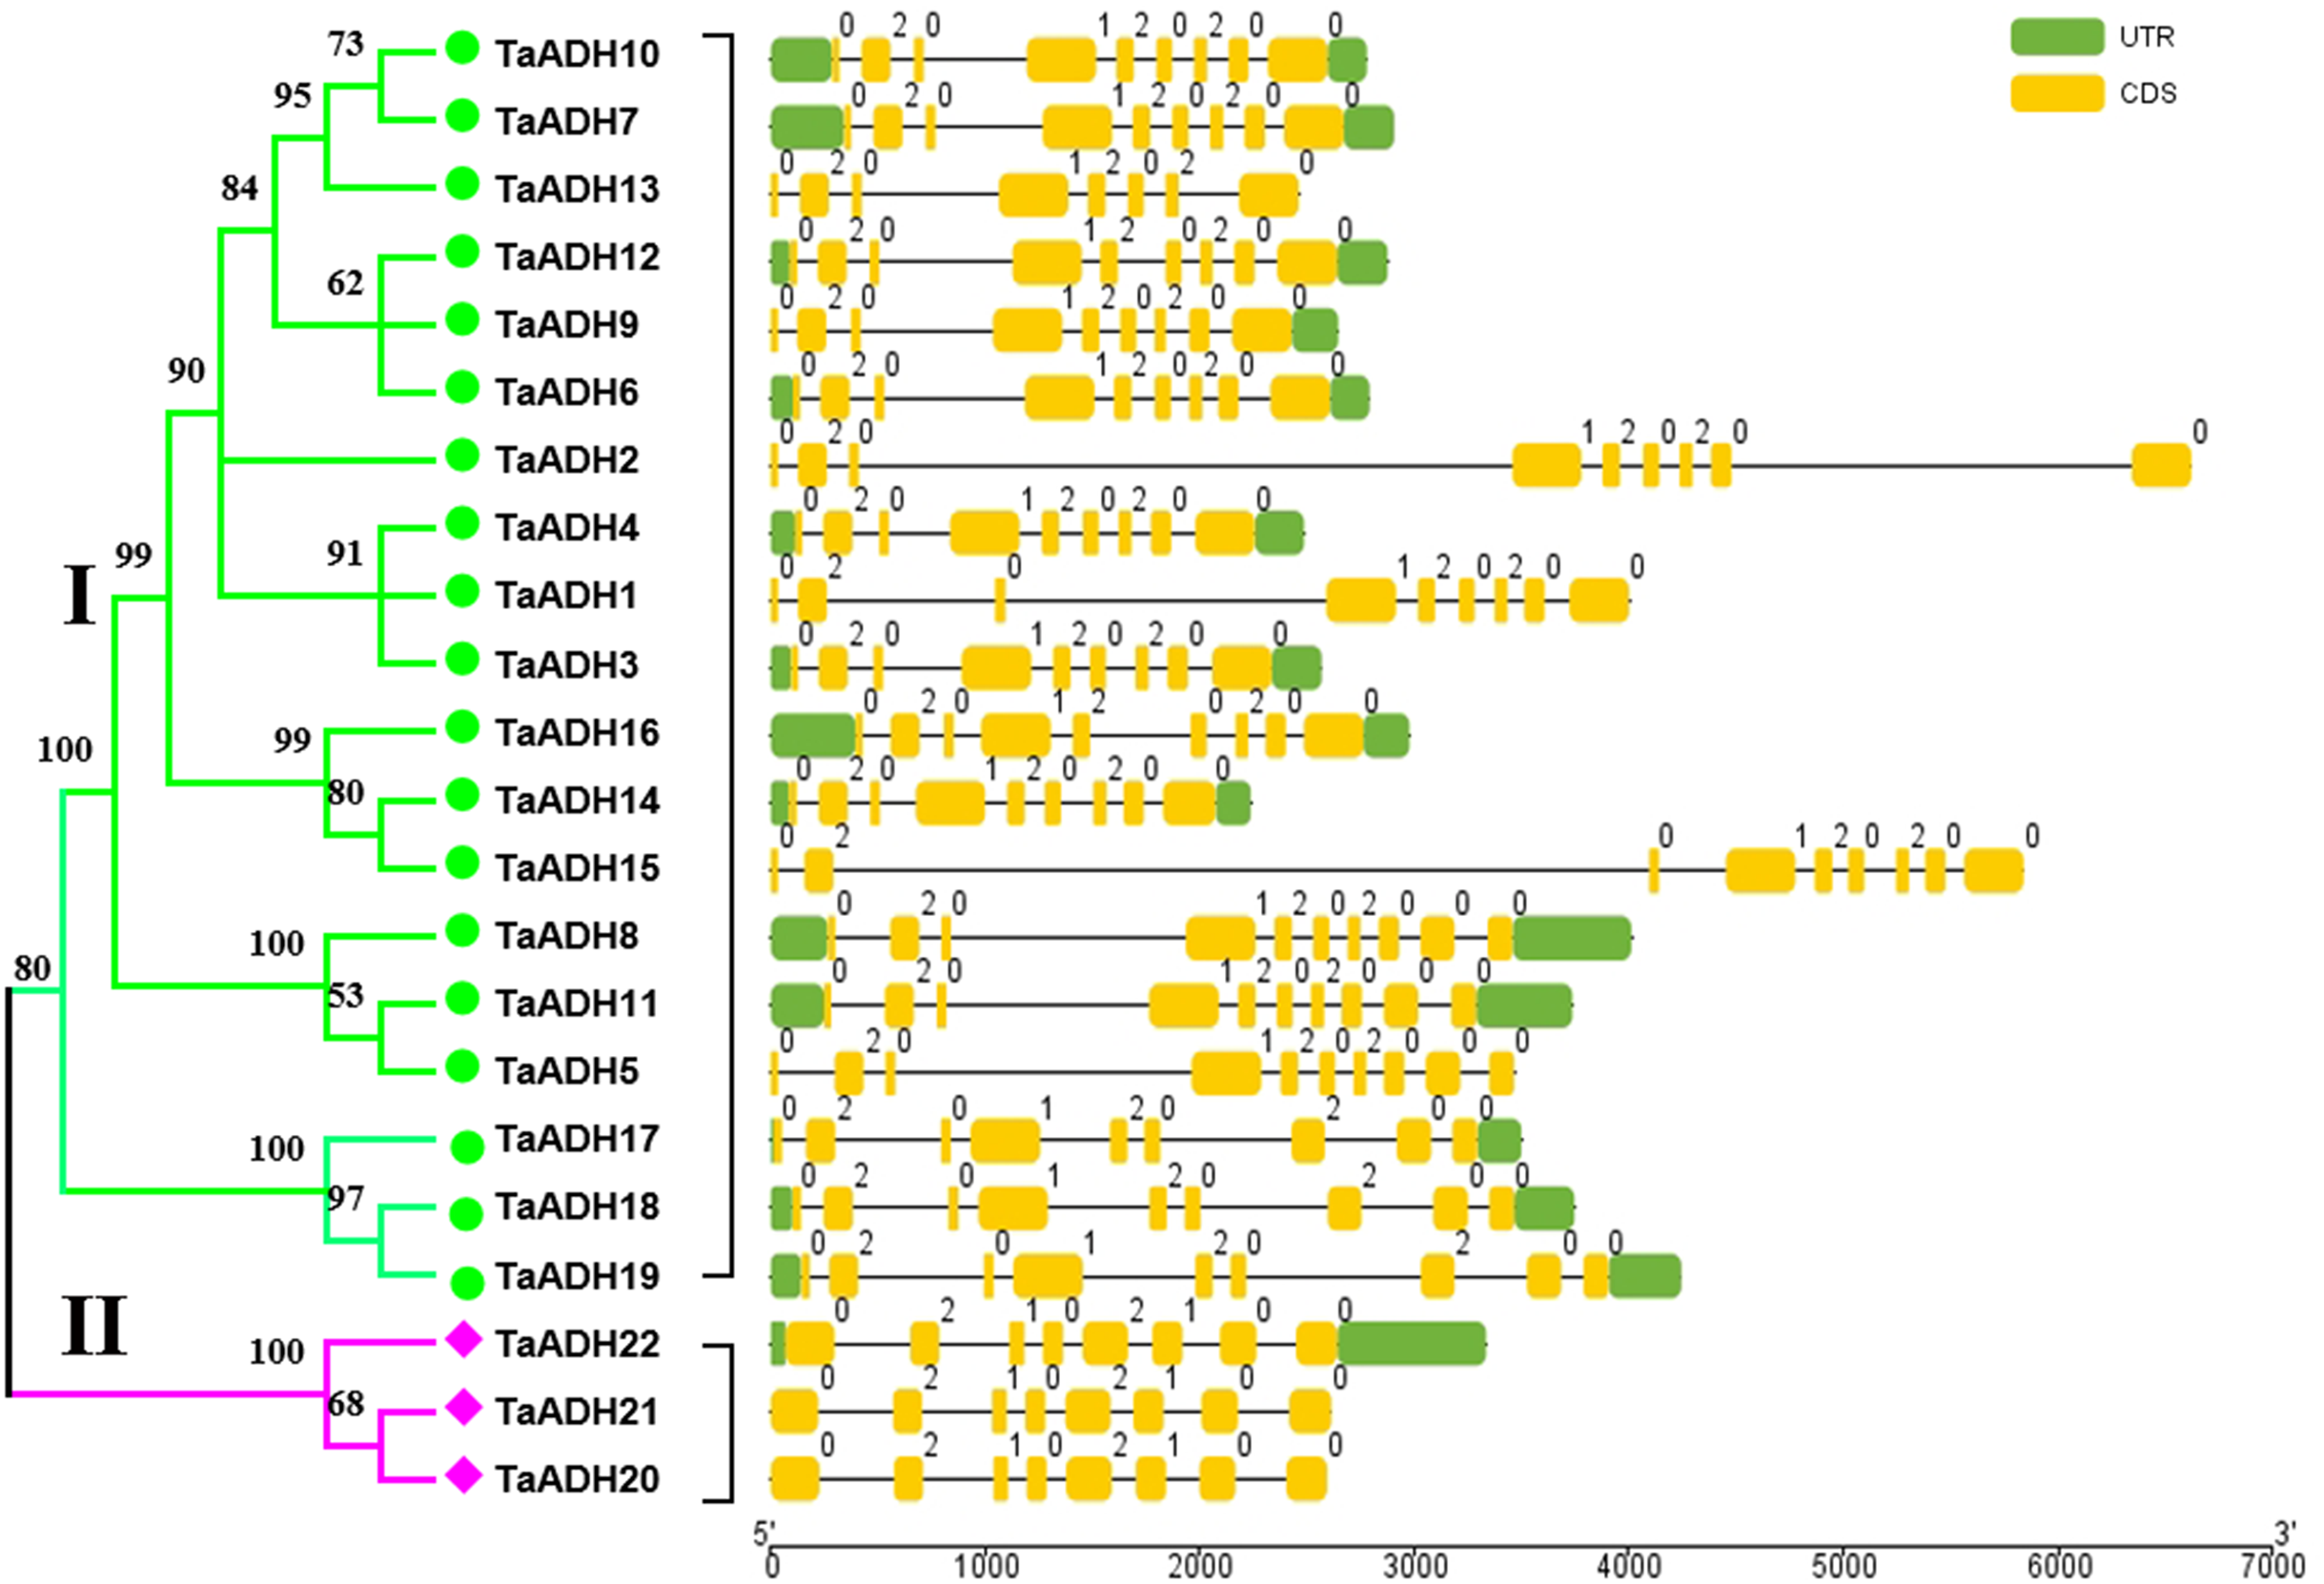
Chromosomal distribution and gene duplication of 22 TaADHs
According to the initial position of 22 TaADHs on the chromosome, they were visualized by TBtools. Twenty-two TaADHs were unevenly distributed on 15 of 21 chromosomes (they do not exist on chromosomes Ta2A-D and Ta3A-D) (Fig. 3A). There were three genes on chromosomes Ta4A-D, respectively; two genes on chromosome Ta1A; and one gene on the other chromosomes, respectively (Fig. 3).
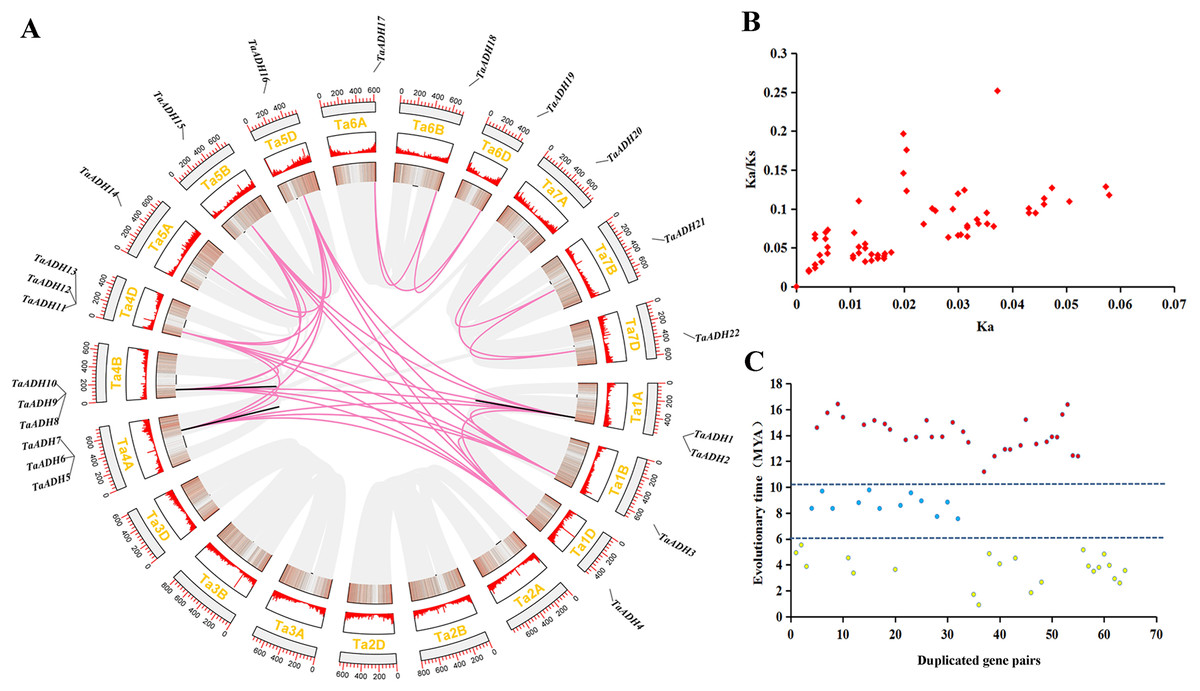
Figure 3: Location distribution of TaADH genes on chromosomes and analysis of duplicated genes.
(A) Distribution of 22 TaADH genes on chromosomes and duplicated gene pairs in wheat. Red lines represented of duplicated genes pairs on different chromosomes, while black lines represented duplicated genes pairs on the same chromosome. (B) The Ka/Ks of 64 duplicated genes pairs. (C) The evolutionary time of 64 duplicated genes pairs. Ka, the non-synonymous substitution rate; Ks, synonymous substitution rate; Mya, million years ago.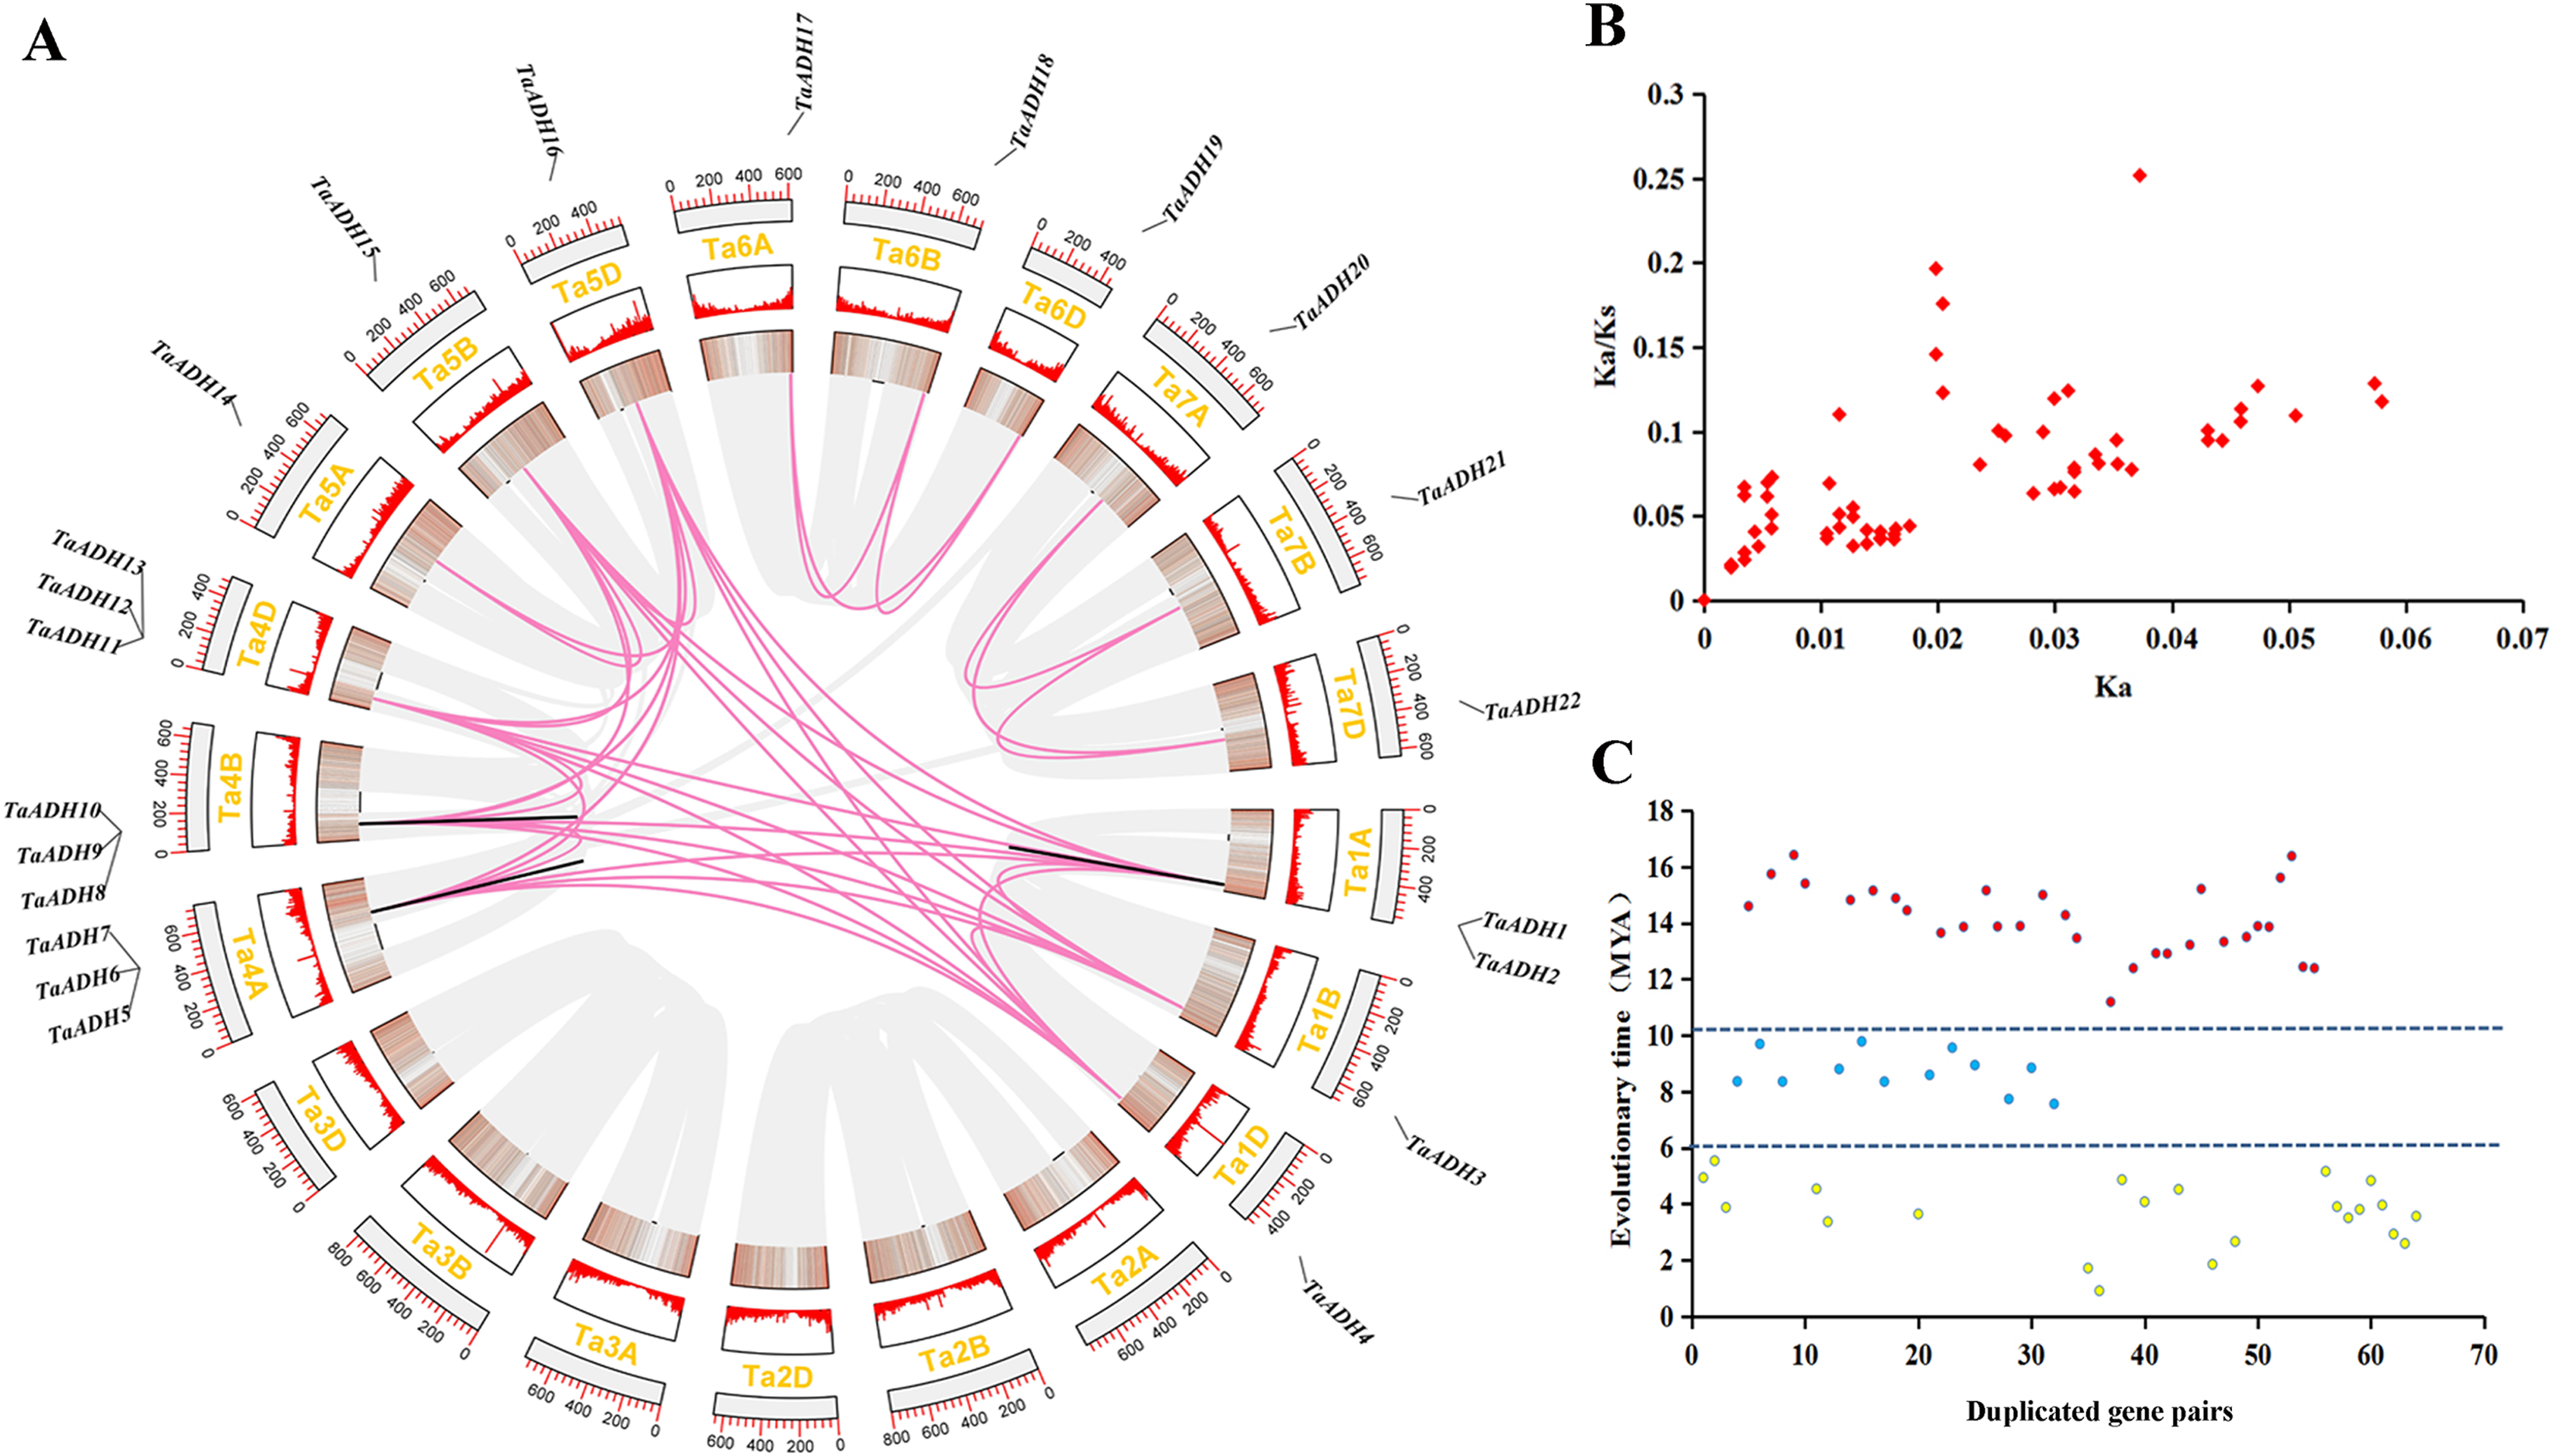
By analyzing the duplication events of 22 TaADHs, we found 64 pairs of duplicated genes (Fig. 3, Table S3). Most of these duplicated genes were on different chromosomes, TaADH1-TaADH2, TaADH1-TaADH3, TaADH6-TaADH7 and TaADH9-TaADH10 were on the same chromosome, respectively. However, we found that only the distances of TaADH1-TaADH2 and TaADH9-TaADH10 were less than 100 kb, indicating that the two duplicated gene pairs had tandem duplication events, and the remaining duplicated gene pairs had undergone fragment duplication events (Table 1, Table S3).
To reveal the selection pressure of TaADH family genes in the process of evolution, the non-synonymous substitution rate (Ka), synonymous substitution rate (Ks) and Ka/Ks for 64 duplicated pairs were calculated (Fig. 3B, Table S3). All Ka/Ks of these duplicated pairs were less than 1, which tended to a pure selection, indicating that the sequence similarity of TaADH genes was very high and relatively conservative in the process of evolution. The evolution time of the duplicated events of TaADH genes can be divided into three evolution periods (Fig. 3C, Table S3). The first period was 11.19~16.42 million years ago (Mya), with 30 duplicated gene pairs. Twelve TaADH duplicated gene pairs occurred at 7.56~9.56 Mya. The remaining 22 TaADH duplicated gene pairs occurred at 0.9~5.53 Mya. Although these gene sequences were conserved, they were different in evolutionary time.
Phylogenetic relationship of ADHs in Triticum aestivum and A. thaliana
To study the evolutionary relationship between Triticum aestivum (22) Arabidopsis thaliana (7), Cucumis melo (13), Cucumis sativus (12), Glycine max (3), Hordeum vulgare (1), Lycopersicon esculentum (7), Oryza sativa (1) and Vitis vinifera (8), a phylogenetic tree was constructed. According to the amino acid sequence identity, all ADH proteins were divided into three subfamilies (subfamily I, II, III) (Fig. 4), which was consistent with the classification of TaADH in Fig. 1A. TaADHs existed only in subfamily I and subfamily II. Subfamily I contained the most (59) ADH proteins, subfamily III contained the least (5) ADH proteins, and the remaining proteins (10) belonged to subfamily II. Besides, according to the number of amino acid residues, all ADH proteins in subfamily I belonged to medium-chain ADH proteins, 3 ADH proteins from subfamily II belonged to long-chain-ADH, the remaining proteins from subfamily II belonged to medium-chain ADH proteins (Fig. 4). All TaADHs belonged to medium-chain ADH protein (Fig. 4).
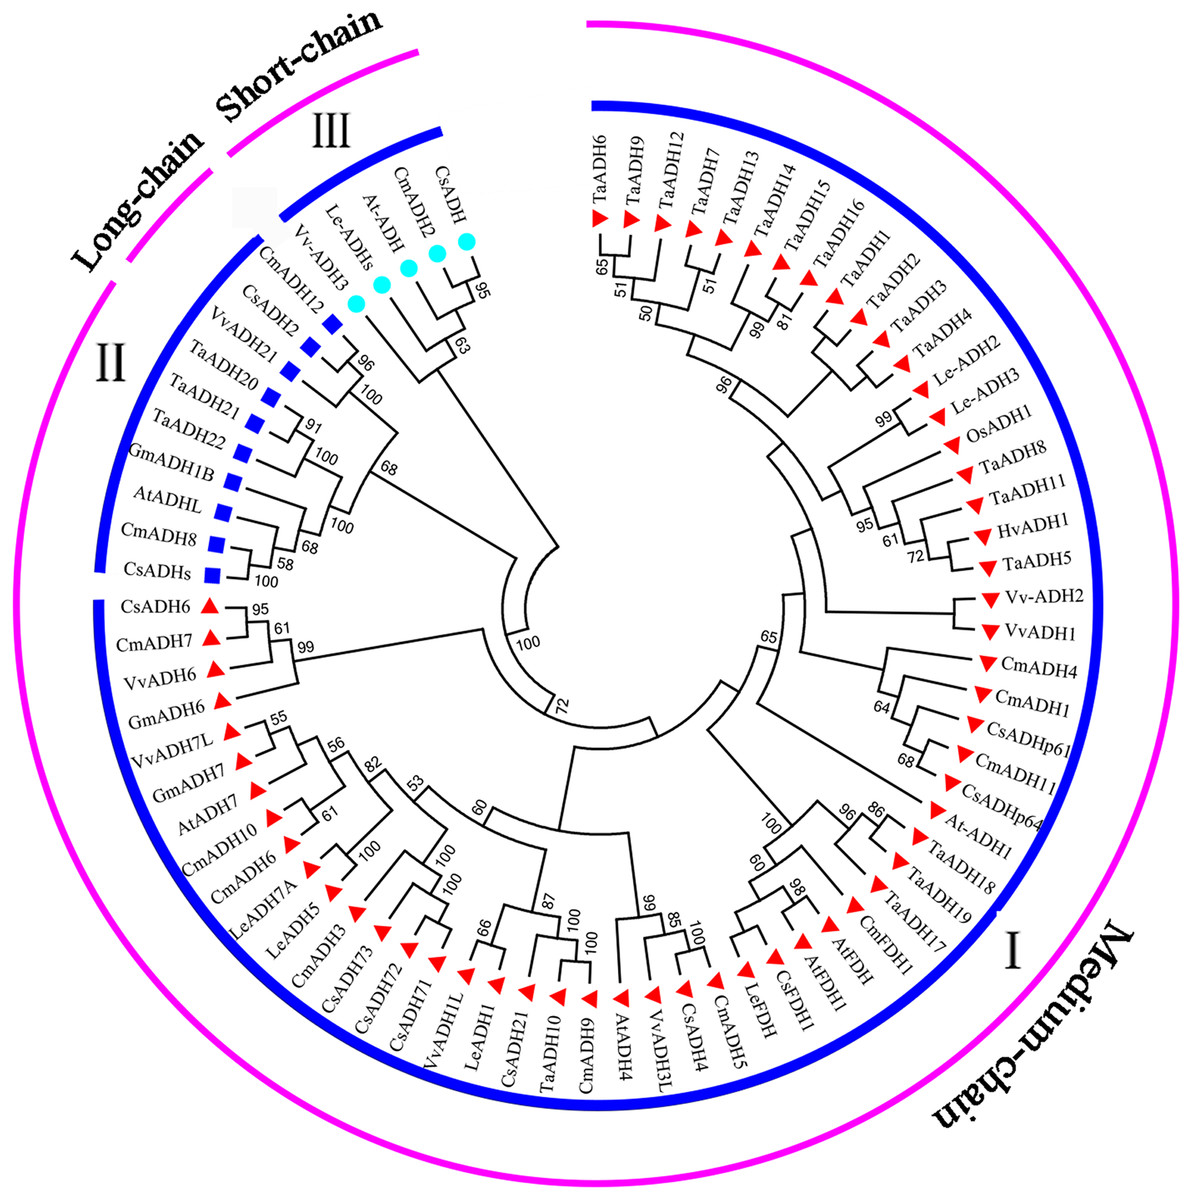
Figure 4: The evolutionary relationship between TaADHs and other nine species.
Eighty percent cut-off value was used for the condensed tree. At, Arabidopsis thaliana; Cm, Cucumis melo; Cs, Cucumis sativus; Hv, Hordeum vulgare; Os, Oryza sativa; Gm, Glycine max; Le, Lycopersicon esculentum; Ta, Triticum aestivum; Vv, Vitis vinifera.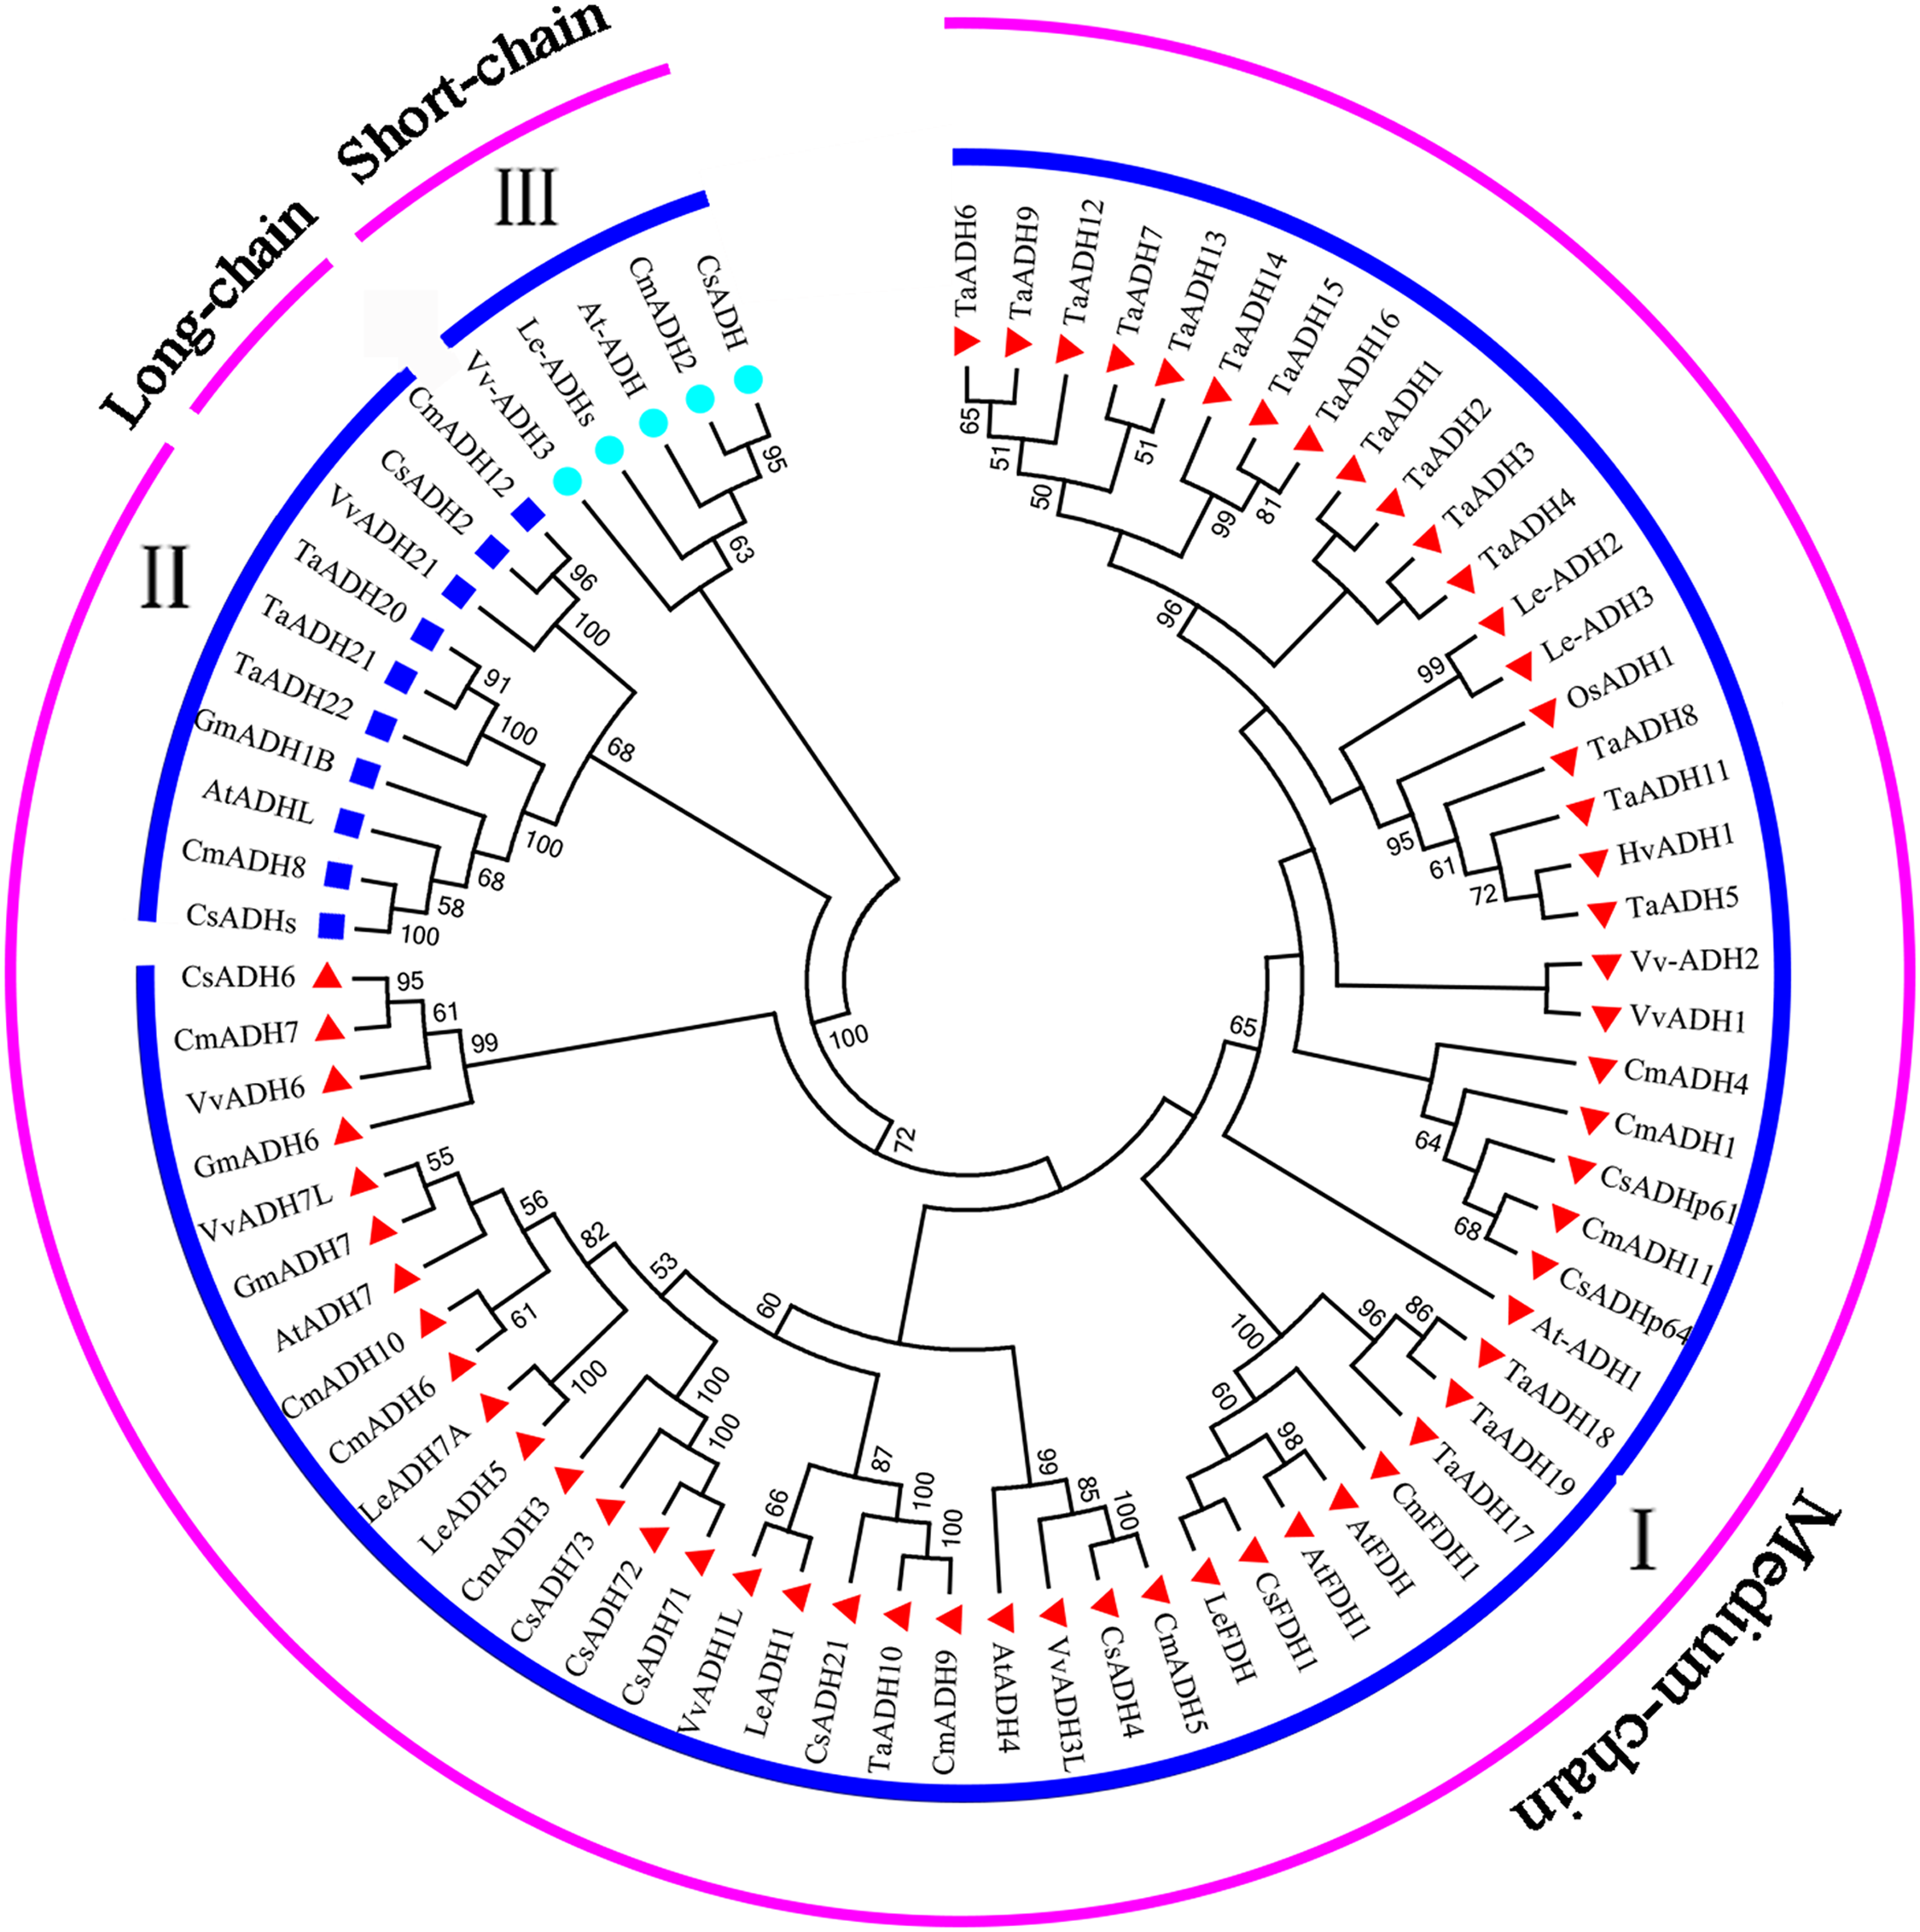
The same subfamily usually contained ADH proteins of several species. For instance, subfamily II contained ADH proteins from Arabidopsis thaliana, Cucumis melo, Cucumis sativus, Glycine max, Triticum aestivum and Vitis vinifera, which indicated that these species came from the same ancestor a long time ago.
Tissue expression patterns of TaADH genes
According to the transcriptome data of different wheat tissues, we analyzed the tissue expression pattern of 22 TaADH genes in roots, leaf, stem, spike and grain (Fig. 5). Nine genes (TaADH8, TaADH11, TaADH18, TaADH17, TaADH19, TaADH5, TaADH22, TaADH20 and TaADH21) were highly expressed in all tissues. Six genes (TaADH12, TaADH13, TaADH1, TaADH9, TaADH2 and TaADH15) were not expressed or low expressed in all tissues; the remaining genes were only highly expressed in specific tissues, such as TaADH4 and TaADH6 were highly expressed in grain, but not or low expressed in other tissues.
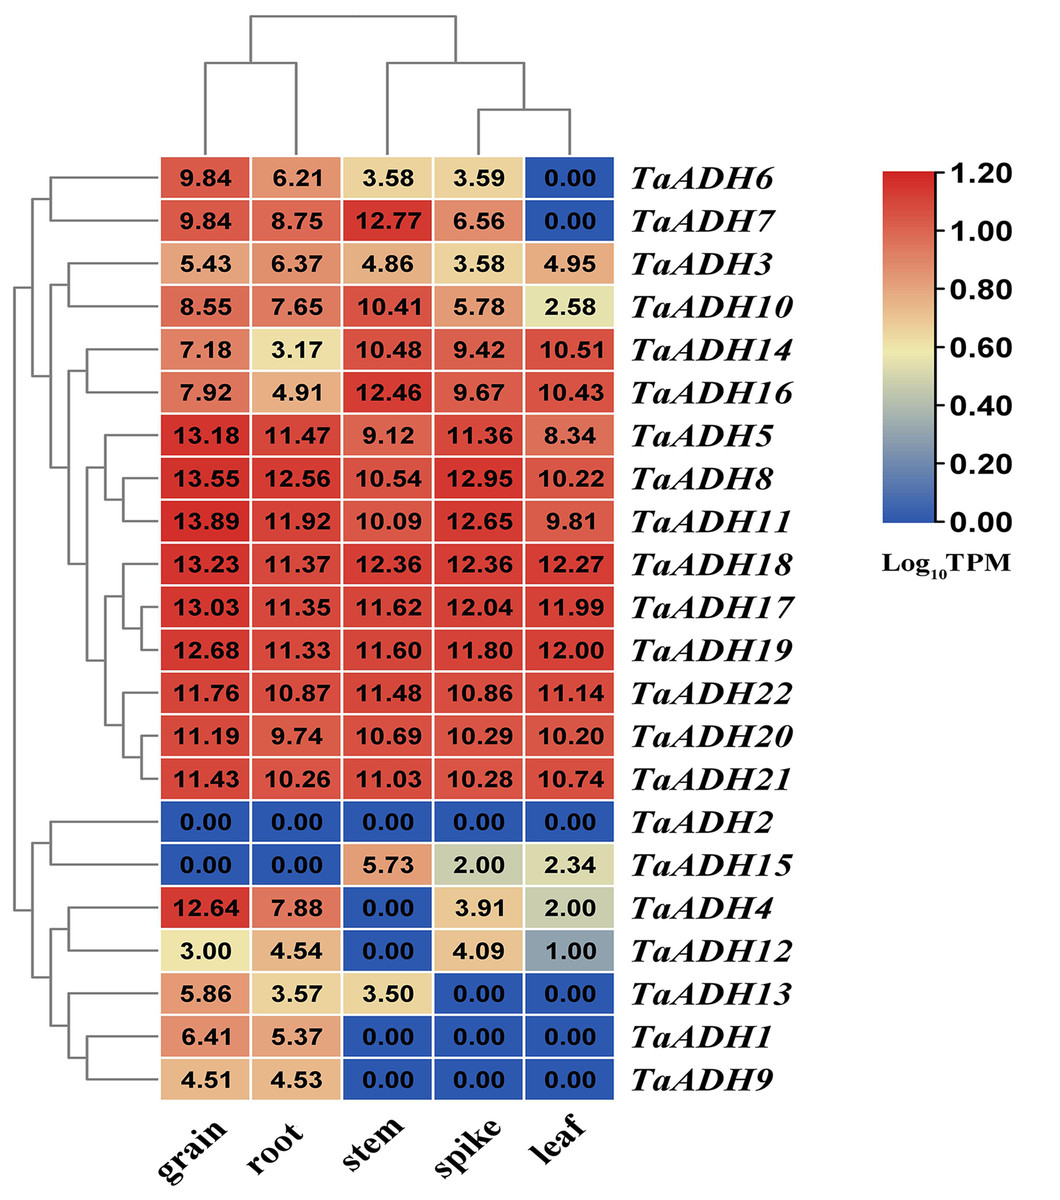
Figure 5: Distribution and statistical analysis of cis-acting elements in TaADHs promoter.
The number of squares represented the predicted number of cis-acting elements. The colour scale on the right also represented the number of cis-acting elements. The darker the red shading was, the higher the number.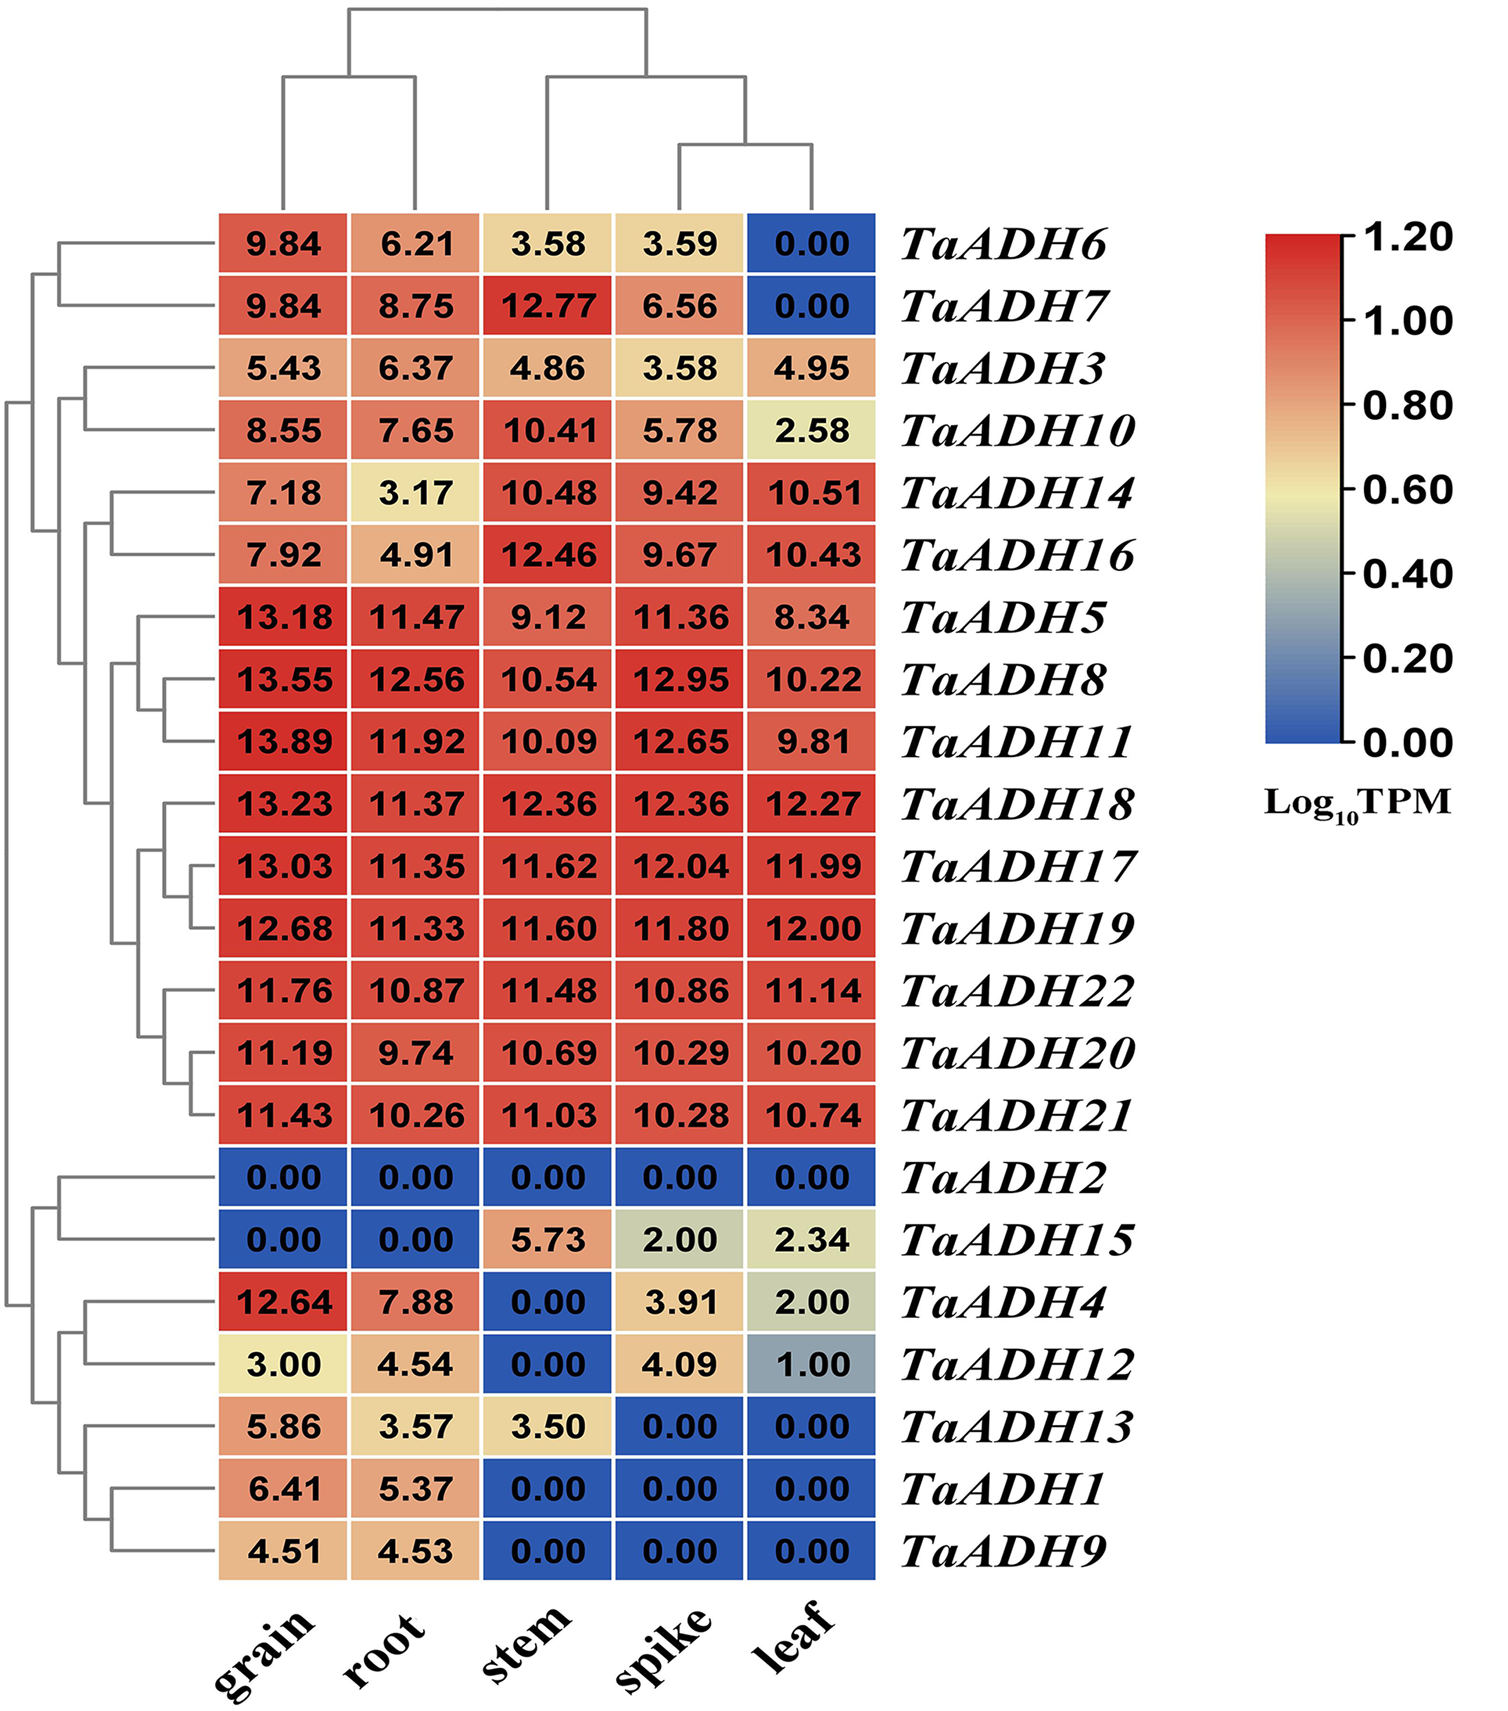
For the duplicated genes, we found that they had the same tissue expression patterns, such as TaADH8_TaADH11, TaADH17_TaADH18, TaADH20_TaADH21, and so on. There were also differences in the expression patterns of some other duplicated genes (Fig. 5). For example, in the duplicated gene pair TaADH9_TaADH16, TaADH9 was only expressed in grain and root. In contrast, TaADH16 was expressed in all tissues, and the expression profiles in grain and root were lower than that in other tissues (Fig. 5), so it was speculated that duplicated genes had been diversified in the process of evolution.
The cis-regulatory element analysis and GO annotation of TaADH genes
To analyze the potential function of 22 TaADH genes, we analyzed the cis-acting elements of TaADH gene promoters. Through the analysis of 2,000 bp before the start codon, we found that a total of 563 cis-acting elements, which responded to 11 stresses (biotic and abiotic), including hormone response, anaerobic response, defence, and stress response, drought induction, light response, low-temperature response, etc. (Fig. 6, Table S4). Seventeen genes (77%) respond to ABA, of which the TaADH4 gene contained eight abscisic acid responsiveness elements (ABREs), which suggested that the gene may play a key role in the abscisic acid response. The TGACG-motif and CGTCA-motif were methyl jasmonate response elements (Chen & Qiu, 2020). TaADH3 each contained seven TGACG-motifs and seven CGTCA-motifs, so it was speculated that this gene played a key role in methyl jasmonate response. Anaerobic response element (ARE) contained a conserved AAACCA sequence, mainly involved in anaerobic induction. In this study, we found that except for TaADH13 did not contain ARE, all other TaADH genes contained ARE elements. For example, TaADH6 and TaADH9 contained six AREs, respectively, which suggested that TaADH family genes may play key roles under anaerobic stress.
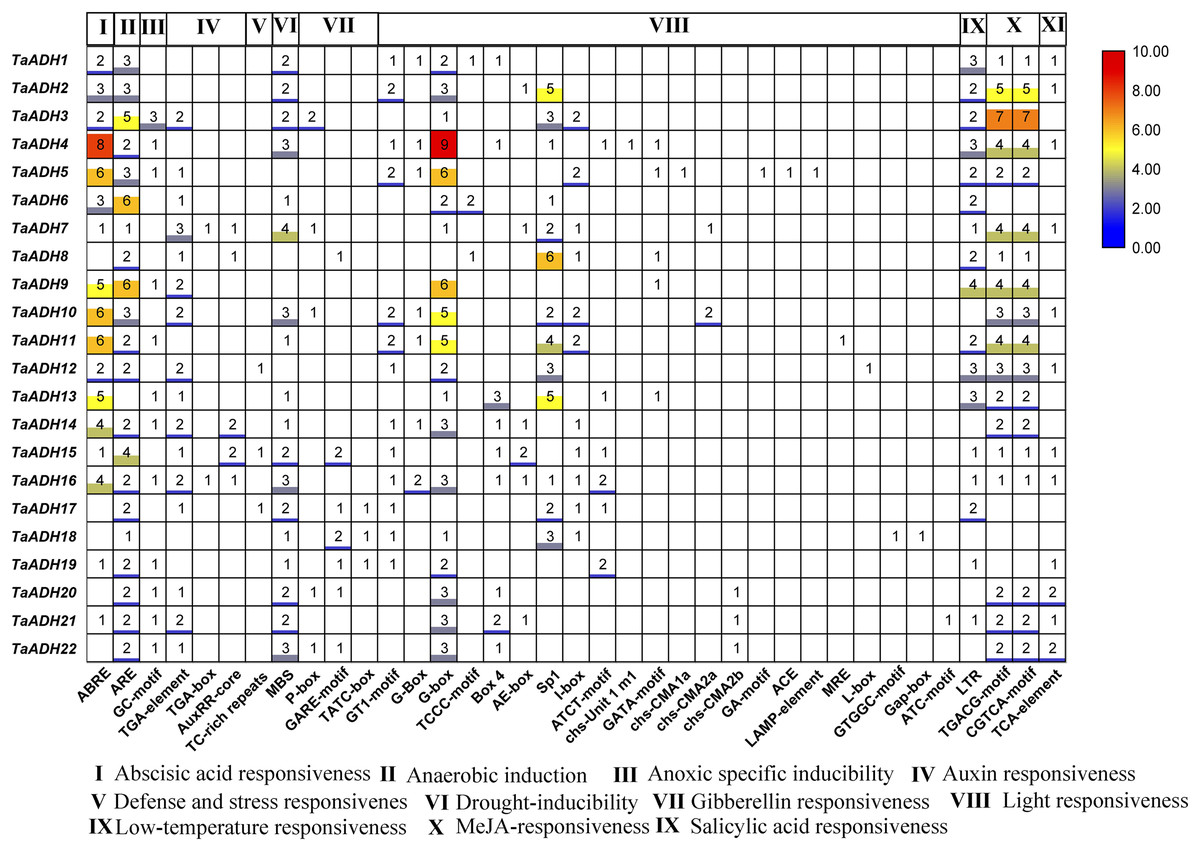
Figure 6: The expression of TaADH genes in various tissues.
A heatmap was constructed based on the TPM data (http://www.wheat-expression.com/) using TBtools software. The number on the heat map represented the TPM value, and the colour scale represented the range of Log10TPM. In the colour scale, dark red shading indicates higher values, and dark blue shading indicates lower values. The lower the value, the bluer.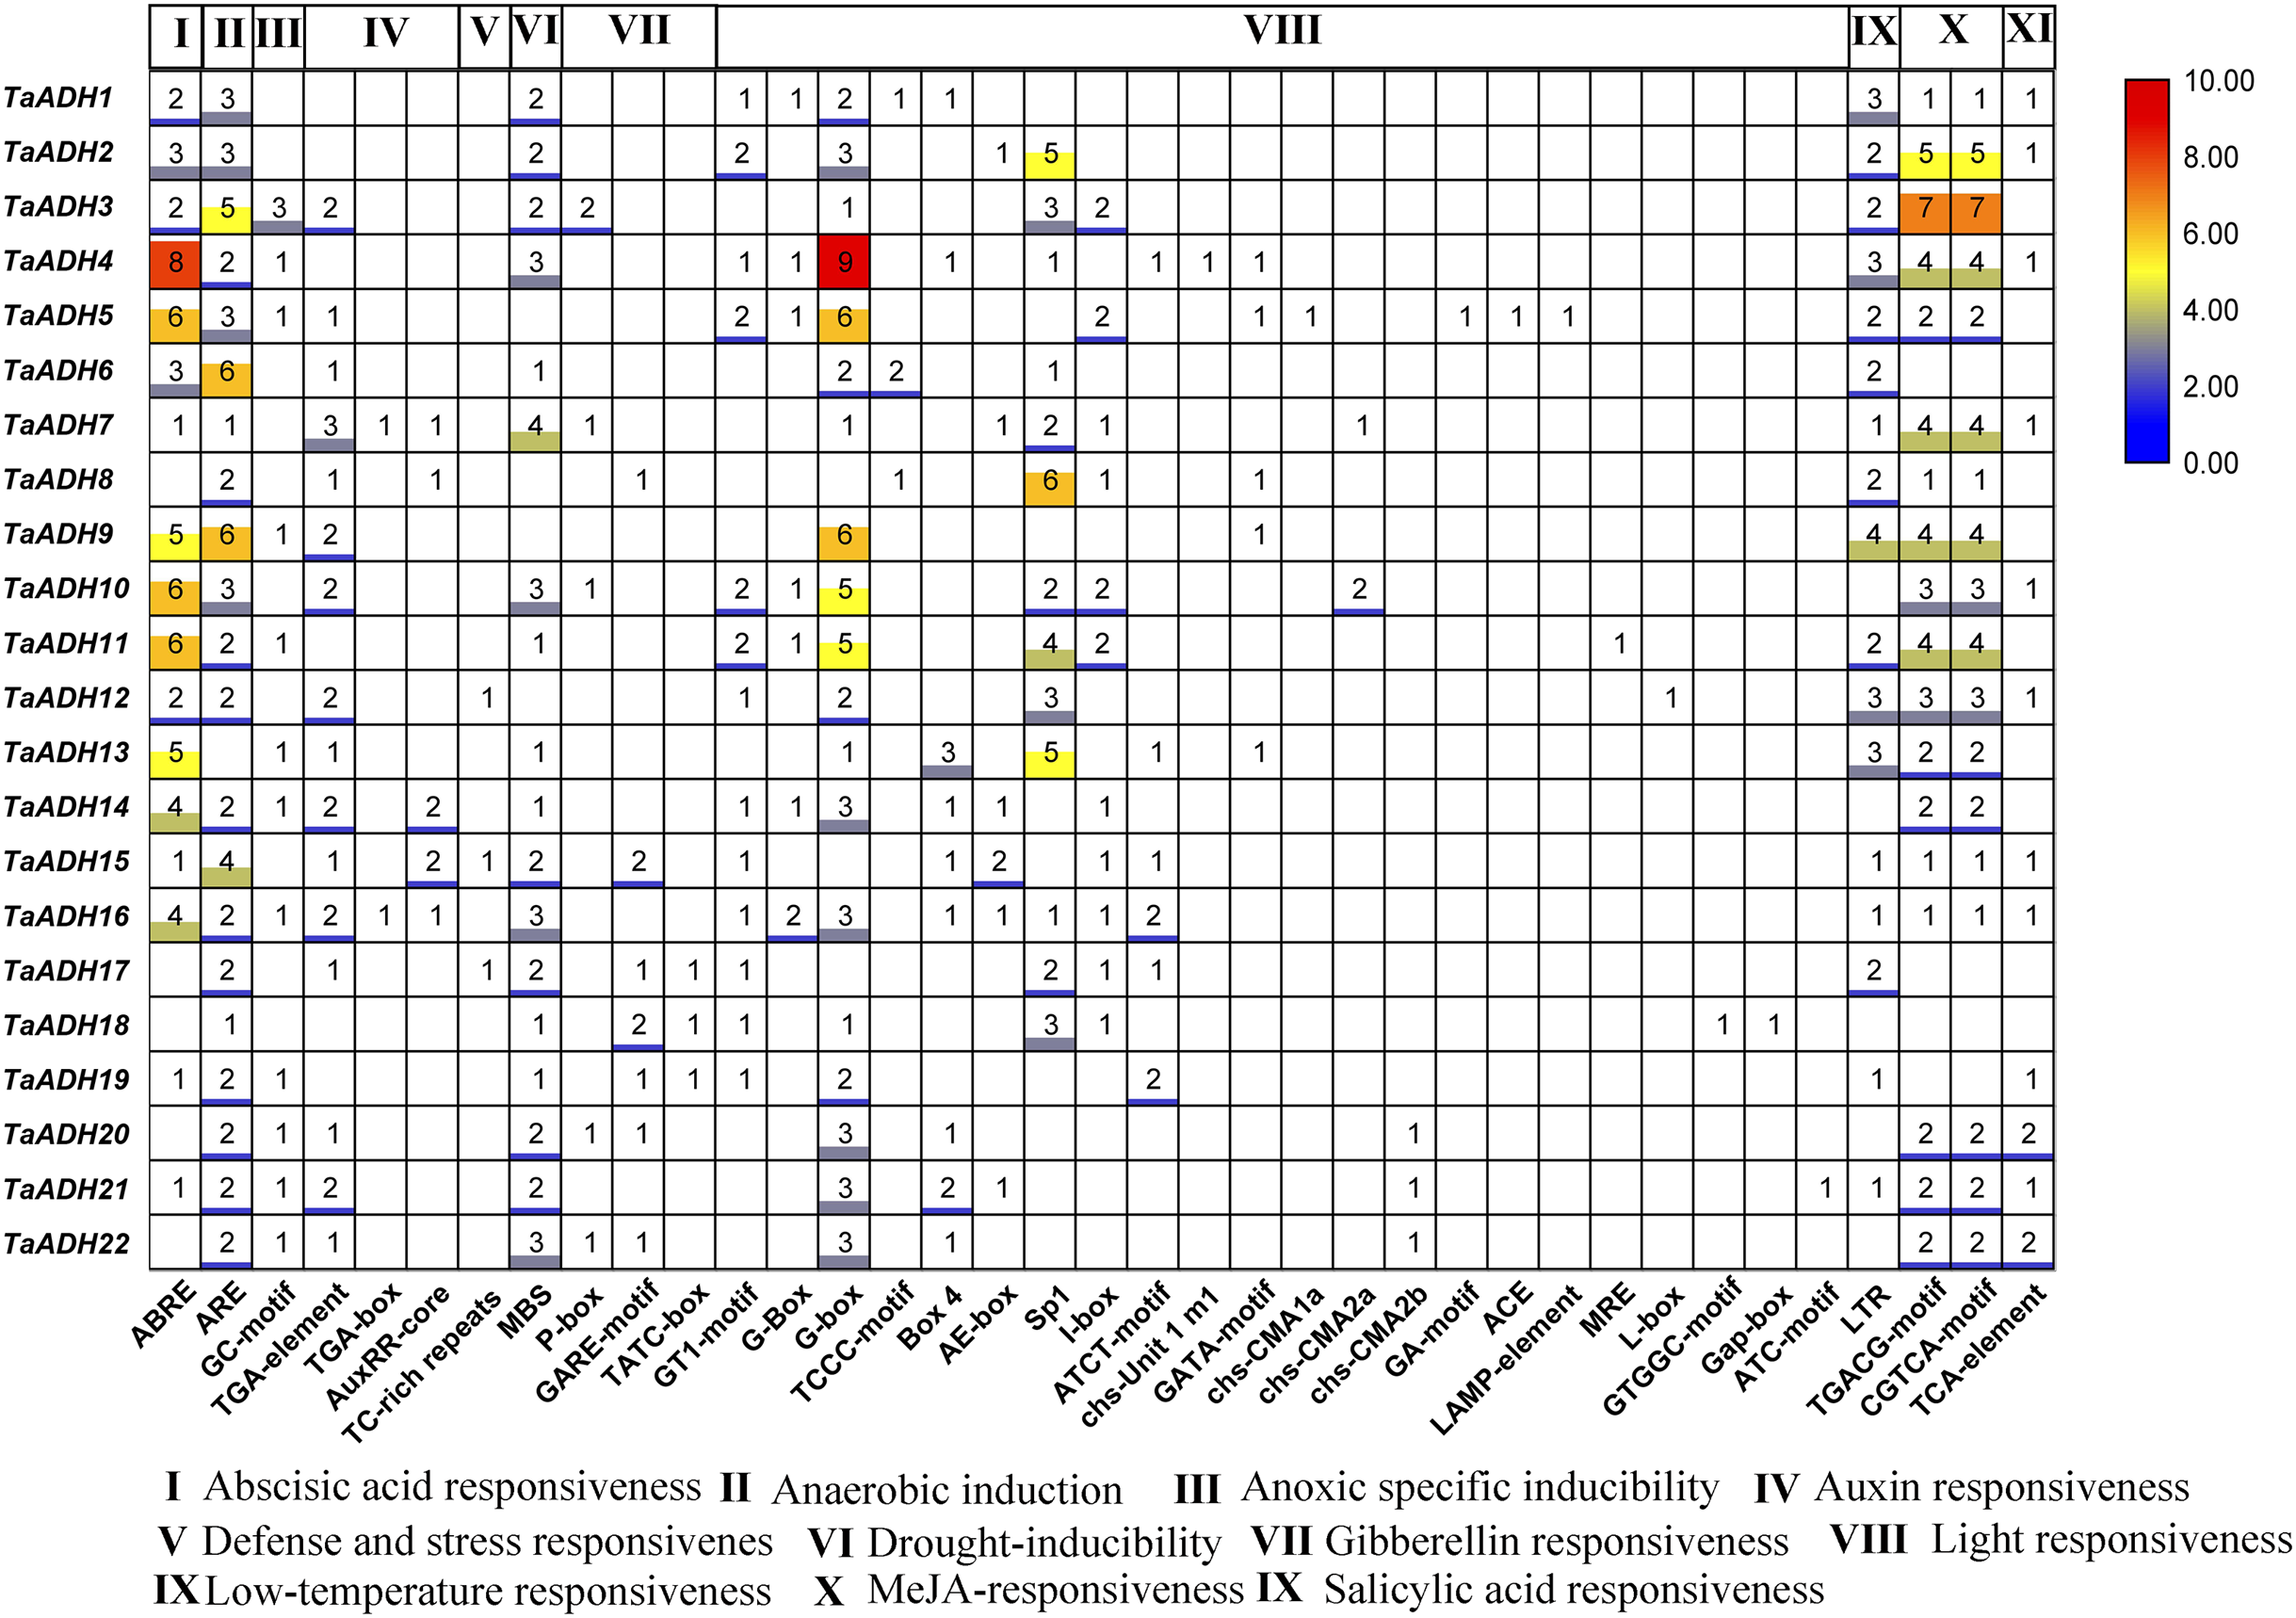
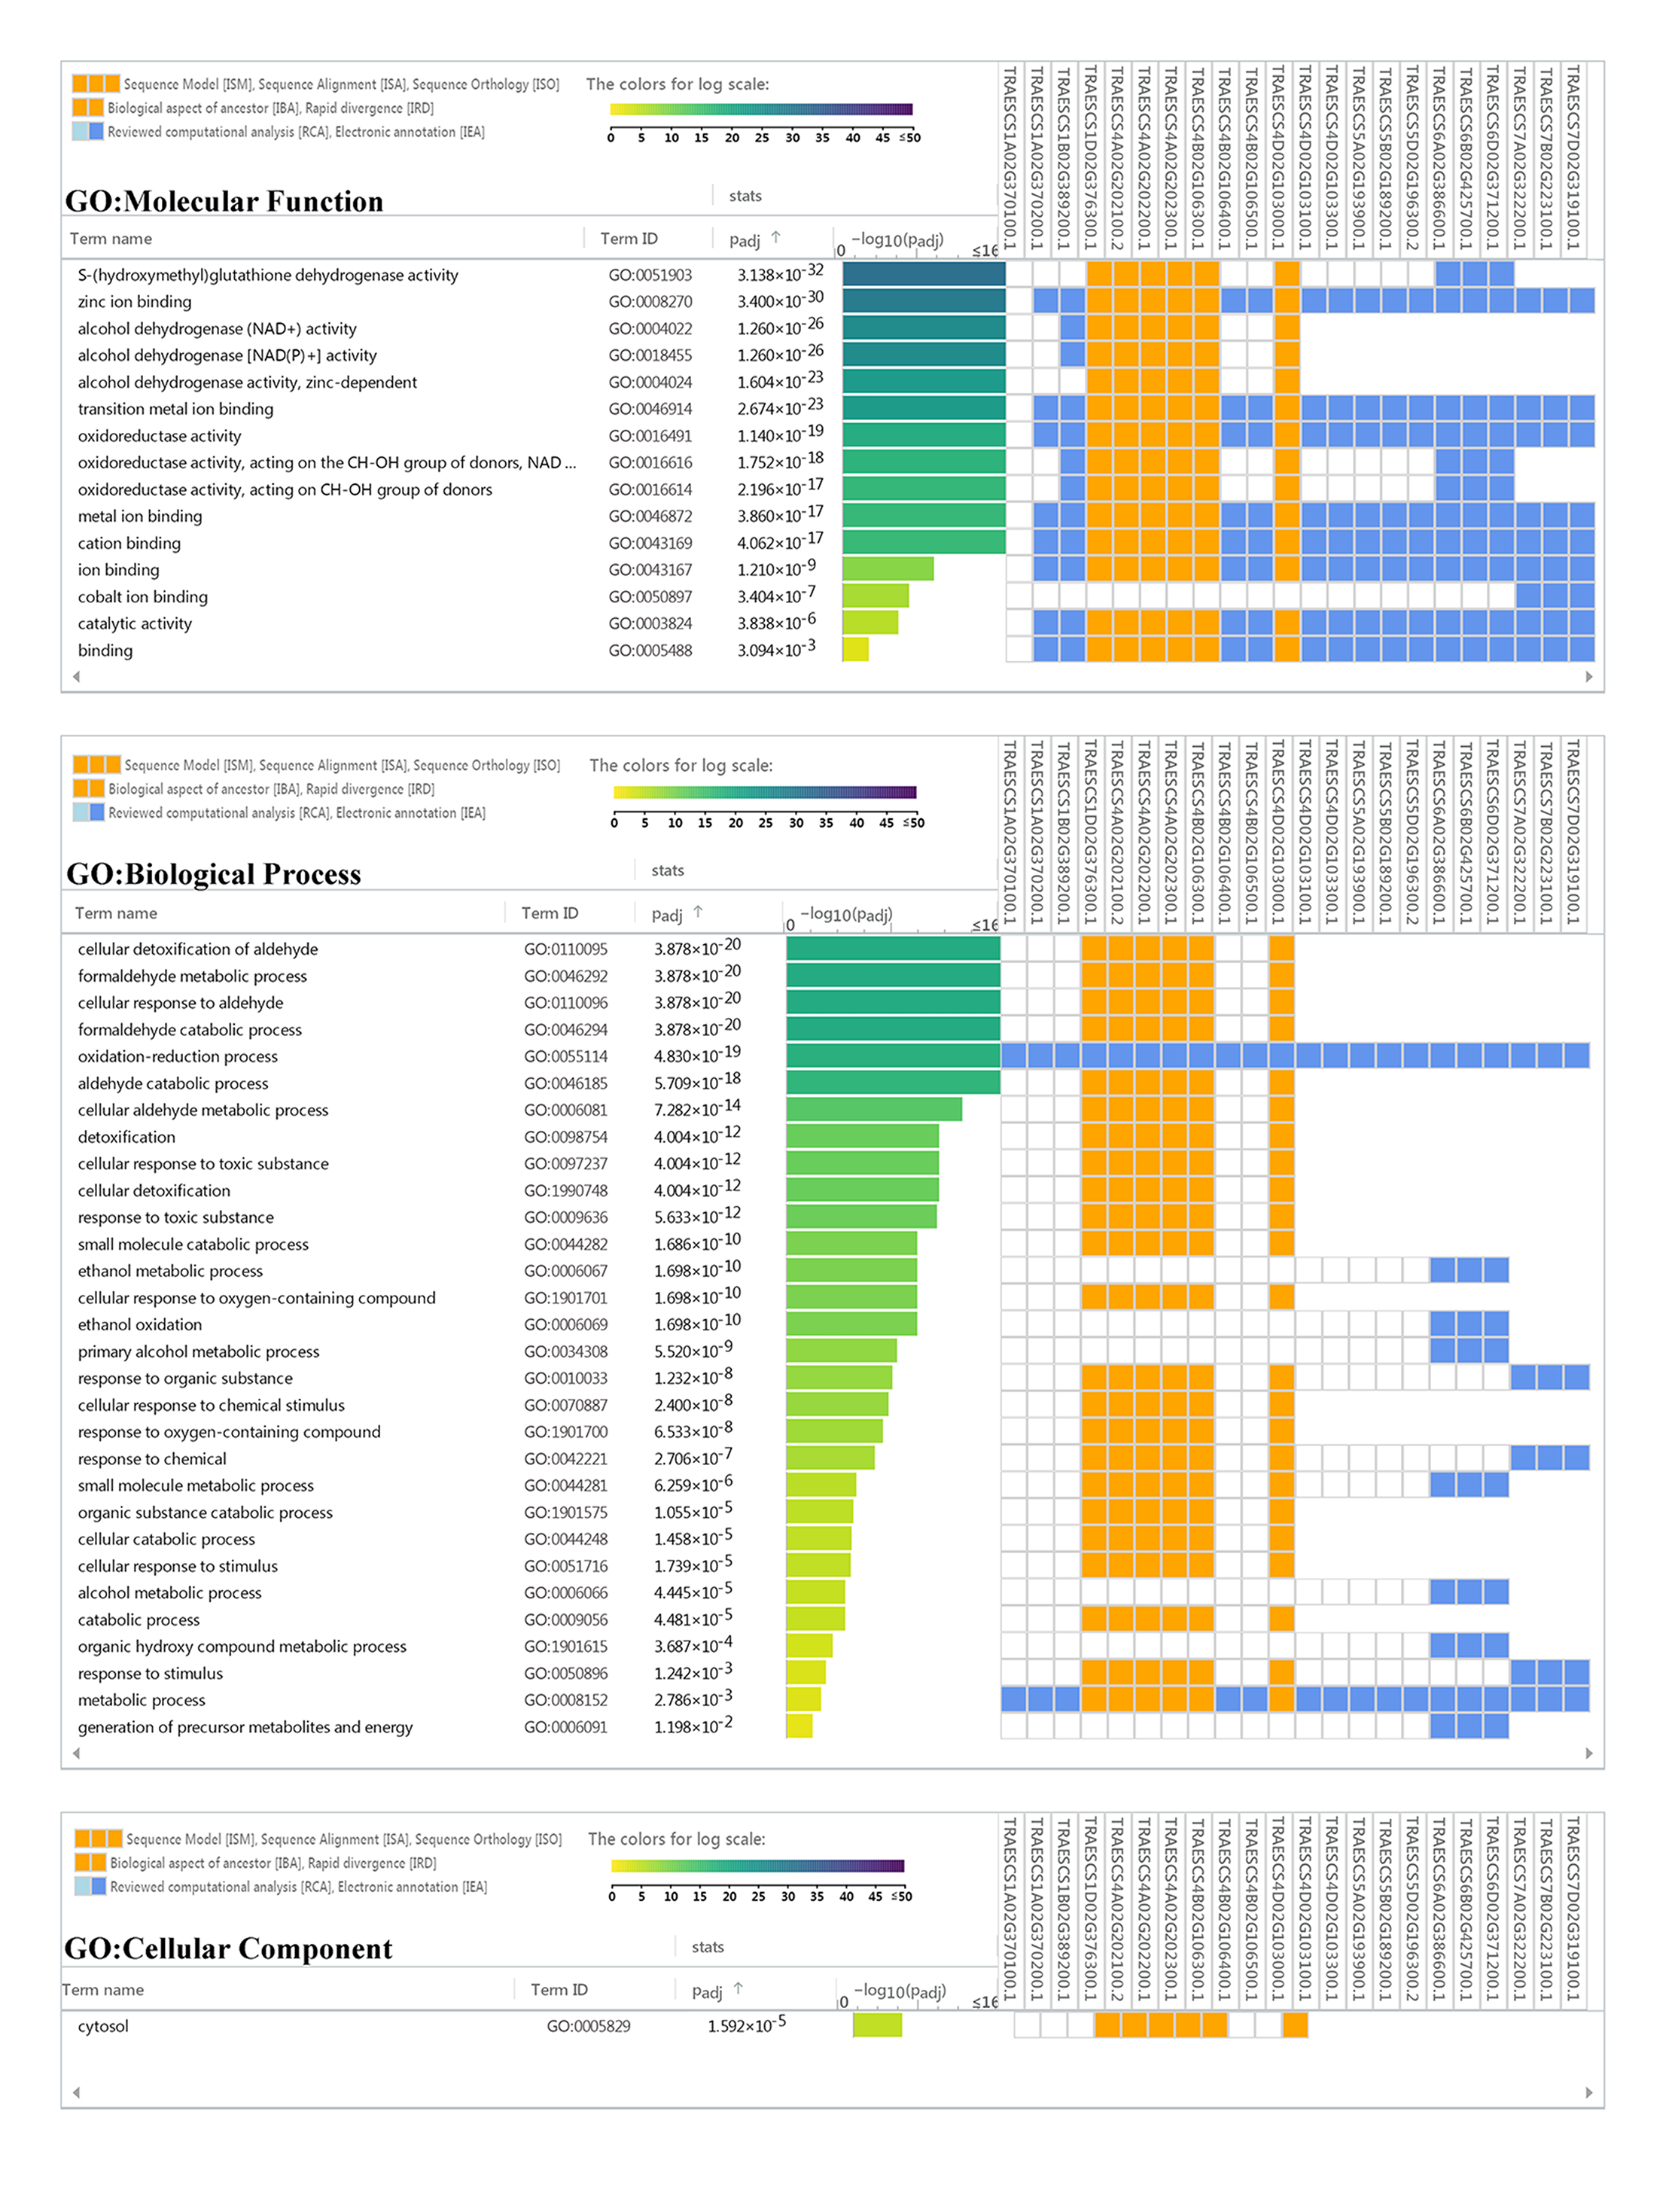
By analyzing the functional characteristics of TaADH genes, namely ‘molecular function’, ‘biological process’, and ‘cellular components’, it can help us understanding the function of proteins at the molecular level. For the category of molecular function (Fig. S3, Table S5), in addition to TaADH1 (TraesCS1A02G370100.1), other 21 TaADH genes were involved 15 GO categories, and they were all associated with “zinc ion binding” (GO:0008270), “oxidoreductase activity” (GO:0016491), “metal ion binding” (GO:0046872), “cation binding” (GO:0043169), “ion binding” (GO:0043167) and “catalytic activity” (GO:0003824). TaADH3 (TraesCS1B02G389200.1) ~ TaADH8 (TraesCS4B02G106300.1) and TaADH11 (TraesCS4D02G103000.1) were involved in “alcohol dehydrogenase activity” (GO:0004022) and “oxidoreductase activity” (GO:0016491). From the perspective of ‘biological process’ categories, all TaADHs participated in 30 GO categories, and they were associated with “oxidation-reduction process (GO:0008152)” and “metabolic process (GO:0055114)”. TaADH4 (TraesCS1D02G376300.1) ~ TaADH8 and TaADH11 genes participated in 24 GO categories. Moreover, TaADH17 (TraesCS6A02G386600.1) ~ TaADH19 (TraesCS6D02G371200.1) were involved with “ethanol metabolic process (GO:0006067)”, “ethanol oxidation (GO:0006069)”, “primary alcohol metabolic process (GO:0034308)” and “alcohol metabolic process (GO:0006066)”. The ‘cell components’ annotation predicted the TaADH4 ~ TaADH8 and TaADH11 existed in cytosol (GO:0005829).
Phenotypic analysis of ZM22 and BN607 under waterlogging stress
ADH gene plays a key role in plants under anaerobic conditions (Bailey-Serres & Voesenek, 2008). To study the expression of the ADH gene (Fig. 7, Table S6) in wheat seeds at 24 and 72 h after waterlogging for 3 days, we selected the seeds of two wheat varieties (Zhoumai 22 (ZM22) and Bainong 2008 (BN607)) for analysis.
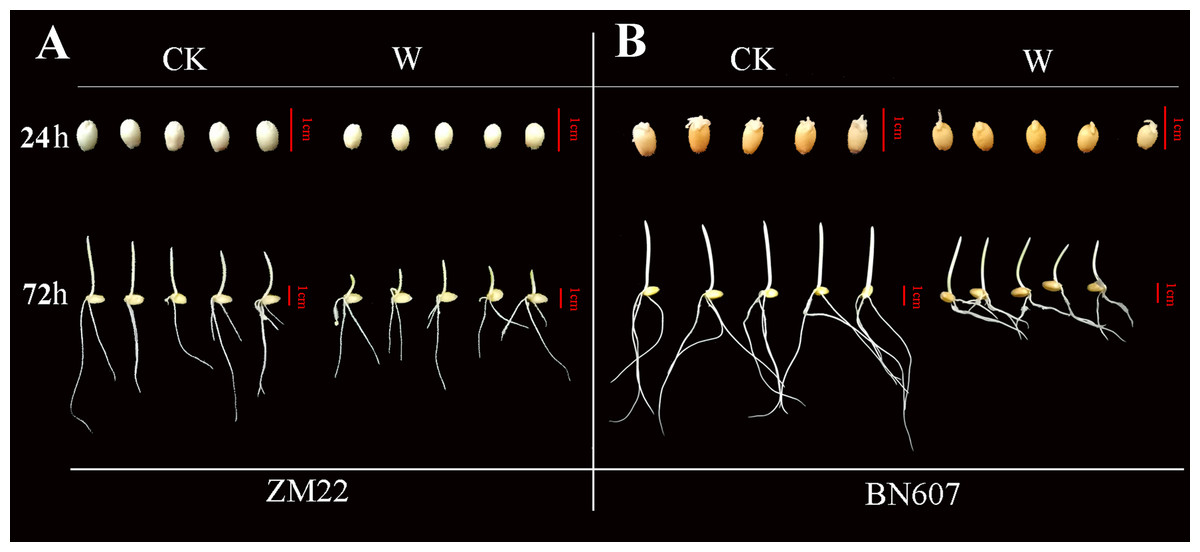
Figure 7: Phenotypic analysis of two kinds of wheat seeds germinated for 24 h and 72 h after waterlogging.
The phenotype of ZM22 was on the left (A), and the phenotype of BN607 was on the right (B). CK, without waterlogging treatment; W, waterlogging treatment. The scale was 1 cm.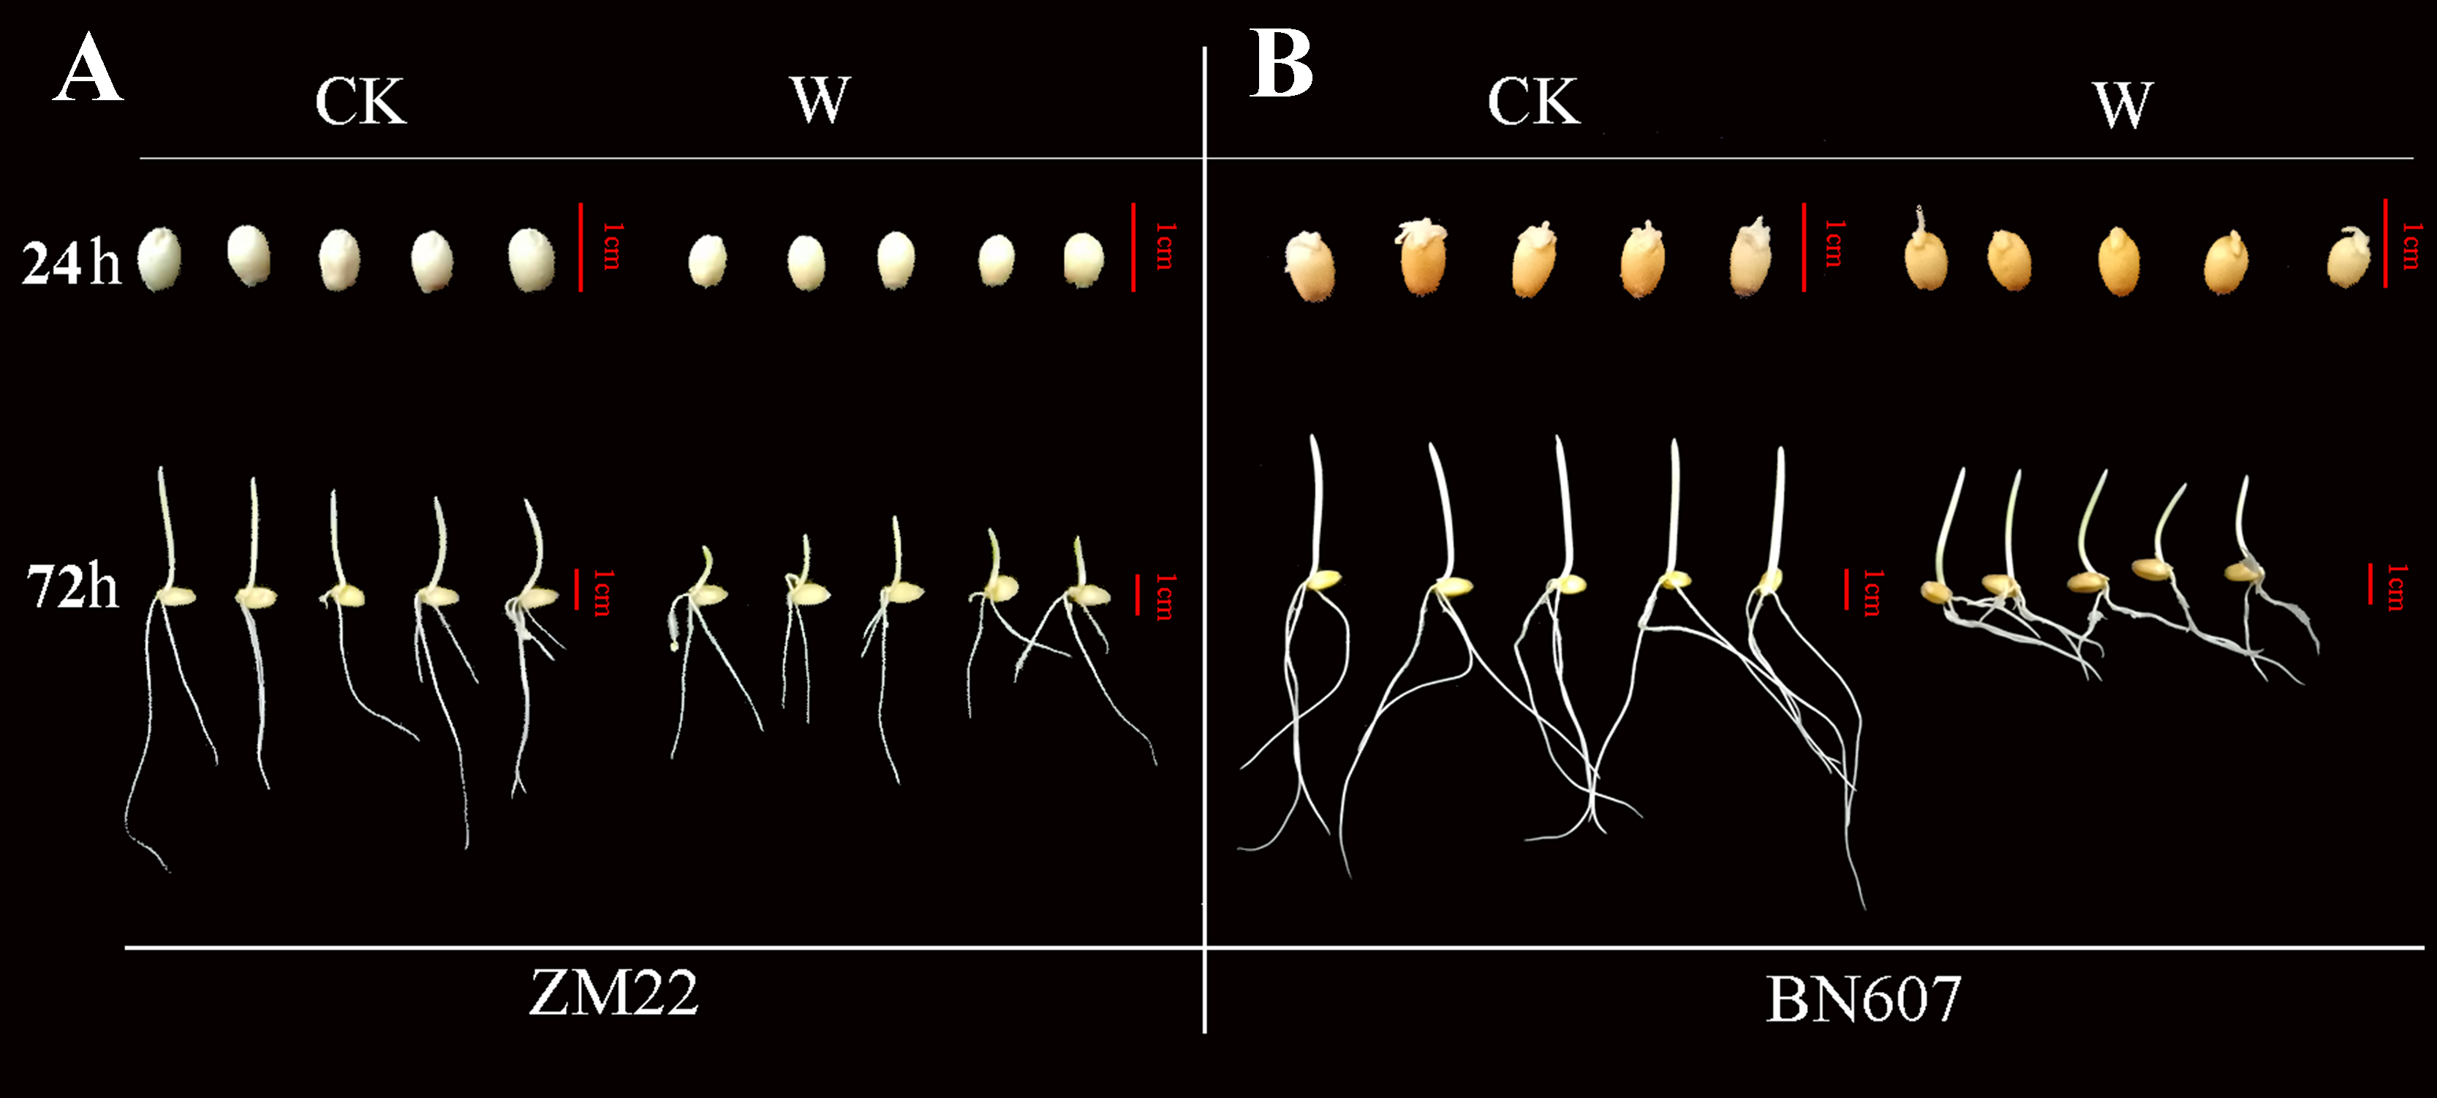
At 24 h after the waterlogging treatment, the bud length of ZM22 and BN607 had no significant difference with the control seeds (no waterlogging treatment). However, all the seeds of ZM22 and BN607 germinated at 72 h after the waterlogging treatment. The bud length of ZM22 was significantly lower than that of the control seeds, while the bud length of BN607 was not significantly different from that of the control seeds (Fig. 7, Table S6), which further indicated that BN607 was more tolerant to waterlogged stress than ZM22.
Expression analysis of TaADH genes under waterlogging treatment
The expression profiles of 22 TaADH genes in ZM22 and BN607 seeds at 24 and 72 h after waterlogging and control treatment were analyzed (Fig. 8, Table S6). The results showed that in ZM22, the expression of TaADH1/2, TaADH13, TaADH17, TaADH18, TaADH19 and TaADH20 was significantly up-regulated at 24 h of germination. However, among these genes, only the TaADH13 gene was significantly induced at 72 h after waterlogging. There was no significant difference in the relative expression level of TaADH1/2, TaADH17, TaADH18, TaADH19 and TaADH20 between the waterlogging and control treatment at 72 h after waterlogging.
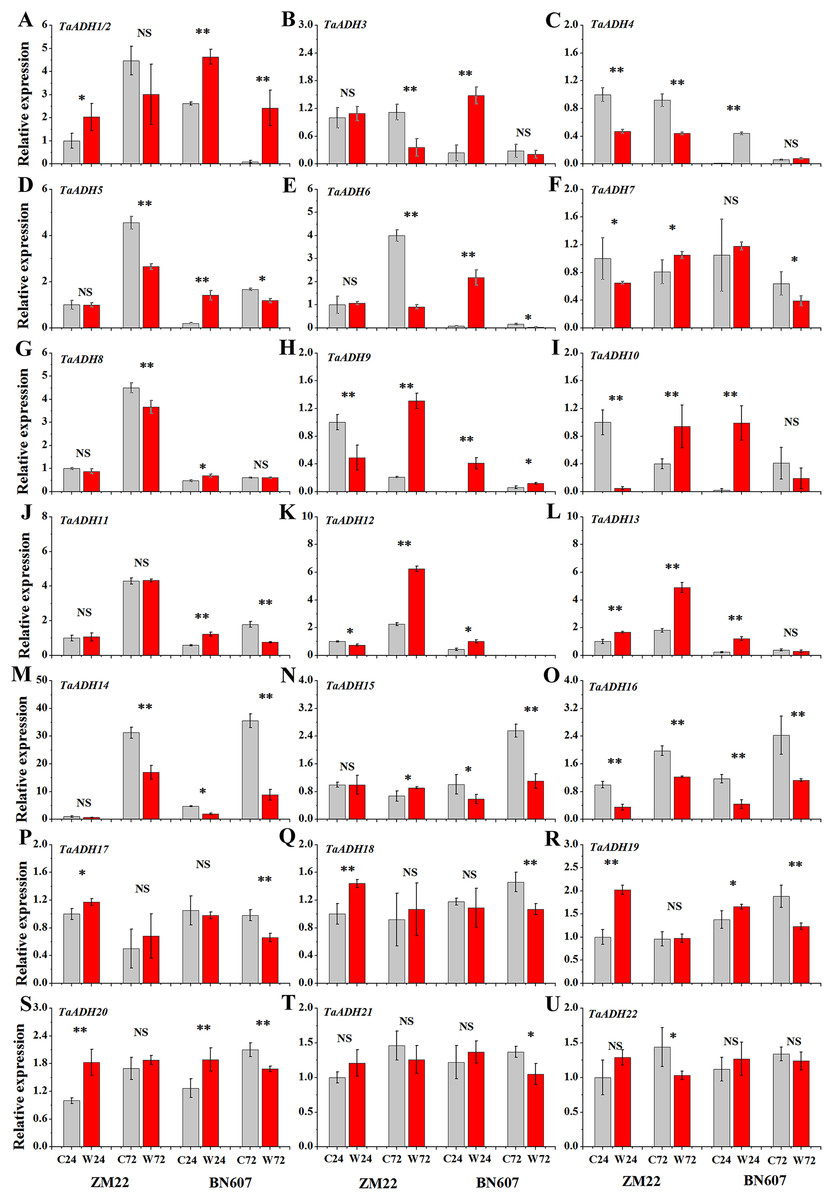
Figure 8: The relative expression profile of TaADH genes (A-U) in seeds of two wheat varieties under waterlogging stress.
ZM22: Zhoumai 22, BN607: Bainong 607; C24: The seeds were directly germinated for 24 h without waterlogging treatment; W24: After being waterlogged, the seeds germinated for 24 h; C72: The seeds were directly germinated for 72 h without waterlogging treatment; W72: After being waterlogged, the seeds germinated for 72 h; each value represents the average of three biological repetitions. The error bars represented the SDs. An asterisk (*) indicates significance at p < 0.05, two asterisks (**) indicates significance at p < 0.01, NS indicates no significance.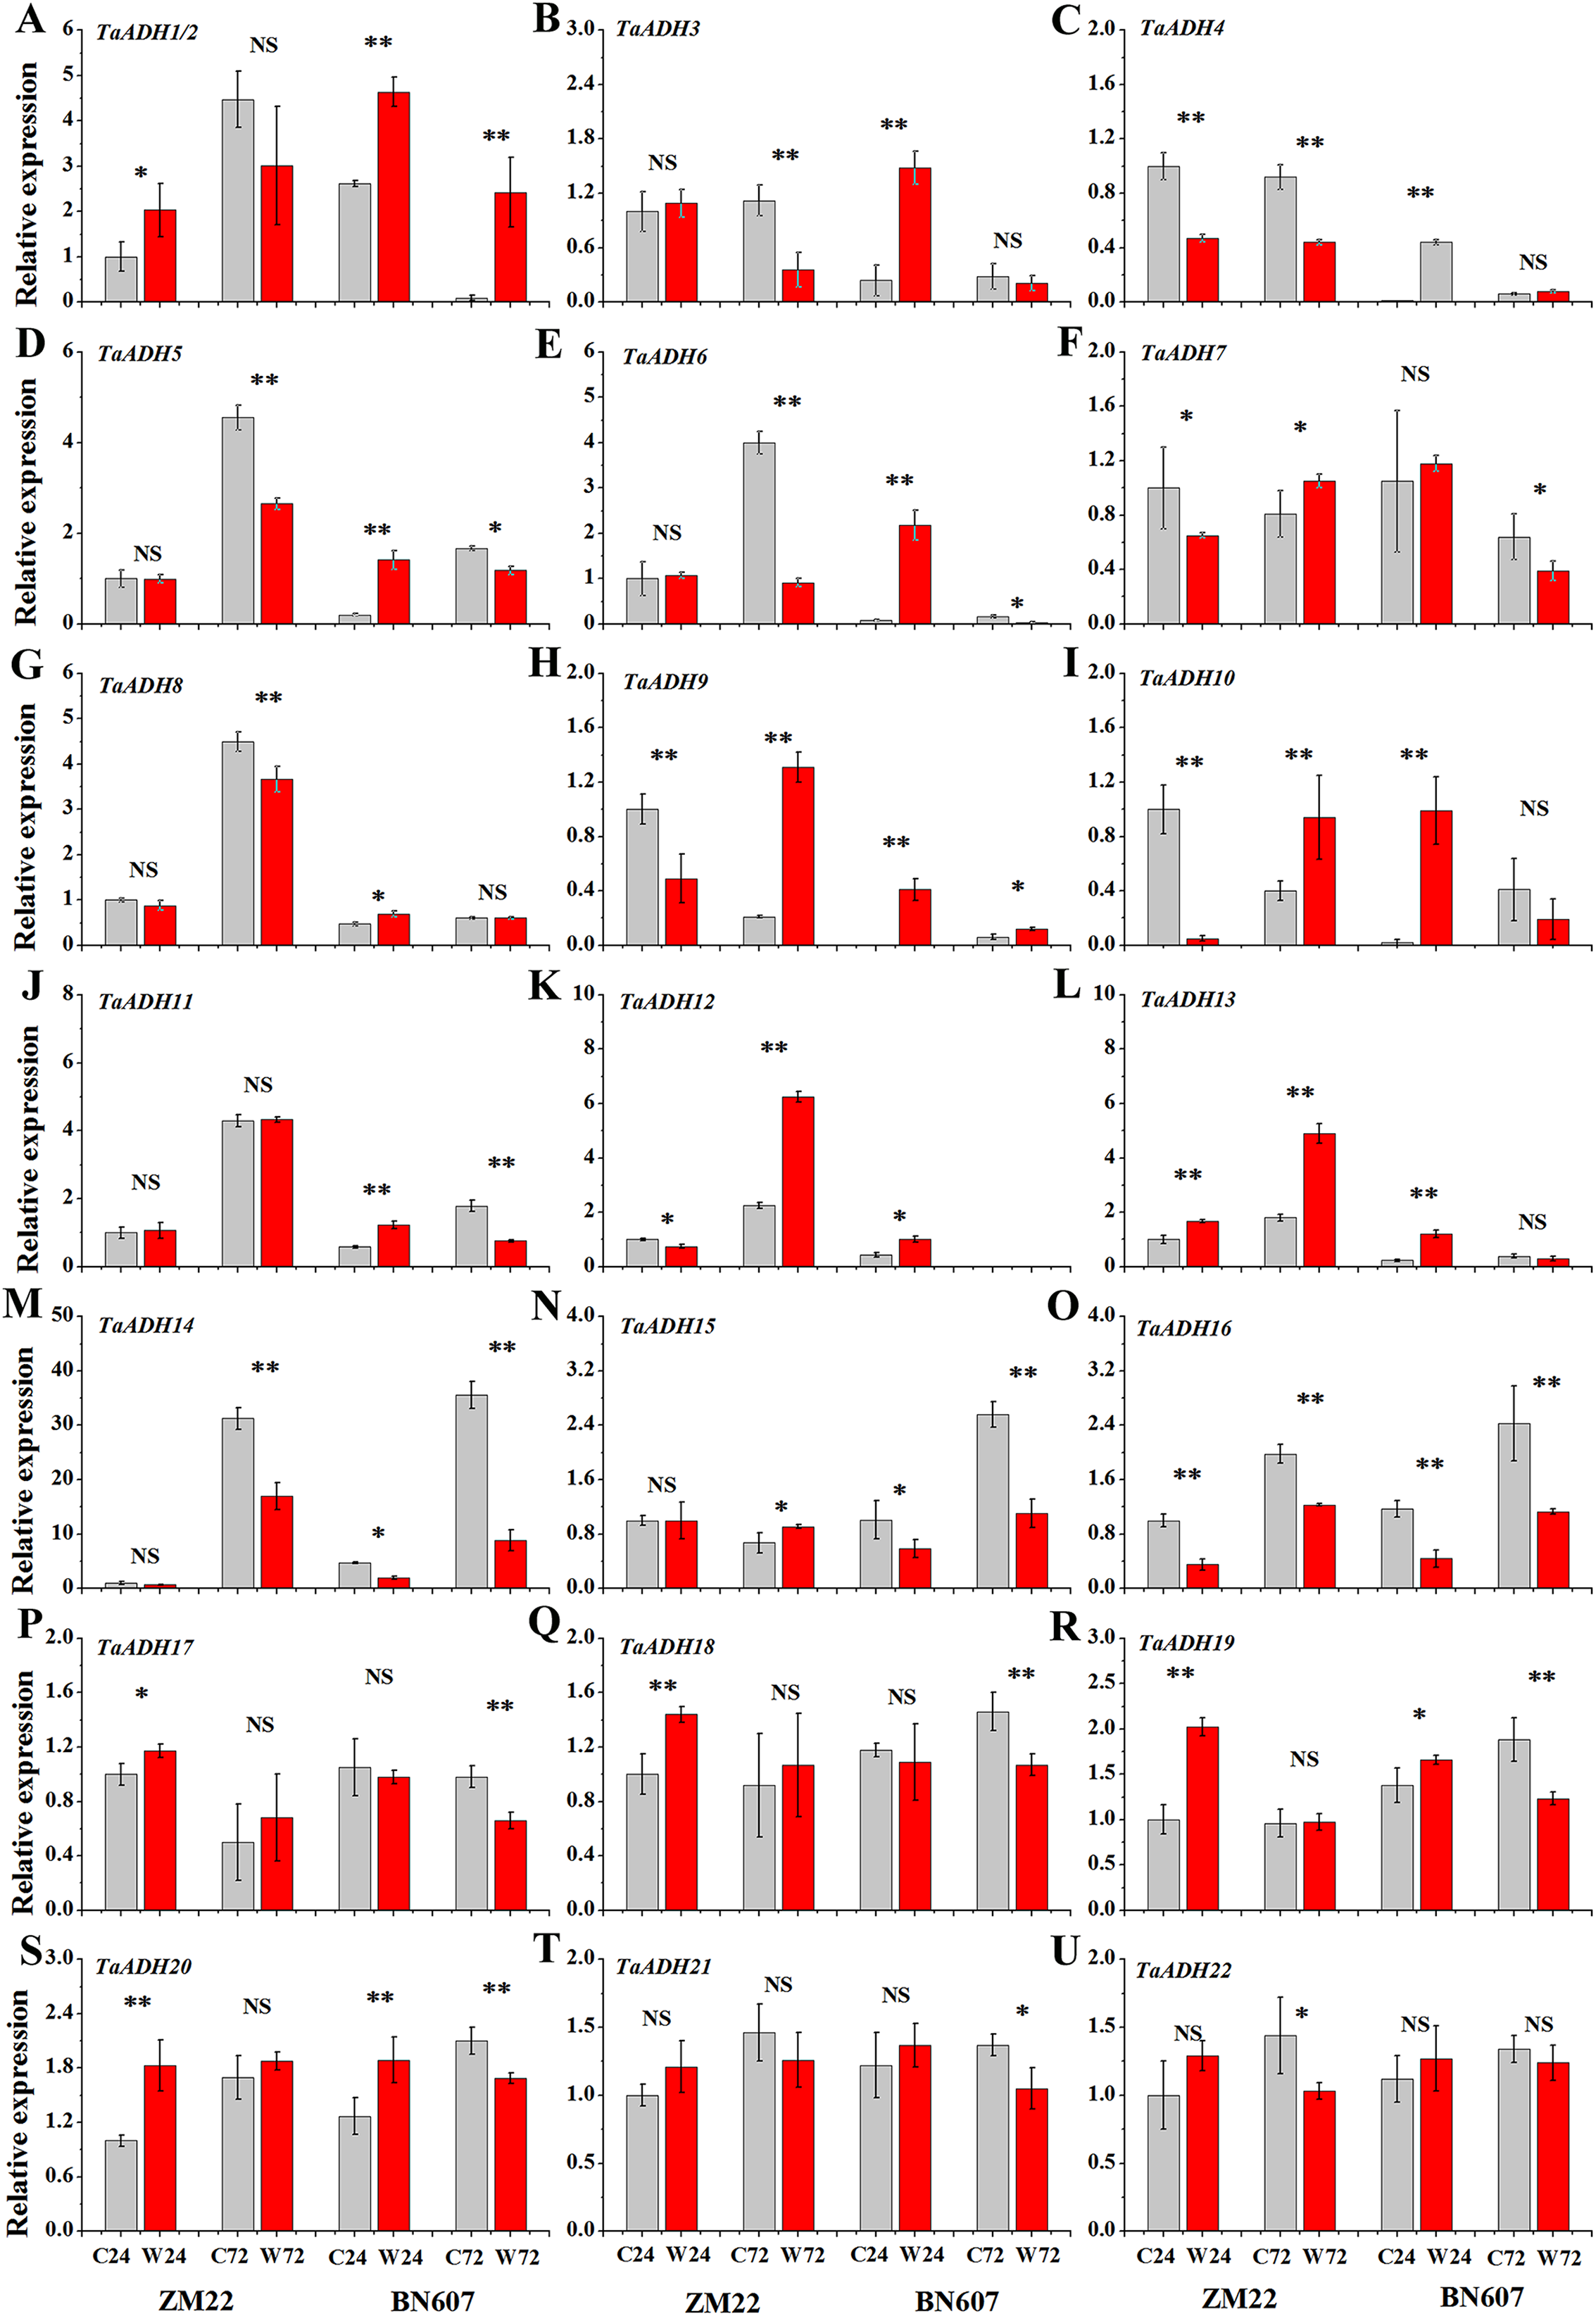
In BN607, the expression of TaADH1/2, TaADH3-6, TaADH8-13, TaADH19 and TaADH20 was significantly up-regulated at 24 h after waterlogging. Besides, TaADH1/2, TaADH3 and TaADH9 genes were also significantly induced at 72 h after waterlogging. Moreover, the relative expression levels of TaADH5, TaADH6, TaADH14 and TaADH16 were significantly lower than that of the control at 72 h after waterlogging (Fig. 8, Table S6). Based on the above analysis, we found that the response of waterlogging-sensitive ZM22 and waterlogging-tolerant BN607 to waterlogging stress at different times mainly depended on the time-specific expression of some key ADH genes in wheat.
Discussion
In recent years, with global warming, extreme weather occurs more frequently, in which flood disaster is one of the abiotic stresses faced by plants, hypoxia will first occur in the flooded environment. Under waterlogging stress, plants often undergo lactic acid fermentation, resulting in cell acidification. To avoid cytoplasmic acidosis, ethanol production is necessary for plants to survive under anaerobic conditions (Roberts et al., 1984). Ethanol dehydrogenase plays a key role in converting ethanol and acetaldehyde (Sasnauskas et al., 1992; Gutheil, Holmquist & Vallee, 1992; Hjelmqvist et al., 1995). With the development of sequencing technology, the genomes of many species can be analyzed, which promotes the identification of the plant ADH gene family at the genome-wide level. ADH family genes from tomato (Moummou et al., 2012), rice (Kitaoka et al., 2016), barley (Kasbauer et al., 2018), Cucumis melon L. (Jin et al., 2016) and Pyrus bretschneideri (Qin et al., 2017) have been detected. Considering the disclosure of the wheat genome, it is possible to systematically identify the TaADH family members.
In this study, 22 ADH genes were identified in the wheat genome. Arabidopsis thaliana ADH1 and ADH3 contained 6 and 4 introns, respectively, while ADH in Chinese cabbage contained five introns (Strommer, 2011). However, there were 7~9 introns in TaADH genes, which was consistent with the number of introns in ADH genes from barley (Strommer, 2011). For example, ADH2/3 in barley and TaADH both contained eight introns.
Plant ADH family were usually divided into short-chain ADH and medium-chain ADH. There was no report on long-chain ADH in plants (Kitaoka et al., 2016). One short-chain alcohol dehydrogenase/reductase SDRs (OsMAS/SDR110C-MS1) was found in rice (Thompson et al., 2007; Borras et al., 2014). Twenty-two TaADHs identified in this study belonged to medium-chain-ADH. These genes have highly conserved functional domain (GroES-like domain and zinc-binding domain) (Fig. S2), which was similar to the structure of PbrADHs in Pyrus bretschneideri (Qin et al., 2017), VvADH2 in Vitis vinifera L. (Tesnière & Verriès, 2000), CmADH1 in Cucumis melon L. (Manríquez et al., 2006) and AtADH1 in Arabidopsis thaliana (Cheng et al., 2013).
Gene duplication is an important evolutionary process of gene family expansion, and gene duplication provides an opportunity for functional differentiation. Functional differences caused by gene duplication are considered to be important factors in species formation and environmental adaptability (Salse et al., 2008; Arsovski et al., 2015; Das et al., 2016; Laha et al., 2020). Therefore, the analysis of duplicated genes can help us to better understand the evolution of genes and species. In this study, we found that there were 64 duplicated gene pairs in the TaADHs family, all of which belong to (MDR)-ADH. Their Ka/ Ks values were all less than 1 (Fig. 3B), which means that all duplicated gene pairs were purified.
The Ks value was used to estimate the evolution time when duplication events occurred. The results showed that the duplicated events of TaADH family genes occurred between 0.90~16.42 Mya. The evolution time of 30 duplicated gene pairs was 11.19~16.42 Mya, and the evolution time of 12 duplicated gene pairs was 7.56~9.56 Mya, which was earlier than the first time of wheat genomic duplication (Ling et al., 2013).
Gene promoters are important factors in regulating gene expression patterns. They regulate gene expression at the transcriptional and post-transcriptional levels (Higo et al., 1998). Cis-acting elements in a specific promoter region participated in tissue-specific expression patterns under various environmental conditions. There was a positive correlation between the number of cis-acting elements and the degree of stimuli (Higo et al., 1998). In this study, some cis-acting elements of stress response, such as ABRE, ARE, MBS, LTR, TGACG-motif and CGTCA-motif, appeared in the promoter region of TaADH genes. They are involved in abscisic acid response, hypoxia induction, drought induction, low temperature response and methyl jasmonate response. 22 TaADH genes had at least one cis-acting element related to stress response, indicating its potential function in response to abiotic stress. We found that 21 TaADH genes (except TaADH13) were induced by waterlogging stress, and the promoters of all genes contained a cis-acting element for anaerobic induction (ARE). An anaerobic response complex (ARC) was found in maize, which consists of 5′ -GC (G/C) CC-3′ ( GC ) and 5′ -GGTTT-3′ (GT) components. It was an essential element for activation of the ADH1 promoter in maize and Arabidopsis under anaerobic induction (Olive et al., 1990; Dolferus et al., 1994). It was found in rice that under waterlogging stress, the Sub1a gene of the ERF family in rice leaves could delay leaf senescence by regulating hormones, and the decrease in ABA content was due to the decrease in the expression of ABA biosynthesis-related genes (Garg et al., 2013; Saha et al., 2021 ). We also found that the promoter regions of 17 TaADH genes contained ABRE elements, indicating that plants would also participate in the adaptive response to environmental stress through a series of hormones (e. g., ethylene and ABA) under waterlogging stress.
There are several scenarios of flooding that provoke oxygen deficiency: waterlogging, which leads to local root hypoxia or anoxia (develops due to the activity of soil bacteria, plant root systems, and other soil biota), as well as complete flooding of the plant (submergence), which is often the cause of total anoxia (Gupta, Zabalza & Van Dongen, 2009). Under waterlogging or submergence, plants are exposed to a reduction in oxygen (O2) supply because of the slow diffusion rate of O2 in water and its limited solubility. Under anaerobic conditions, glycolysis, as well as alcoholic and lactic acid fermentation, are stimulated (Shikov, Chirkova & Yemelyanov, 2020). ADH has a good protective effect on hypoxia stress, seed development and aerobic metabolism of pollen after flooding (Bailey-Serres & Voesenek, 2008; Macnicol & Jacobsen, 2001). ADH activity may play an important role in the process of seed germination under hypoxia stress (Strommer, 2011). There are many kinds of ADH isozyme genes in seeds. Through tracking the activity of ADH isozyme during seed development, we found that ADH isozyme genes have activity at different times. Three ADH genes (HvADH1, HvADH2 and HvADH3) were found in barley. The activity of HvADH1 could be detected during aerobic growth. Hypoxia can induce the expression of HvADH1 and HvADH2, and the expression level of HvADH-3 was significantly lower than that of HvADH1 and HvADH2 under hypoxia (Kasbauer et al., 2018). Pistelli et al. (2012) found that the expression patterns of ADH gene in different between the roots of plum rootstock S. 4 with waterlogging tolerance and the roots of wild type (WT) under waterlogging. Under hypoxia, the transcription level of ADH3 in WT roots did not change, while the transcription level of ADH1 in WT roots was significantly higher than that under oxygen supply. The expression levels of the two genes in the root of plum rootstock S.4 under hypoxia treatment were significantly lower than that of the control treatment. Interestingly, this study also found that the expression patterns of TaADH7 and TaAHD11 genes in ZM22 and BN607 varieties at 72 h after waterlogging treatment were consistent with the expression patterns of ADH1 and ADH3 genes in rootstock WT and S.4 clones of plum rootstock. There were some differences in response patterns of ADH gene expression among different plants under short-term and long-term waterlogging stress. Transcriptional expression of OsADH1 gene in 5-day-old rice seedlings reached the highest level at 24 h under short-term 36 h waterlogging stress (Manangkil, Rafael & Nakamura, 2019). The GmAdh2 gene that responded to flooding was isolated from soybean cultivar Enrei. The expression of GmAdh2 was significantly increased 6 h after flooding and decreased 24 h after floodwater drainage (Komatsu et al., 2011). When Taxodium hybrid ‘Zhongshanshan 406’ of two-year-old was completely submerged in water, the expression levels of ThADH1 and ThADH4 in the roots were increased and the elevated expression pattern were continued until 50th day, and their expression levels in the roots reached 63 and 23 times of those on 0 day, respectively (Xuan et al., 2021). In this study, under short-term waterlogging stress, the TaADH genes in two varieties with different waterlogging tolerance had different expressions patterns at different times. The functions of these genes need to be further verified by experiments.
The functional annotation enrichment showed that most TaADHs were enriched in the oxidoreductase activity and oxidation-reduction process (Fig. S3). The function of these genes was closely related to the differential expression of TaADHs in two different waterlogging-tolerant varieties under waterlogging stress. We also found that TaADH3, TaADH5, TaADH8, TaADH10-11, TaADH14 and TaADH16-22 were expressed in all parts of wheat, which suggested that these genes may be constantly expressed. In rice seedlings, ADH1 and ALDH2a genes were significantly induced under flooding stress, but decreased rapidly after flooding, indicating that the high expression of AHD1 and ALDH2a may be one reason why rice is more tolerant to flooding than other plants (Manangkil, Rafael & Nakamura, 2019). When wheat seeds were exposed to an anaerobic environment (waterlogging treatment), the expression of TaADHs varied with the exposure time. No matter which cultivar studied, Bainong 607 or Zhoumai 22, the expression levels of TaADH1/2, TaADH13, TaADH19 and TaADH20 genes were significantly higher than those of the control 24 h after waterlogging treatment (Fig. 8). Tissue expression analysis showed that the relative expression of these genes was relatively high in grains, especially TaADH1 and TaADH13, which suggested that these genes may play a key role in grains under anaerobic stress. At 72 h after waterlogging treatment, the relative expressions of TaADH1/2, TaADH3 and TaADH9 genes in BN607 were significantly higher than in control. However, only the TaADH13 gene was highly expressed in Zhoumai 22 seeds 72 h after waterlogging treatment (Fig. 8), so it was speculated that TaADH1/2, TaADH3 and TaADH9 play an important role in waterlogging stress and are an important basis for screening waterlogging tolerant wheat varieties.
Conclusions
A total of 22 TaADH genes were identified in the wheat genome. These genes were distributed on 15 chromosomes. All of the TaADH protein sequences contained the GroES-like domain and Zinc-binding domain. Through phylogenetic tree analysis with other species, it was found that 22 TaADH genes in wheat belonged to medium-chain ADH type and were grouped into two subfamilies. There were 64 duplicated gene pairs, and they experienced purification selection. TaADH8, TaADH11, TaADH18, TaADH17, TaADH19, TaADH5, TaADH22, TaADH20 and TaADH21 were highly expressed in all tissues, and the remaining TaADH genes had tissue-specific. Cis-acting elements analysis showed that 22 TaADH genes were responsive to 11 kinds of abiotic stress, 21 of which responded to anaerobic stress. By comparing the expression profiles of waterlogging-tolerant wheat Bainong 607 and waterlogging-intolerant wheat Zhoumai 22 at the germination stage after waterlogging treatment, some key candidate genes of wheat waterlogging-tolerant were identified. These results will provide valuable information regarding further functional elucidation of TaADH genes in wheat.
Supplemental Information
Supplemental Information 1
List of primer sequences used for qRT-PCR analysis.
Supplemental Information 2
The coding sequence and protein sequence for 22 TaADHs.
Ka/Ks calculation and estimated divergence time for the TaADH duplicated gene pairs.
Detailed information about cis -acting elements of TaADH gene promoter.
The relative expression level of TaADH genes under waterlogging stress and the determination of bud length of two kinds of wheat seeds after 72 h of germination.
The amino acid sequences alignment of TaADH proteins. Sequence alignment was performed using the DNAMAN5.0 program.
The GroES-like domain and zinc-binding domain were labelled with green and black, respectively.
Gene Ontology (GO) analysis in TaADH genes.
The GO enrichment analyses were performed by g:Profiler (version e102_eg49_p15_7a9b4d6) (https://biit.cs.ut.ee/gprofiler/gost) with g:SCS multiple testing correction method applying significance threshold of 0.05. The adjusted p-values of the enrichment significant were transformed by −log10.